, is generated over finite area,  , of the plane and the velocity over the remainder of the plane is assumed to be zero (rigid baffle model) . The element will radiate waves into a fluid which occupies the half space
  . Following the same steps used in Chap. 2, from the equations of motion and constitutive equation one can show that the pressure,
  , in the fluid will satisfy the 3-D wave equation [Schmerr]
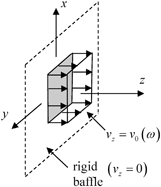
Fig. 6.1
Model of an element as a velocity source in an infinite, motionless rigid baffle radiating into a fluid occupying the region  , where the specific velocity distribution shown is spatially uniform over the face of the element (piston model)
 , where the specific velocity distribution shown is spatially uniform over the face of the element (piston model)
(6.1)
where the wave speed is given by Eq. (2.4). We will again typically model wave propagation for these three dimensional problems in the frequency domain. Taking the Fourier transform on time of Eq. (6.1) gives the three dimensional Helmholtz equation

(6.2)
for  , where consistent with Chap. 2 we define the forward and inverse Fourier transforms on time here as:
 , where consistent with Chap. 2 we define the forward and inverse Fourier transforms on time here as:
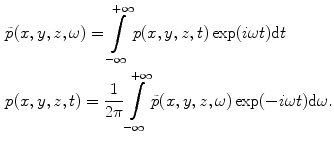
(6.3)
Once again, since our 3-D models will primarily be described in the frequency domain we will drop the tilde on the Fourier transformed pressure (and the Fourier transform of other variables such as the velocity) and simply express that transform as  .
.
 .
.The 3-D Helmholtz equation has wave solutions given as

(6.4)
with
 . For
. For  Eq. (6.4) represents harmonic plane waves traveling with a positive z-component,
  , and with components
  coordinates
  ,
,  (in spherical coordinates—see Fig. 6.2). For
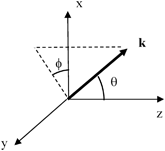
Fig. 6.2
Description of the wave number vector,  , in spherical coordinates
 , in spherical coordinates
![$$ p(\mathbf{x},\omega )={{\left( \frac{1}{2\pi } \right)}^{2}}\int\limits_{-\infty }^{+\infty }{\int\limits_{-\infty }^{+\infty }{P( {{k}_{x}},{{k}_{y}} )\exp [ i( {{k}_{x}}x+{{k}_{y}}y+{{k}_{z}}z ) ]\text{d}{{k}_{x}}\text{d}{{k}_{y}}}}, $$](/wp-content/uploads/2016/05/A314073_1_En_6_Chapter_Equ6.gif)
(6.6)
with  . Equation (6.6) is a 3-D angular plane wave spectrum representation analogous to Eq. (2.10). It can be seen from Eq. (6.6) that the amplitude term
  is a two dimensional spatial Fourier transform of the pressure on the plane
  since we have the transform pair:
 . Equation (6.6) is a 3-D angular plane wave spectrum representation analogous to Eq. (2.10). It can be seen from Eq. (6.6) that the amplitude term
  is a two dimensional spatial Fourier transform of the pressure on the plane
  since we have the transform pair:
(6.7)

(6.8)
we have
![$$ {{v}_{z}}(x,y,z=0,\omega )={{\left( \frac{1}{2\pi } \right)}^{2}}\int\limits_{-\infty }^{+\infty }{\int\limits_{-\infty }^{+\infty }{\frac{{{k}_{z}}P( {{k}_{x}},{{k}_{y}} )}{\omega \rho }\exp [i( {{k}_{x}}x+{{k}_{y}}y )]\text{d}{{k}_{x}}\text{d}{{k}_{y}}}} $$](/wp-content/uploads/2016/05/A314073_1_En_6_Chapter_Equ9.gif)
(6.9)
and if we let

(6.10)
we have
![$$ {{v}_{z}}(x,y,z=0,\omega )={{\left( \frac{1}{2\pi } \right)}^{2}}\int\limits_{-\infty }^{+\infty }{\int\limits_{-\infty }^{+\infty }{V( {{k}_{x}},{{k}_{y}} )\exp [i( {{k}_{x}}x+{{k}_{y}}y )]\text{d}{{k}_{x}}\text{d}{{k}_{y}}}}. $$](/wp-content/uploads/2016/05/A314073_1_En_6_Chapter_Equ11.gif)
(6.11)
We recognize  as the two dimensional spatial Fourier transform of the velocity,
  , on the plane z = 0, i.e.
 as the two dimensional spatial Fourier transform of the velocity,
  , on the plane z = 0, i.e.
(6.12)
Since we wish to write the pressure in the fluid in terms of this velocity, from Eqs. (6.6) and (6.10) we have
![$$ p(\mathbf{x},\omega )={{\left( \frac{1}{2\pi } \right)}^{2}}\int\limits_{-\infty }^{+\infty }{\int\limits_{-\infty }^{+\infty }{\frac{\rho \omega V( {{k}_{x}},{{k}_{y}} )}{{{k}_{z}}}\exp [ i( {{k}_{x}}x+{{k}_{y}}y+i{{k}_{z}}z ) ]\text{d}{{k}_{x}}\text{d}{{k}_{y}}}}. $$](/wp-content/uploads/2016/05/A314073_1_En_6_Chapter_Equ13.gif)
(6.13)
We can now use the convolution theorem [Schmerr] for two dimensional Fourier transforms to turn Eq. (6.13) into a more explicit relationship between the pressure and the velocity on the plane z = 0. The convolution theorem states that if a function  can be expressed as the inverse 2-D Fourier transform of a product of transforms,
  and
and  , i.e.
 can be expressed as the inverse 2-D Fourier transform of a product of transforms,
  and
and  , i.e.
![$$ f(x,y)={{\left( \frac{1}{2\pi } \right)}^{2}}\int\limits_{-\infty }^{+\infty }{\int\limits_{-\infty }^{+\infty }{H( {{k}_{x}},{{k}_{y}} )G( {{k}_{x}},{{k}_{y}} )\exp [ i( {{k}_{x}}x+{{k}_{y}}y ) ]\text{d}{{k}_{x}}\text{d}{{k}_{y}}},} $$](/wp-content/uploads/2016/05/A314073_1_En_6_Chapter_Equ14.gif)
(6.14)
then  is also equal to the 2-D convolution of the functions
  and
and  given as:
 is also equal to the 2-D convolution of the functions
  and
and  given as:
(6.15)
where  is the inverse Fourier transform of
  and
and  is the inverse Fourier transform of
  . We can use this theorem directly for Eq. (6.13) if we let
 is the inverse Fourier transform of
  and
and  is the inverse Fourier transform of
  . We can use this theorem directly for Eq. (6.13) if we let
![$$ \begin{aligned}& H( {{k}_{x}},{{k}_{y}} )=-i\omega \rho V( {{k}_{x}},{{k}_{y}} ) \\& G( {{k}_{x}},{{k}_{y}} )=\frac{\exp [ i{{k}_{z}}z ]}{-i{{k}_{z}}}.\end{aligned} $$](/wp-content/uploads/2016/05/A314073_1_En_6_Chapter_Equ16.gif)
(6.16)
Since  is the Fourier transform of
  it follows that here
 is the Fourier transform of
  it follows that here
(6.17)
The transform  can be identified as the transform of a spherical wave from the Weyl representation [1]
 can be identified as the transform of a spherical wave from the Weyl representation [1]
![$$ \frac{\exp ( ik\sqrt{{{x}^{2}}+{{y}^{2}}+{{z}^{2}}} )}{\sqrt{{{x}^{2}}+{{y}^{2}}+{{z}^{2}}}}={\left( \frac{1}{2\pi } \right)}^{2}\int\limits_{-\infty }^{+\infty }{\int\limits_{-\infty }^{+\infty }}{\left[ \frac{\exp ( i{{k}_{z}}z) }{-i{{k}_{z}}}\right ]\exp ( i{{k}_{x}}x+i{{k}_{y}}y )\text{d}{{k}_{x}}\text{d}{{k}_{y}}} $$](/wp-content/uploads/2016/05/A314073_1_En_6_Chapter_Equ18.gif)
(6.18)
so that the convolution theorem gives the pressure in the fluid as

(6.19)
where

(6.20)
Equation (6.19) is a Rayleigh-Sommerfeld integral representation of the pressure wave field of an element in terms of an integral superposition of spherical waves over the plane z = 0 [Schmerr]. When the velocity field is a spatial constant,  , over the surface,
  , of an element, then we find the Rayleigh-Sommerfeld form for a piston transducer:
 , over the surface,
  , of an element, then we find the Rayleigh-Sommerfeld form for a piston transducer:
(6.21)
6.2 Far Field Waves
When the distance from the element to the point in the fluid where the pressure is being calculated is sufficiently large, the distance,  , can be approximated to first order as (see Fig. 6.3) :
 , can be approximated to first order as (see Fig. 6.3) :
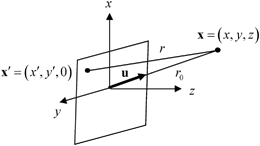
Fig. 6.3
Geometry for obtaining the far field behavior of an element

(6.22)
where  and u is a unit vector from the centroid of the element to the point
  in the fluid. If we keep only the first term in Eq. (6.22) for the
  amplitude part in Eq. (6.19) and both terms in the phase
  , we obtain
 and u is a unit vector from the centroid of the element to the point
  in the fluid. If we keep only the first term in Eq. (6.22) for the
  amplitude part in Eq. (6.19) and both terms in the phase
  , we obtain
(6.23)
where  . But from Eq. (6.12) we recognize the integral as just the 2-D Fourier transform of the normal velocity on the plane z = 0, so the far field pressure is given by
 . But from Eq. (6.12) we recognize the integral as just the 2-D Fourier transform of the normal velocity on the plane z = 0, so the far field pressure is given by
(6.24)
For a rectangular piston element of length  in the x-direction and length
  in the y-direction
 in the x-direction and length
  in the y-direction
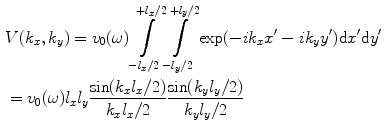
(6.25)
so the far field pressure is

(6.26)

(6.27)
which represents a spherically spreading wave from the element with a directivity,  , given by
 , given by
(6.28)
6.3 Numerical Point Source Piston Model
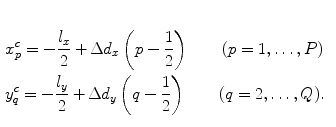
To evaluate the Rayleigh-Sommerfeld model of Eq. (6.21) numerically we can break a rectangular element of length  in the x-direction and length
  in the y-direction into P equal length segments along the x-axis and Q equal length segments along the y-axis (see Fig. 6.4). The lengths of these segments, therefore, will be
  in the x-direction and
  in the y-direction. In this case, the coordinates of the centroid
  of the
  rectangular segment can be defined as
 in the x-direction and length
  in the y-direction into P equal length segments along the x-axis and Q equal length segments along the y-axis (see Fig. 6.4). The lengths of these segments, therefore, will be
  in the x-direction and
  in the y-direction. In this case, the coordinates of the centroid
  of the
  rectangular segment can be defined as
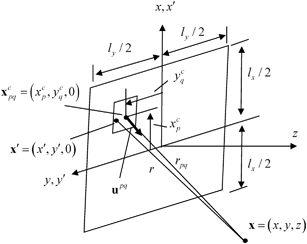
Fig. 6.4
Parameters for evaluating the Rayleigh–Sommerfeld model of an element radiating into a fluid
(6.29)
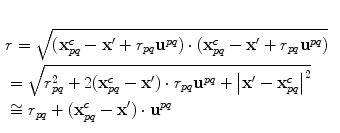
A unit vector,  , is defined to be along the axis from this centroid
  to a point
  in the fluid (Fig. 6.4). If we let an arbitrary point in this rectangular segment be
  then the distance, r, from
  to x is given by
 , is defined to be along the axis from this centroid
  to a point
  in the fluid (Fig. 6.4). If we let an arbitrary point in this rectangular segment be
  then the distance, r, from
  to x is given by
(6.30)
since we will also assume the segment dimensions  and
and  are small relative to the distance,
  , at which we will want to evaluate the pressure wave field. In this approximation Eq. (6.21) can then be written as a sum given by
 and
and  are small relative to the distance,
  , at which we will want to evaluate the pressure wave field. In this approximation Eq. (6.21) can then be written as a sum given by
![$$ p(\mathbf{x},\omega )=\frac{-i\omega \rho {{v}_{0}}(\omega )}{2\pi }\sum\limits_{p=1}^{P}{\sum\limits_{q=1}^{Q}{\frac{\exp ( ik{{r}_{pq}} )}{{{r}_{pq}}}}}\int\limits_{{{S}_{pq}}}{\exp [ ik( {{\mathbf{x}}_{pq}}-\mathbf{{x}'} )\cdot {{\mathbf{u}}^{pq}} ]\text{d}S}, $$](/wp-content/uploads/2016/05/A314073_1_En_6_Chapter_Equ31.gif)
(6.31)

(6.32)
But, integrals of similar form have been done before (see Eq. 6.25 for example) so we obtain

(6.33)
If we compare this result with Eq. (6.26) we see the product of the sinc function terms in Eq. (6.33) is just the far field directivity for each segment of the element. These directivities multiply a spherically spreading wave from the centroid of each segment. A similar form for 2-D problems (see Eq. (2.59)) involved a directivity and a cylindrically spreading wave. We called that model a multiple line source model. Since the spherical wave term in Eq. (6.33) represents waves from a point source, the 3-D model obtained in Eq. (6.33) will be similarly called a multiple point source model . In this model the centroid terms  are given by Eq. (6.29), the distance,
  , is simply
 are given by Eq. (6.29), the distance,
  , is simply
(6.34)
and the components of the unit vector,  , are
, are
 , are
, are
(6.35)
As in our discussion of the multiple line source model, there is a minimum number of segments needed to avoid grating lobes and aliasing. In the 3-D case for a rectangular element we must keep  , where
  is the wavelength. We can do this by choosing
 , where
  is the wavelength. We can do this by choosing
 in mm, and c is in m/s.
Equation (6.33) has been implemented in the 3-D point source MATLAB® function ps_3Dv (Code Listing C.20) where the centroid of the element is assumed to have offsets  in the
  directions, respectively. The calling sequence for this function is
 in the
  directions, respectively. The calling sequence for this function is
p = ps_3Dv(lx, ly, f, c, ex, ey, x, y, z, Popt, Qopt);
where (lx, ly) are the lengths of the elements in the x– and y-directions (in mm), f is the frequency (in MHz), c is the wave speed (in m/s), (ex, ey) are the offsets of the center of the element from the center of the array (in mm), (x, y, z) are the coordinates of the point at which the normalized pressure,  , is to be calculated. P opt and Q opt are optional input parameters discussed below.
 , is to be calculated. P opt and Q opt are optional input parameters discussed below.
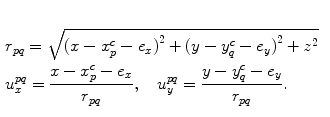
The form of Eq. (6.33) used in this function is still the same, but in this case Eqs. (6.34) and (6.35) are changed to include the offsets:
(6.37)
In implementing the criteria of Eq. (6.36) for determining the number of element segments in the function ps_3Dv the frequency, f, is assumed to be a scalar so that to synthesize the spectrum of a pulse with this function one must call the function for each frequency component in the spectrum. At high frequencies, these P and Q values may be prohibitively large so one must be careful to evaluate the fields only over the bandwidth of the transducer when implementing the function in this manner. The function, however, also has a pair of optional arguments, P opt, Q opt, that allows the user to specify the number of segments directly regardless of the frequency . When calling the function with these optional arguments, the frequency, f, can be vector. The choice P opt = 1, Q opt = 1 is the simple case of a single point source model, where the pressure is given by Eq. (6.27).
To show a fairly stringent test of the use of ps_3Dv, consider the case of a large single element where  ,
,  ,
,  ,
,  ,
,  ,
,  ,
,  , and P opt, Q opt are not specified. Figure 6.5 compares a plot of this case with the case where
  ,
,  which corresponds to choosing ten segments per wavelength in both dimensions to represent this element. It can be seen that there is no visible difference between the two cases even in the near field of the element.
 ,
,  ,
,  ,
,  ,
,  ,
,  ,
,  , and P opt, Q opt are not specified. Figure 6.5 compares a plot of this case with the case where
  ,
,  which corresponds to choosing ten segments per wavelength in both dimensions to represent this element. It can be seen that there is no visible difference between the two cases even in the near field of the element.
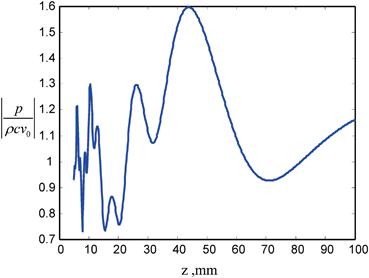
Fig. 6.5
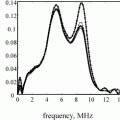
The on-axis pressure variation for a 6 × 12 mm rectangular element radiating into water (c = 1480 m/s) at 5 MHz. Solid line—one segment per wavelength (P opt and Q opt are not specified), dashed line—P opt = 203, Q opt = 406 (ten segments per wavelength in both directions). There is no discernible difference between the two cases
6.4 Contact Transducer Element Modeling
If an array is used in contact testing, the array element is in direct contact with a solid, with a thin layer of fluid couplant between the element and the solid . In this case, a more appropriate model for the boundary conditions is to assume that the element exerts a pressure distribution (usually assumed to be uniform) over the face of the element on an otherwise stress-free surface (Fig. 6.6). This pressure distribution generates a number of waves, including bulk P-waves and S-waves, Head waves, and Rayleigh surface waves [Schmerr]. At high frequencies the bulk P-waves, which are generally the waves used most often in contact inspections, can also be modeled in the form of a Rayleigh-Sommerfeld type of integral [Schmerr] where the velocity,  , in a solid due to a uniform pressure,
  over a surface area,
  , is given by
 , in a solid due to a uniform pressure,
  over a surface area,
  , is given by
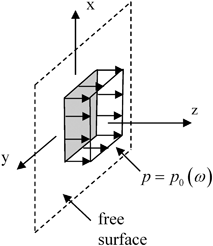
Fig. 6.6
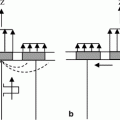
Model of an array element in contact with an elastic solid as a uniform pressure distribution on an otherwise stress-free surface

(6.38)
where  is a directivity function given by
 is a directivity function given by
(6.39)
Here  is an angle measured from the element normal, as shown in Fig. 6.7 and
 is an angle measured from the element normal, as shown in Fig. 6.7 and
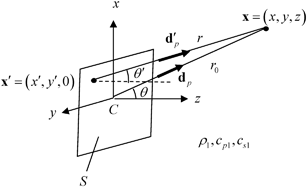
Fig. 6.7
Parameters for the modeling a contact element radiating into a solid

(6.40)
where  is the ratio of the compressional and shear wave speeds in the solid. The unit vector
  is the polarization vector along a ray from an arbitrary point
  on the element face to a point
  in the solid .
 is the ratio of the compressional and shear wave speeds in the solid. The unit vector
  is the polarization vector along a ray from an arbitrary point
  on the element face to a point
  in the solid .
In the far field of the element one can approximate the integrand in exactly the same manner as done for the fluid case so we will omit the intermediate steps and simply write the result for a rectangular element as:

(6.41)
where the angle  , the polarization
  , and the distance
  , are all measured relative to a ray from the centroid of the element to the point
  , as shown in Fig. 6.7. The directivity function
  is given by Eq. (6.28). Aside from the extra directivity function,
  , and the polarization vector,
  , Eq. (6.41


 , the polarization
  , and the distance
  , are all measured relative to a ray from the centroid of the element to the point
  , as shown in Fig. 6.7. The directivity function
  is given by Eq. (6.28). Aside from the extra directivity function,
  , and the polarization vector,
  , Eq. (6.41
Stay updated, free articles. Join our Telegram channel

Full access? Get Clinical Tree


