and Gustavo Marino2
(1)
Attending Physician VA Medical Center, George Washington University School of Medicine, Washington, DC, USA
(2)
Chief Gastroenterology Section VA Medical Center, Georgetown University School of Medicine, Washington, DC, USA
1.1 Cognitive Biases
1.1.2.1 Field Dependence
1.2.4 Reverberation Artifact
1.2.5 Partial Volume Artifact
1.3.1 Thyroid
1.3.2.2 Thoracic Duct
1.3.2.3 Azygos Vein
1.3.2.4 Mediastinal Lymph Nodes
1.3.3 Abdomen
1.3.3.1 Prostate
1.3.3.2 Seminal Vesicles
1.3.3.3 Vagina
1.3.3.4 The Uterus
1.4.1 Mediastinum
1.4.1.1 Azygos Vein
1.4.1.2 Dorsal Intercostal Arteries
1.4.2 Upper Abdomen
1.4.2.1 Hepatic Veins
1.4.2.2 Portal Vein
1.4.2.3 Splenic Vein and Splenic Artery
1.4.2.5 Celiac Artery Variants
1.4.2.6 Celiac Ganglia
1.4.3 Pelvis
1.5.1.1 ITSE/iMedline ()
1.5.1.2 PubMed Central ()
1.5.1.3 BioText ()
1.5.1.4 FigureSearch ()
1.5.1.5 Yale Image Finder ()
1.5.2.1 ARR GoldMiner® ()
1.5.2.2 Yottalook™
Abstract
The premise of this book is to make the reader better at endosonographic diagnosis. This process is iterative and never stops. The inside of the colon is at first amazing to the novice endoscopist but soon routine takes over. Indeed, the number of new features or diagnostic challenges the trainee will encounter trails off fast. Not so in endosonography. There is always something new to learn, and the more you know, the more you will see. This is a spiral staircase with the following repeating steps: concrete experience, observation and reflection, formation of abstract concepts, and testing in new situations [1]. In this introductory chapter we begin with a discussion of cognitive biases, which not only lead to wrong diagnoses but also impede learning. After a look at artifacts, we briefly review anatomic features that often are neglected and then make a pitch for the better use of Doppler studies. Some regional anatomy will be reviewed in subsequent organ-specific chapters. Furthermore, we review image retrieval web sites that are useful for decision support, lectures, and publications, and identify textbooks and journals of interest. Finally, we discuss the future of fine-needle aspiration (FNA) biopsy, the cornerstone of diagnostic endosonography.
The premise of this book is to make the reader better at endosonographic diagnosis. This process is iterative and never stops. The inside of the colon is at first amazing to the novice endoscopist but soon routine takes over. Indeed, the number of new features or diagnostic challenges the trainee will encounter trails off fast. Not so in endosonography. There is always something new to learn, and the more you know, the more you will see. This is a spiral staircase with the following repeating steps: concrete experience, observation and reflection, formation of abstract concepts, and testing in new situations [1]. In this introductory chapter we begin with a discussion of cognitive biases, which not only lead to wrong diagnoses but also impede learning. After a look at artifacts, we briefly review anatomic features that often are neglected and then make a pitch for the better use of Doppler studies. Some regional anatomy will be reviewed in subsequent organ-specific chapters. Furthermore, we review image retrieval web sites that are useful for decision support, lectures, and publications, and identify textbooks and journals of interest. Finally, we discuss the future of fine-needle aspiration (FNA) biopsy, the cornerstone of diagnostic endosonography.
Box 1.1: Open Access Resources
Endoscopic Ultrasound (an open access journal) http://www.eusjournal.com/ch/index.aspx
Basic Physics of Ultrasound Imaging, published by the World Health Organization, 2005 http://books.google.com/books?id=nHnTOfxsM9cC
Manual of Diagnostic Ultrasound, 2nd edition published by the World Health Organization, 2011 http://bit.ly/U4nJNR
Radiography Wiki: Mach Bands and Other Optical Illusions http://bit.ly/11hLJfO
RadioGraphics: Ultrasound Artifacts http://radiographics.rsna.org/content/29/4/1179.full
Yale Image Finder – general purpose scientific image retrieval http://krauthammerlab.med.yale.edu/imagefinder/
Yottalook – comprehensive radiology-centric search engine http://www.yottalook.com
1.1 Cognitive Biases
The role cognitive biases play in contributing to wrong diagnoses and medical error is increasingly being recognized [2]. Radiologists have pointed out where cognitive biases exist in radiologic reasoning [3]. Here is our subjective list of the top three selected from Croskerry [2]:
1.
Confirmation bias: the tendency to look for confirming evidence to support a diagnosis rather than disconfirming evidence to refute it, despite the latter often being more persuasive and definitive.
2.
Premature closure: a powerful cognitive disposition to respond, accounting for a high proportion of missed diagnoses. It is the tendency to apply premature closure to the decision-making process, accepting a diagnosis before it has been fully verified. The consequences of the bias are reflected in the maxim: “When the diagnosis is made, the thinking stops.”
3.
Search satisfying: reflects the universal tendency to call off a search once something is found. For example, comorbidities, second foreign bodies, other fractures, and co-ingestants in poisoning may all be missed. Also, if the search yields nothing, diagnosticians should satisfy themselves that they have been looking in the right place.
Fortunately, we are not entirely defenseless against these biases. We recommend these three cognitive defense strategies for endosonographers [2]:
1.
Cognitive forcing strategies: Develop generic and specific strategies to avoid predictable bias in particular clinical situations.
2.
Metacognition: Train for a reflective approach to problem solving, stepping back from the immediate problem to examine and reflect on the thinking process.
3.
Consider alternatives: Establish forced consideration of alternative possibilities, for example, the generation of and working through a differential diagnosis. Encourage routinely asking the question, What else might this be?
The following case illustrates some of these points.
1.1.1 Confirmation Bias and Framing in Imaging
This is a 66-year-old woman who was evaluated for a suspected gastrinoma 18 months before this presentation. An octreotide scan showed a questionable area of increased activity anterior to the right kidney. A computed tomography (CT) scan and an endoscopic ultrasound (EUS) were performed at the time and nothing was found. The patient’s gastrin levels continued to rise and a second octreotide scan was performed. The report stated that the “same region of mild increased activity is seen medial and anterior to the right kidney.”
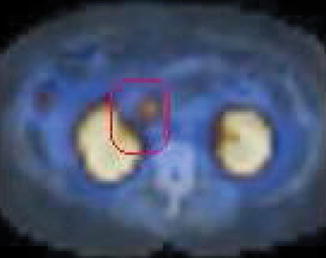
Fig. 1.1
This octreotide scan shows focally increased activity anterior and medial to the right kidney
A repeat CT scan (previously reported as negative) was read as showing a “questionable tiny focal area of soft tissue density at the medial aspect of the second portion of the duodenum which measures 1.4 cm and corresponds to the octreotide abnormality, suspicious for a small gastrinoma in the gastrinoma triangle.” The corresponding slice of the CT is shown here; the arrow inserted by the radiologist can be seen.
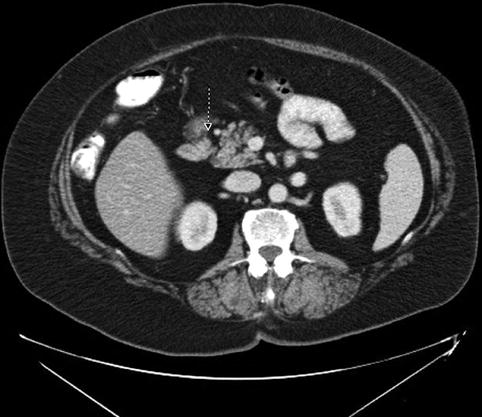
Fig. 1.2
The arrow (inserted by the radiologist) indicates the location of the postulated gastrinoma. Note how remote this area is from the right kidney. This is not where the gastrinoma was located. The reader of the computed tomography scan was eager to replicate the lesion seen on the octreotide scan (confirmation bias, framing)
The repeat EUS shows a lesion, which is considerably smaller (9.5 mm) and in a different location from what was seen on the CT scan. In fact, the lesion identified on the EUS is exactly medial and anterior to the right kidney (as would be expected based on the octreotide scan), whereas the lesion as postulated by the CT is more remote.
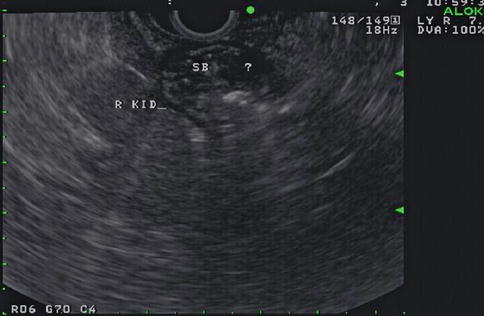
Fig. 1.3
This endoscopic ultrasound image shows a 9.5-mm-diameter hypoechoic nodule in the duodenal wall medial and anterior to the right kidney (indicated by ?)
In retrospect, a lesion corresponding to the EUS image could also be identified on the CT, anterior and medial to the right kidney and located in the bowel wall. It appears to be slightly enhancing, as is typical for islet cell tumors [4].
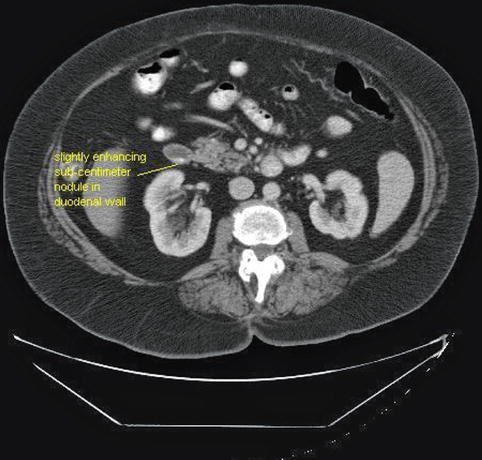
Fig. 1.4
The sub-centimeter nodule seen in the duodenal wall on the endoscopic ultrasound can also be identified (retrospectively) as a slightly enhancing duodenal wall lesion on this single-slice computed tomography (CT) scan (same CT as in Fig. 1.2). The location was confirmed during surgery
Confirmation bias, or the willingness to identify abnormalities that are expected to be present but are really not, at least not where suspected, is a trap everybody can fall into. There is a blurry line between looking so hard that one starts seeing things and not looking hard enough. The next section will examine this trade-off in more detail.
1.1.2 Image Perception Research and Field-Dependence Bias
Image perception research deals with the processes of perception and recognition of information in medical images. It is estimated that there is about a 20–30 % miss rate (false negatives) in radiology, with a 2–15 % rate of false positives [5]. Whether these numbers are really so high could be debated; let us agree, however, that they are not insignificant. Using eye position recording techniques, it has been found that false negatives can be classified into three categories based on how long they are fixated or dwelled on (visual dwell patterns) [5, 6].
Search errors: Some lesions are missed because they are never looked at with high-resolution foveal vision.
Recognition errors: Some lesions are looked at, but not long enough to detect or recognize any suspicious features.
Decision errors: These lesions are looked at for long periods of time (often as long as lesions that are looked at and reported) but are still missed.
Decision error can be illustrated by the following case and conceptualized by the cognitive theory of field dependence. A field-dependent person has difficulty finding a geometric shape that is embedded or “hidden” in a background with similar (but not identical) lines and shapes. The conflicting patterns distract the person from identifying the given figure. A person who is field-independent can readily identify the geometric shape, regardless of the background in which it is set [7]. However, identifying hidden figures has a flip side: subjective contour formation. Subjective contour formation is a psychophysiological phenomenon in which complete “structures” are falsely constructed from minimal outlines [8].
The EUS image recognition process relies heavily on patterns that correlate with abnormalities. Lack of awareness of additional patterns or finding atypical changes may confuse the endosonographer, who could either ignore the finding or make incorrect conclusions. In these cases an open mind and awareness of unknown possibilities should be recognized. Video-recording of these findings may be useful for additional review with radiologists or other endosonographers.
1.1.2.1 Field Dependence
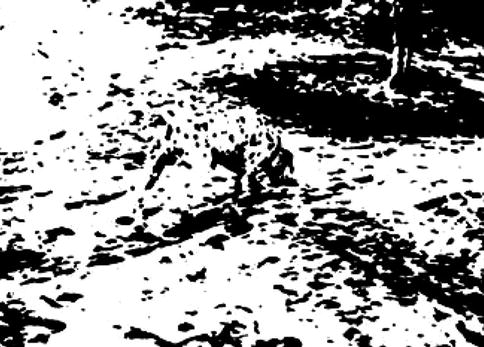
Fig. 1.5
An illustration of field independence with the hidden picture test. The concealed abject is revealed at the end of this chapter
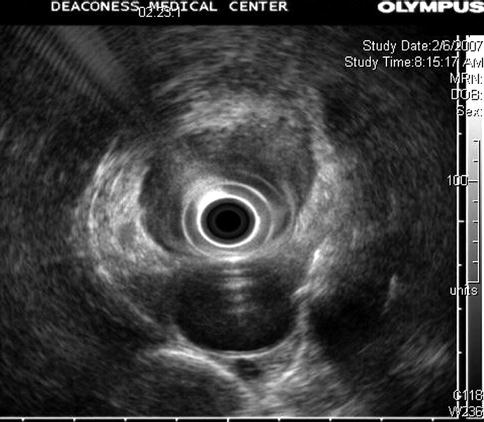
Fig. 1.6
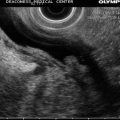
Look closely at this image. We are in the esophagus. The aorta is at 6 o’clock. There is an almost circumferential hypoechoic mass. What is hidden?
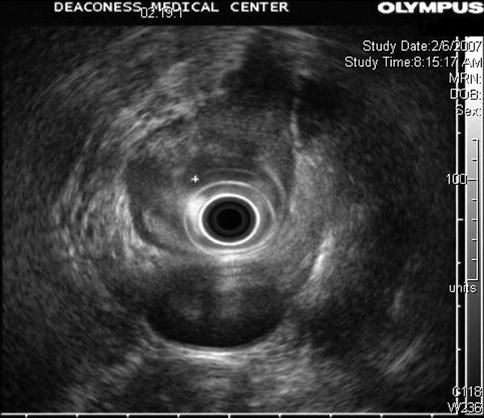
Fig. 1.7
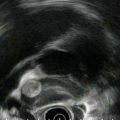
Another view of the mass in the esophagus. Can you see it now?
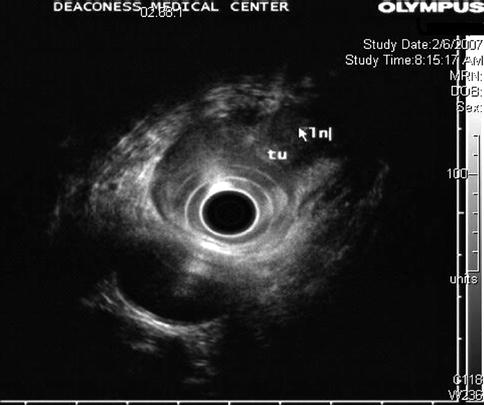
Fig. 1.8
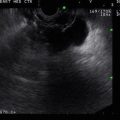
The higher frequency clearly shows a periesophageal lymph node that at a lower frequency almost completely blended in with the tumor mass. tu tumor, ln lymph node
This case also illustrates that endoscopic ultrasound is more than an imaging technique – it is an “interrogation” technique. When suspicion is raised the endosonographer can vary transducer position, insonation angle, tissue adaptation, frequency, and other specifications to tease out more information.
1.2 Dealing with Artifacts
In the context of ultrasound or imaging, an artifact is any perceived distortion, error, or addition caused by the processor and display. Artifacts can be recognized as such and then either exploited or ignored. If artifacts are not recognized but taken as “anatomic reality,” diagnostic errors and procedural complications may be the consequences.
According to Kremkau and Taylor [9] there are four generic categories of ultrasound imaging artifacts:
1.
Acoustic: error in the presentation of ultrasound information;
2.
Anatomic: error in interpretation (often called a “pitfall” error);
3.
Optical illusion: error in perception; and
4.
Other: electrical noise.
This classification system mixes the technical with the cognitive and predates some of the recent interest in cognitive biases (see the earlier discussion about cognitive bias) but remains useful as long as endosonographers are aware of where the distortion occurs (before or after cortical processing).
Some of the common artifacts that occur during EUS or CT are demonstrated by the cases that follow. Obviously, artifacts also are seen with other imaging modalities. However, CT artifacts are very different from ultrasound artifacts, and this can be exploited, as Sect. 1.2.2 demonstrates.
1.2.1 The Importance of Contrast Resolution in EUS
There are three domains of image resolution: temporal, detail (axial and lateral), and contrast. Detail resolution is largely determined by image frequency and beam width. Contrast resolution, on the other hand, is generally determined by pre- and postprocessing of images [10]. Postprocessing curves can be selected on the ultrasound processor and sometimes need to be adjusted to enhance small differences in echo intensity. Some endosonographers never change their postprocessing assignments. For beginners, staying with the scheme can lead to quicker familiarization with the strange world of sonography. However, the next case illustrates how not using postprocessing curve adjustments can lead to problems.
A 50-year-old man with a history of alcohol problems but no drinking for 6 years was admitted to the hospital with acute pancreatitis. He later developed jaundice. Endoscopic retrograde cholangiopancreatography (ERCP) showed a smoothly compressed bile duct. A stent was placed. CT and magnetic resonance imaging (MRI) were negative for a mass lesion. The CA 19-9 was initially elevated but this was thought to be due to the biliary obstruction and acute pancreatitis. EUS was performed; no mass was seen. Features of mild chronic pancreatitis, especially in the body and tail, were present. Three days after the first EUS the patient’s repeat CA 19-9 levels came back: they had quintupled. He was brought back for a second look. Linear EUS showed the tumor and biopsies were positive for adenocarcinoma. The linear electronically switched instrument is widely believed to have an intrinsically better contrast resolution than the mechanical radial instrument, but different postprocessing settings may have revealed the tumor on the first exam.
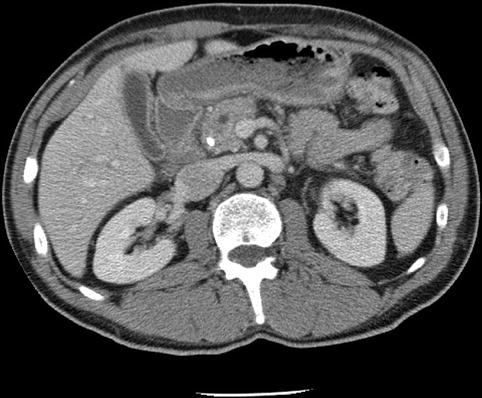
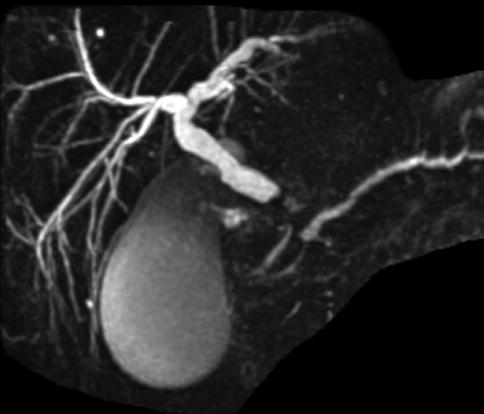
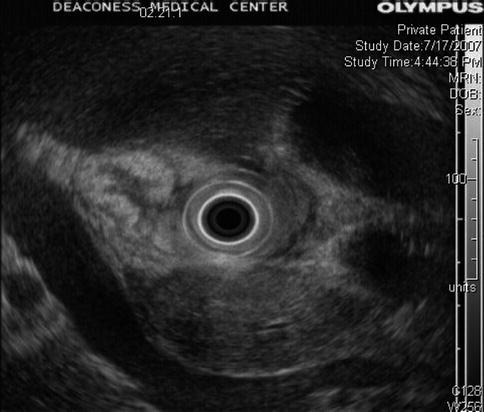

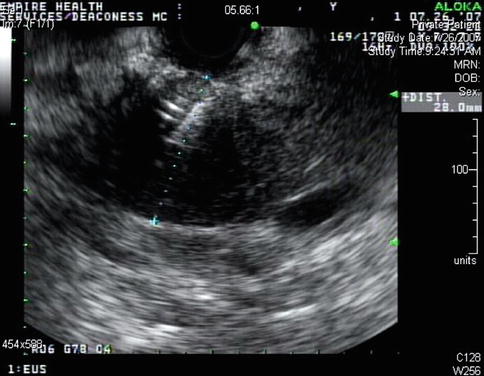
Fig. 1.9
This computed tomography scan shows a pancreatic head with biliary stent in place. A mass is not apparent
Fig. 1.10
This magnetic resonance cholangiopancreatography shows a bile duct stricture. On ERCP the stricture was described as smooth
Fig. 1.11
This radial endoscopic ultrasound image shows a homogenous-appearing head of the pancreas. A mass was not appreciated at the time, but it can be seen in retrospect
Fig. 1.12
A week later endoscopic ultrasound was performed a second time. A linear array electronically switched instrument was employed. A mass is now apparent
Fig. 1.13
Fine-needle aspiration biopsies of the mass showed adenocarcinoma. The needle is shown, and the bile duct stent is also visible
1.2.2 Streak Artifacts on CT Obscuring Important Pathology Discovered by EUS
This is a 73-year-old patient with generally declining health who was admitted to the hospital with a diagnosis of cholecystitis. He was considered to have poor operative risk and instead of a cholecystectomy a cholecystomy was performed. The CT scan of the abdomen showed small pancreatic cysts, and EUS evaluation was requested. The EUS showed small simple-appearing cysts, which were ignored in view of the finding of a 6-cm-diameter periesophageal lymph node mass. Biopsies revealed Hodgkin’s lymphoma.
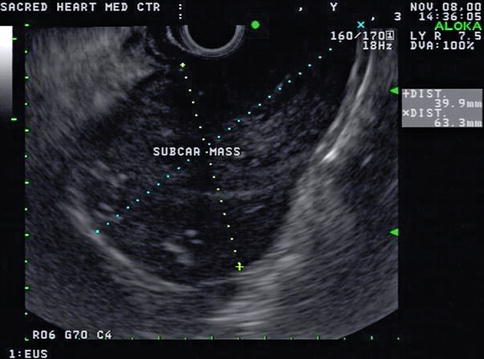
Fig. 1.14
The pancreas exam showed small simple-appearing cysts, but a screening exam of the mediastinum with linear endoscopic ultrasound unexpectedly showed a 6-cm large mass adjacent to the lower esophagus
Prompted by the EUS findings, a CT scan of the chest was ordered. This CT was read as showing a 2.5-cm lymph node in the azygoesophageal recess. Interestingly, the 6-cm lymph node mass was not picked up by the reading radiologist, presumably in part because streak artifacts on the CT scan further deteriorated image quality in the region of interest.
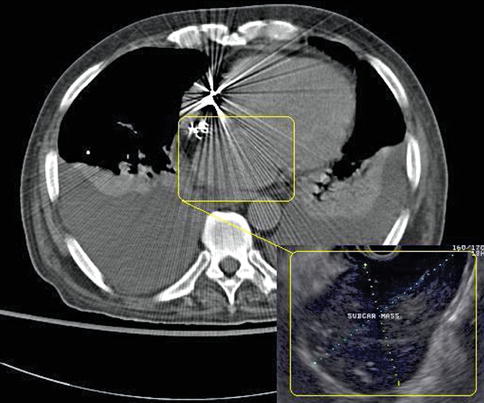
Fig. 1.15
An overlay of the endoscopic ultrasound (EUS) image on the computed tomography (CT) scan illustrates the two strikingly different appearances of the same mass, which was not recognized/reported on CT but is obvious on EUS
This case illustrates two things. First, EUS is an imaging modality that looks at the same anatomy based on a reflection-based algorithm, whereas CT evaluates tissue based on its transmission characteristics. Therefore, the same pathology can be obvious on EUS and close to invisible on CT or vice versa. Second, radiologists and endosonographers need to communicate better.
1.2.3 The Limitations of CT Measurements (Hounsfield Units)
Hounsfield units are a quantitative measurement of radiodensity on CT scans. Low Hounsfield units in the pancreas say little more than that the lesion is hypodense; it does not reliably distinguish between a hypodense solid tumor mass or a cyst, as this case demonstrates. Both lesions in this patient’s pancreas were thought to be cysts on CT on the basis of overall impression and density measurements. EUS shows that the lesion in the head is indeed a cyst, whereas the pancreatic tail lesion is adenocarcinoma, as proven by a biopsy.
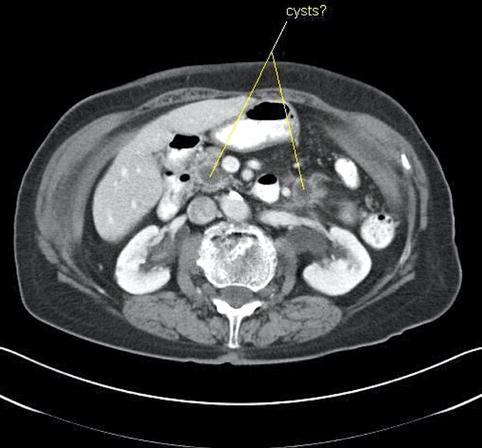
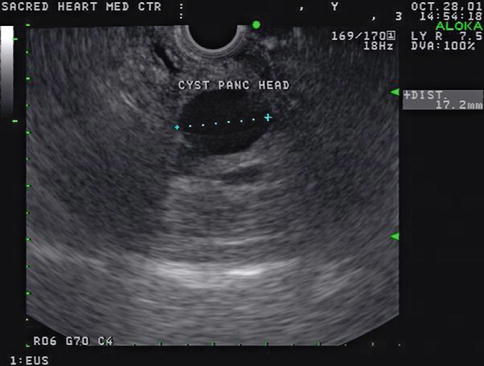
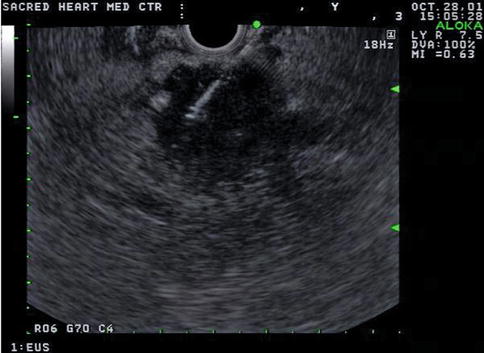
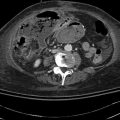
Fig. 1.16
This computed tomography scan shows hypodense lesions in the head and tail of the pancreas. Both were thought to be cysts
Fig. 1.17
The endoscopic ultrasound image shows that the lesion in the head of the pancreas is indeed an anechoic cyst with posterior enhancement (increased transmission), but the tail lesion is solid
Fig. 1.18
In the tail region of the pancreas, the “cyst” seen on computed tomography is actually solid. Fine-needle aspiration biopsies revealed adenocarcinoma
1.2.4 Reverberation Artifact
Reverberation artifact in ultrasound imaging is caused by the multiple reflections of ultrasound back and forth between two closely spaced interfaces. It is commonly seen in the human body when air is trapped between tissue planes, which conduct sound well (soft tissue-to-gas interfaces). It occurs even more frequently in endosonography when the balloon around the ultrasound transducer is only partially filled with water and contains air bubbles. On the basis of its appearance, the artifact is also referred to as “ring-down artifact” and “comet tail artifact.”.
This is a patient with a cholangiocarcinoma. The patient had an ERCP with placement of a stent across his common bile duct stricture 4 days before this EUS. During the EUS the gallbladder initially appeared normal; however, eventually enough air was blown from the duodenum via the stent into the gallbladder to cause the reverberation artifact shown. Chapter 2, Esophagus and Mediastinum, shows how this artifact can help detect air-filled bronchi in a consolidated lung.
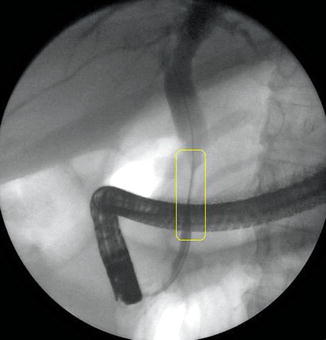
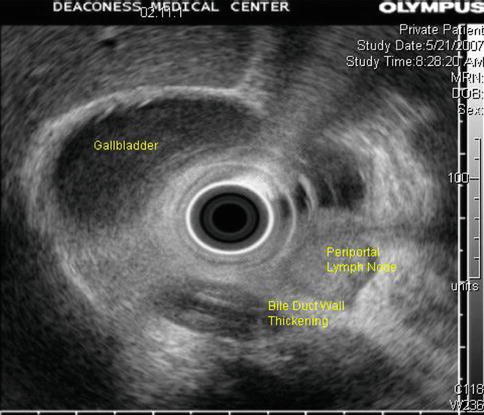
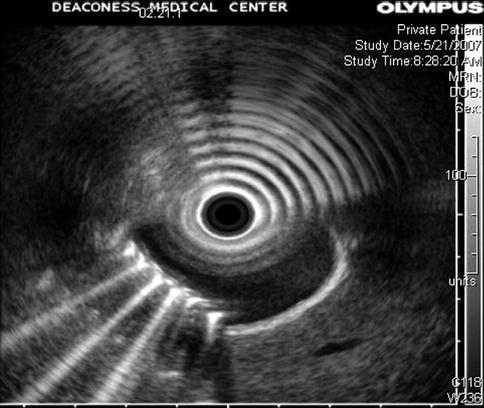
Fig. 1.19
This ERCP shows a stricture of the extrapancreatic bile duct caused by a cholangiocarcinoma
Fig. 1.20
The corresponding endoscopic ultrasound image shows marked thickening of the common bile duct wall surrounding a plastic stent. Note the enlarged periportal lymph node suspicious for nodal metastasis
Fig. 1.21
This is a classic example of reverberation artifact. It is caused by air in the gallbladder (comet tail artifact) in the bottom half of the image and by air in a partially filled balloon around the transducer (ring-down artifact) in the top half of the image
1.2.5 Partial Volume Artifact
This is a 62-year-old man with a carcinoid of the terminal ileum metastatic to the liver. He is now being considered for debulking surgery. The CT scan showed a possible area where it seemed as if the large centrally located metastasis was invading into the portal vein. EUS evaluation was requested and did not show any such invasion. This study also illustrates the usefulness of the vascular Doppler capability of solid-state EUS scanners.
Partial volume artifacts occur with CT and MRI when a structure is only partly contained within the imaging section, voxel, or pixel. The effect is most marked in regions where two tissues with different signal intensities adjoin, such as in this case (the tumor and portal vein). In one plane this may lead to blurring, but examination of the image in another plane will often show clearly defined borders [11]. EUS is an imaging technique that creates its own artifacts (albeit of a different nature); however, when the operator suspects an artifact, the imaging plane can be adjusted and the question often resolved.
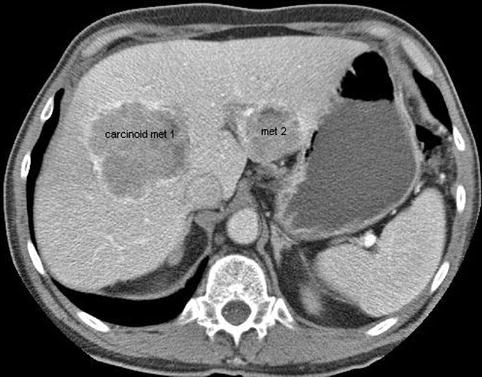
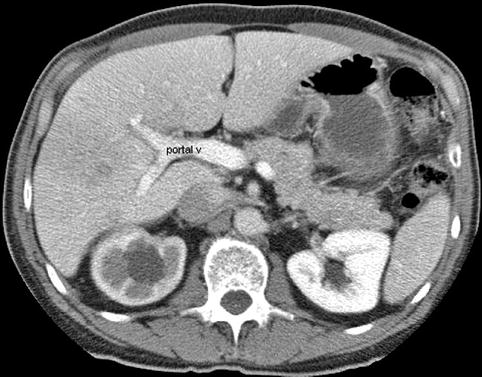
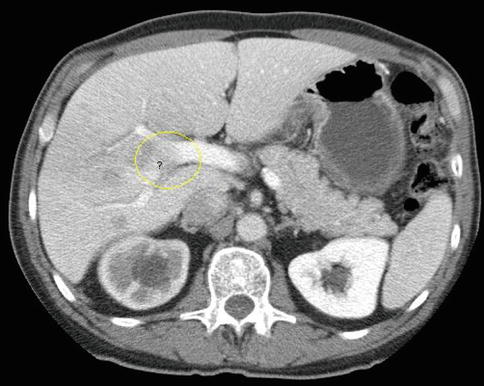
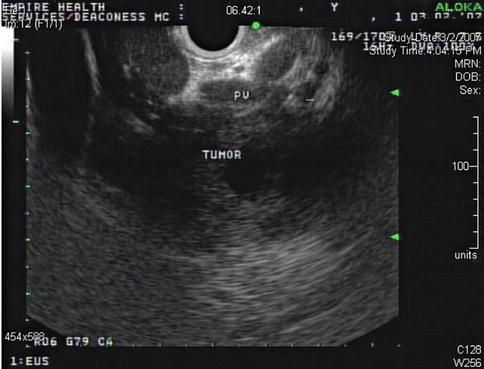
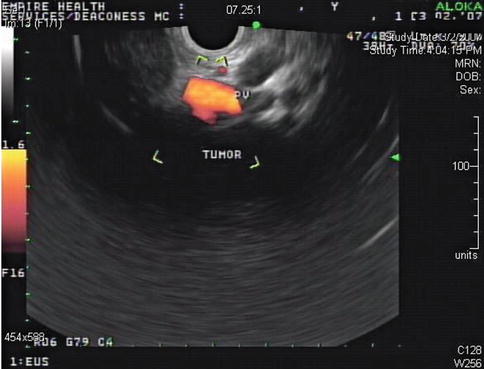
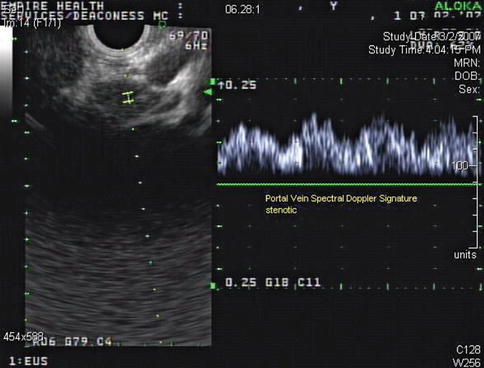
Fig. 1.22
This is a full view of the two large carcinoid metastases in the liver
Fig. 1.23
This computed tomography scan inferior to the central metastasis shows a portal vein (v) and branches that appear intact
Fig. 1.24
This slice is concerning for portal vein invasion (yellow circle); however, volume averaging is another possible explanation
Fig. 1.25
This endoscopic ultrasound image as part of a comprehensive interrogation of the area shows a portal vein (PV) branch compressed by tumor but no invasion
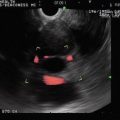
Fig. 1.26
The same area as seen in Fig 1.25 with a power Doppler signal in the portal vein (PV) branch
Fig. 1.27
The third image of the series of three shows that the vessel in question indeed belongs to the portal venous system and exhibits a characteristic spectral Doppler signature. No tumor invasion was seen at this level or elsewhere
1.3 Anatomic Landmarks
The following cases aim to illustrate important points without being a comprehensive review of anatomy relevant to EUS. Emphasis is placed on practical pointers and structures that endosonographers see but are not typically asked to evaluate, for example, the uterus, thyroid, and prostate.
1.3.1 Thyroid
This is a 60-year-old woman who had a plethora of complaints and was referred for EUS for the evaluation of a cyst in the pancreatic tail. Upon withdrawal of the echoendoscope through the cervical esophagus a large thyroid was incidentally noted. An evaluation of thyroid-stimulating hormone levels was ordered and came back as <0.01 uIU/ml, consistent with hyperthyroidism, in this case most likely Graves’ disease. There is at least one case report where EUS was used to biopsy thyroid nodules [12], but it is unlikely that there is a role for EUS in the biopsy of thyroid masses. Percutaneous biopsies are well established, do not require sedation, and allow a view of the large portions of the thyroid, which are invisible (blocked by the trachea) to the endosonographer. Although not often tasked to evaluate the thyroid, endosonographers should be able to recognize obvious pathology. On ultrasound, thyroid tissue has a uniform solid pattern consisting of dense agglomerates of fine echoes of equal size. Compared to adjacent muscle the normal thyroid is hyperechoic. A hypoechoic appearance of the thyroid is most often due to an inflammatory process. Anteroposterior diameters of 2.0 cm or more are suspicious for pathology, and diameters exceeding 2.5 cm are clearly abnormal [13].

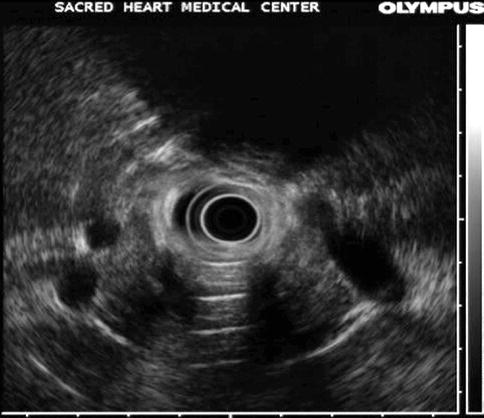
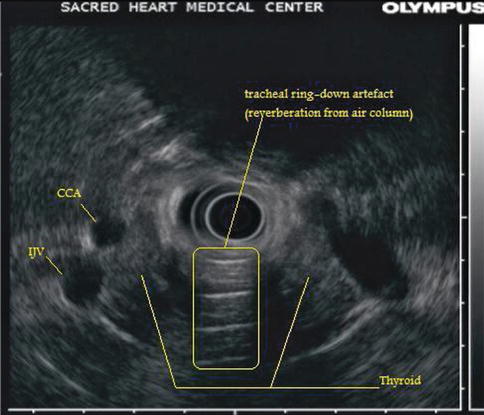
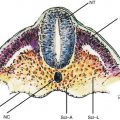
Fig. 1.28
This cross-sectional image shows the trachea, esophagus, and thyroid in relation. The transverse section at the level of C6 shows the relevant anatomy of the thyroid. 1 Cervical lymph node, 2 internal jugular vein, 3 vagus nerve, 4 common carotid artery, 5 recurrent laryngeal nerve, 6 esophagus, 7 longus colli, 8 scalenus anterior, 9 omohyoid, 10 sternocleidomastoid, 11 sternohyoid, 12 sternothyroid, 13 trachea, 14 pretracheal fascia, 15 thyroid gland, 16 carotid sheath (From Yuen et al. [14])
Fig. 1.29
This unlabeled endoscopic ultrasound image shows a large hypoechoic thyroid insinuating itself between the common carotid artery and internal jugular vein
Fig. 1.30
This is a labeled version of the radial endoscopic ultrasound image in Fig. 1.29. The shadow on the top half of the image is caused by the vertebral body. CCA common carotid artery, IJV internal jugular vein
1.3.2 Esophagus and Mediastinum
Esophageal and mediastinal anatomy are best learned together. In fact, they are inseparable. This point is emphasized in Chap. 2, where the readers are directed to further resources. The following case illustrates that sometimes “ad hoc” landmarks need to be used to make sense of imaging findings, and this often involves the integration of several different imaging studies with EUS.
This is a 73-year-old man with a newly diagnosed left upper lobe lung nodule. Unfortunately, transthoracic biopsies revealed adenocarcinoma. The positron emission tomography–CT scan shows this nodule; it also shows another hot spot suspicious for a metastatic mediastinal lymph node on the contralateral side. This would make the patient unresectable.
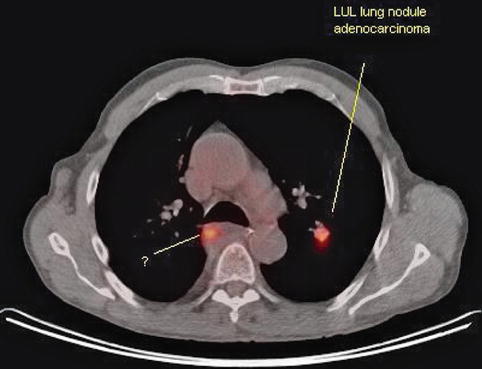
Fig. 1.31
On this positron emission tomography–computed tomography scan two hot spots (in red) are seen. Is this an unresectable lung cancer because there is contralateral activity? LUL, left upper lobe
The patient also has a history of a resected esophageal cancer some 12 years earlier. EUS-guided biopsies of the suspected mediastinal lymph node were requested.
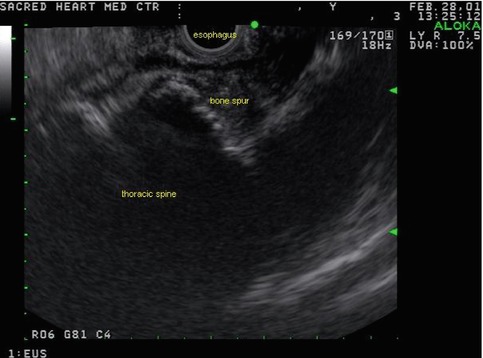
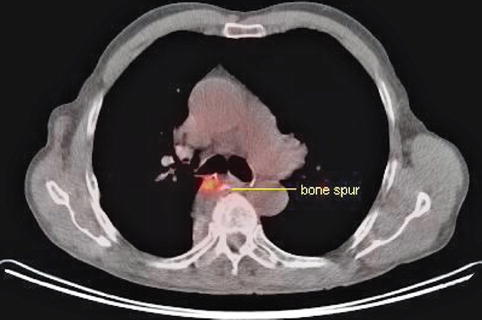
Fig. 1.32
Ultrasound reveals the presence of an esophageal impression caused by a bone spur just opposite an esophageal ulcer
Fig. 1.33
The same PET–CT view seen in Fig. 1.31 but a cut slightly caudad to it. The left-sided lung activity is no longer visible but another abnormality has come into view: a calcified outcropping from the thoracic spine opposite the area of activity
A bony spur identified on EUS as causing an esophageal impression was helpful in establishing the nature of the hot spot seen on positron emission tomography.
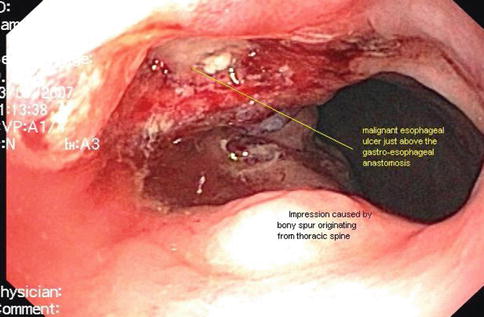
Fig. 1.34
The esophageal ulcer is opposite the bone spur on endoscopy and the bone spur is opposite the hot spot on positron emission tomography–computed tomography. The malignant esophageal ulcer causes the hot spot
1.3.2.1 Mediastinal Anatomy Is Not Set in Stone
The esophagus is not a pipe but has considerable lateral and dorsal-ventral mobility, even during normal respiration [15]. In the distal esophagus excursions of up to 9 mm were recorded during quiet respiration. More important, passive stretching of the balloon of the esophagus up to several centimeters is easily accommodated; see, for example, Larsen et al. [16]. Gentle pushing with a flexible endoscope makes remarkable excursions from the baseline possible. To our knowledge, measurements are not available, but several centimeters laterally, especially in the distal esophagus, seem probable.
The practical point is that transesophageal EUS-guided biopsies of lung masses or lymph nodes are often feasible even if it does not seem so on a CT scan. This is a 76-year-old patient who had an unsuccessful attempted bronchoscopy and was referred to us by his medical oncologist. Despite the fact that the tumor does not appear to be accessible from the esophagus, the tumor could be visualized and biopsies were easy; diagnostic material (large-cell carcinoma) was obtained.
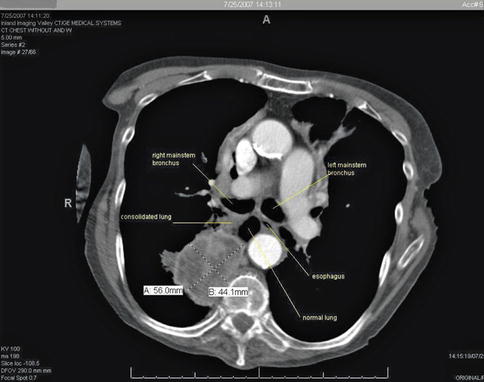
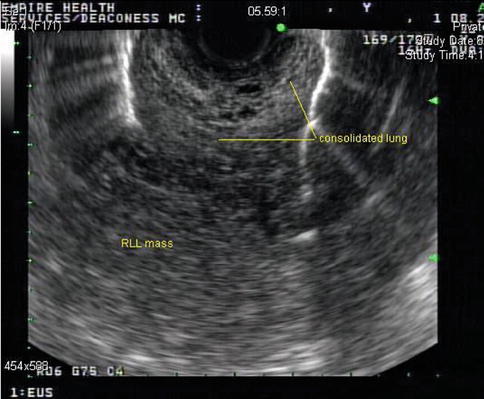
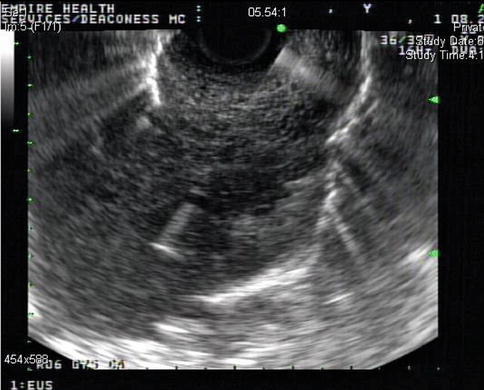
Fig. 1.35
On the basis of this computed tomography scan it does not appear that the large right lower lobe lung mass can be biopsied from the esophagus. However, the esophagus is not a rigid pipe. Instead, it accommodates gentle sideward pushing with the tip of the endoscope
Fig. 1.36
This endoscopic ultrasound image shows the consolidated portion of the lung and the mass posterior to it. RLL, right lower lobe
Fig. 1.37
Endoscopic ultrasound–guided fine-needle aspiration of this right lower lobe lung mass was easy and diagnostic. Note that the needle traverses the consolidated portion of the lung before it reaches the tumor mass
1.3.2.2 Thoracic Duct
In mammals, lymph vessels draining the abdominal viscera and lower half of the body converge just below the diaphragm to form the thoracic duct, a single major channel that ascends through the chest and enters the venous system on the left side of the neck. Although it is known that the lymphatic system collects plasma protein, absorbed lipid, and immunologically active cells and protein, the physiological advantage of transporting these substances from below the diaphragm through the chest to the neck is obscure [17]. Surgical ligature of the duct at any point in its course is harmless and is a means of controlling thoracic duct leaks, which can lead to chylothorax. The thoracic duct is readily identifiable on EUS [18]. It is larger than normal in patients with cirrhosis of the liver.
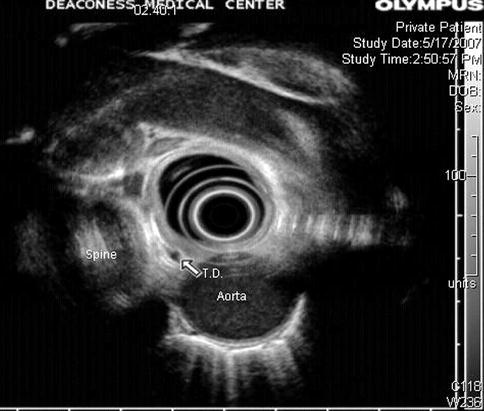
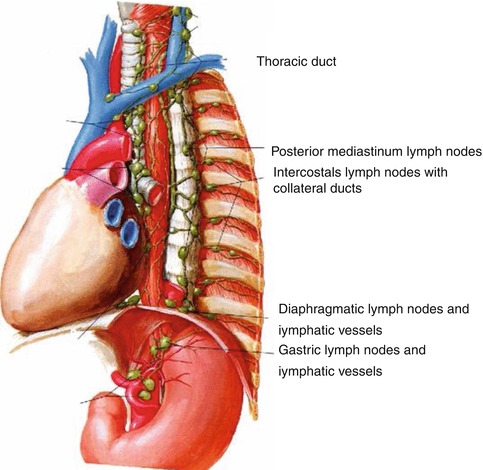
Fig. 1.39
The thoracic duct seen on endoscopic ultrasound. It is a small vessel measuring only a few millimeters in cross section and is anterior to the spine, relatively close to the aorta. In contrast, the azygos vein is much larger and located somewhat to the right from the center of the spine
1.3.2.3 Azygos Vein
The azygos vein is formed by the union of the ascending lumbar veins with the right subcostal veins at the level of the 12th thoracic vertebra, although it may be formed by a branch of the right renal vein or from the inferior vena cava (IVC). It ascends in the posterior mediastinum and arches over the root of the right lung to join the superior vena cava.
In the thorax the azygos lies on the right side of the aorta and thoracic duct and is partly covered by pleura. The azygos vein is easy to identify with radial EUS. In cirrhosis the azygos vein and thoracic duct are dilated, and in addition to esophageal or gastric varices, EUS often demonstrates thickening of the gastric mucosa and submucosa [20].
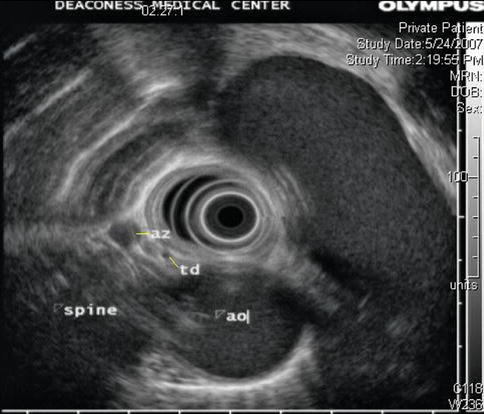
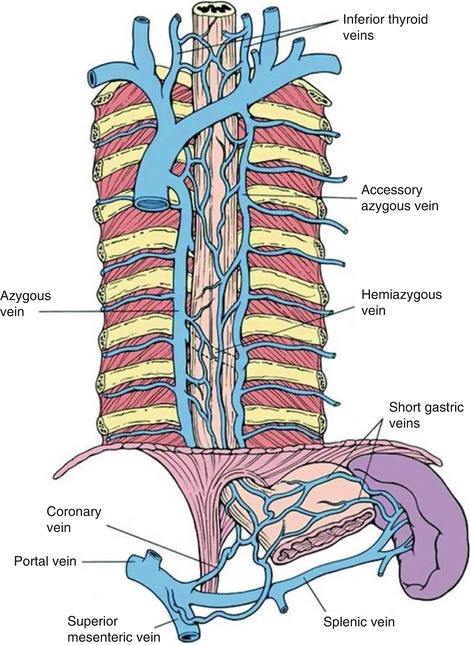
Fig. 1.41
This radial endoscopic ultrasound image shows the thoracic duct (td) and azygos vein (av). ao aorta
1.3.2.4 Mediastinal Lymph Nodes
In 2009 a new lung cancer lymph node map was proposed by the International Association for the Study of Lung Cancer to reconcile the differences between the Naruke and the MD-ATS maps and refine the definitions of the anatomic boundaries of each of the lymph node stations [22].
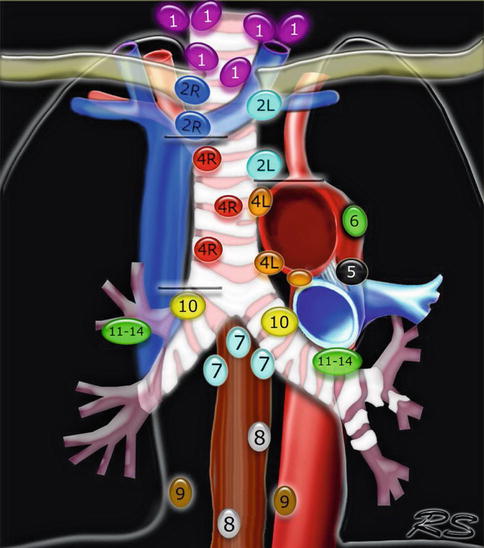
Fig. 1.42
This Mediastinal Lymph Node Map (IASLC 2009) is an excellent up-to date tool for mediastinal lymph node stations according to the International Association for the Study of Lung Cancer 2009 nomenclature. Available at: www.radiologyassistant.nl/en/p4646f1278c26f
1.3.3 Abdomen
Anatomic landmarks in the upper abdomen are reviewed in the respective organ-specific chapters. Here we review pelvic structures that are not normally the focus of the gastrointestinal endosonographer.
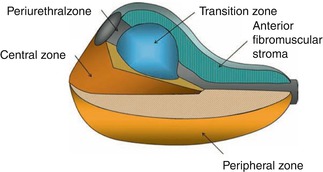
1.3.3.1 Prostate
Gastroenterologists or colorectal surgeons performing endorectal or transrectal ultrasound need to have a degree of familiarity with the zonal anatomy of the prostate and the likely appearance of prostate cancers on rectal ultrasound even if they cannot be expected to be experts in transrectal ultrasound of the prostate, which is used primarily to direct the biopsy needle to the desired anatomic locations to estimate the volume of the prostate and assist in sampling prostate tissue in a spatially systematic way. However, it is unreliable in differentiating normal prostate tissue from cancerous tissue [23].
The prostate is organized in zones (Fig. 1.43). The peripheral zone forms the posteroinferior aspect of the gland and represents 70 % of the prostatic volume. It is the zone where the majority (60–70 %) of prostate cancers are found.
Most cancers of the prostate are either isoechoic or hypoechoic to the surrounding parenchyma in the outer portion of the gland. Those that are more hypoechoic or more easily visualized tend to have a higher Gleason grade [24]. Prostate cancer is frequently invisible on grayscale ultrasound; this is the rationale for sextant biopsies when prostate cancer is suspected for other reasons. The nonurologist doing transrectal ultrasound should, however, be concerned when a hypoechoic area in the peripheral zone is seen and must refer the patient appropriately.