Introduction
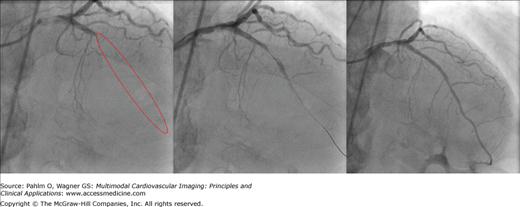
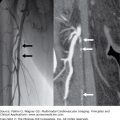
When a patient is presented at the emergency department or to a mobile emergency system with acute chest pain, the first assessment includes a standard 12-lead electrocardiogram (ECG). When chest pain is caused by an acute coronary occlusion, the initial ECG can show ST-segment elevation, which meets the criteria that indicate an ST-segment elevation myocardial infarction (STEMI). All five patients included in this chapter presented with first-time STEMI due to an occluded left anterior descending coronary artery as documented by emergency coronary angiography (Fig. 21–1).
Figure 21–1.
Angiography. Coronary angiogram during percutaneous coronary intervention of patient 4 are shown. The left panel shows an occlusion within the left anterior descending coronary artery (LAD). The red ellipse shows the actual location of the LAD. The middle panel shows the coronary artery with the transducer placed in the LAD. The right panel shows the LAD after percutaneous coronary intervention resulting in TIMI (thrombolysis in myocardial infarction) 3 flow.
The ECG is the initial modality used in the evaluation of patients with suspected acute myocardial infarction. It provides general information about presence and location of the acute ischemia/infarction process. Several ECG scoring systems are being used for assessment of the extent of the initially ischemic myocardium and also the extent of the final infarction. There are, however, limitations in using the ECG as a modality for sizing either the ischemic or infarcted region. In its current form, the ECG does not provide an image of the electrical activation or recovery. New methods are currently in development to transform the ECG waveforms into cardiac images, with algorithms to quantify key aspects of the ischemia/infarction process such as extent, acuteness, and severity.1-3
The five patients included in this chapter represent the varied outcomes that can result from acute percutaneous coronary intervention (PCI) that is intended to provide maximal salvage of ischemic myocardium. The ECG was used to assess the Anderson-Wilkins Acuteness Score and the Sclarovsky-Birnbaum Severity Ischemia Grade on the initial ECG to indicate the patient’s potential for recovery of the involved region of myocardium.4,5 Cardiovascular magnetic resonance (CMR) imaging was performed on all patients. Two patients received myocardial perfusion single photon emission computed tomography (SPECT) with the radioactive tracer injected prior to opening of the occluded vessel, and the other three patients received SPECT imaging with injection of the radioactive tracer only after the occluded vessel was opened. Positron emission tomography (PET) was performed on these three patients.
Electrocardiogram
The ECG Anderson-Wilkins Acuteness Score indicates the acuteness of an episode of acute myocardial infarction on a continuous scale from 4.0 to 1.0; 4.0 represents a hyperacute process, while 1.0 indicates a late, subacute process. The score is based on the comparative T wave amplitudes versus abnormal Q wave durations in each of the leads with ST-segment elevation or tall T waves. The acuteness phase is designated for each of these leads based on the presence (A) or absence (B) of a tall T wave and the absence (1) or presence (2) of an abnormal Q wave, with 1A being the most acute (tall T waves without abnormal Q waves) and 2B being the least acute (positive but not tall T waves with abnormal Q waves).4
The Anderson-Wilkins Acuteness Score is then calculated from the following formula:
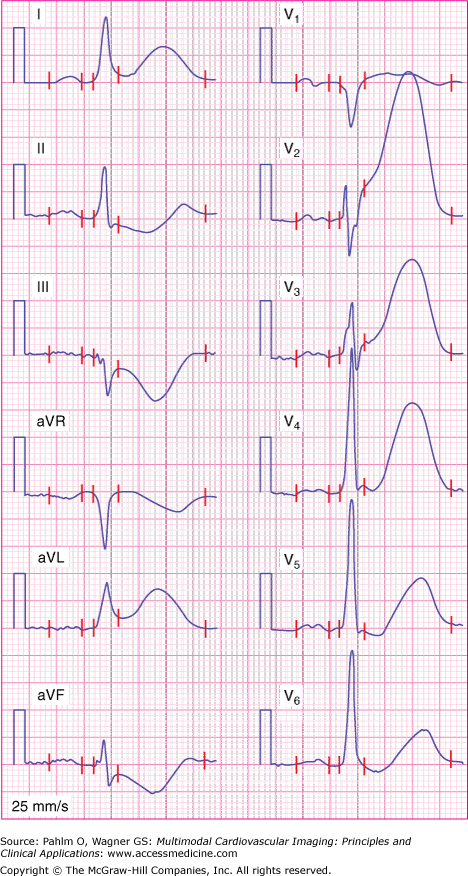
In Fig. 21–2, representing the example ECG of patient 1, an ST-segment elevation or tall T wave can be seen in leads I and aVL and in leads V1 to V6. All leads except V1 show a tall T wave and no abnormal Q wave. Lead V1 has a Q wave but no tall T wave. The final Anderson-Wilkins Acuteness Score is 3.6, indicating the presence of a highly acute myocardial infarction.
Figure 21–2.
Initial electrocardiogram for patient 1 showing ST-segment elevation in leads I, aVL, and V1 to V3. In addition, tall T waves can be seen in leads I, aVL, and V2 to V6. The red vertical lines represent from left to right: P wave onset, P wave offset, QRS onset, QRS offset, and T wave offset.
The Sclarovsky-Birnbaum Ischemia grading system is based on assessment of changes in the T wave, ST segment, and terminal part of the QRS complex, as a method for estimating the severity of ischemia as influenced by protection by either collateral vessels or metabolic preconditioning.5 The grading system consists of three grades representing increasing severity: grade I—tall upright T waves without ST-segment elevation; grade II—ST-segment elevation in at least two adjacent leads without terminal QRS distortion; and grade III—ST-segment elevation with terminal QRS distortion in two or more adjacent leads. Figure 21–2 shows an example of grade II ischemia when assessed by the grading system.
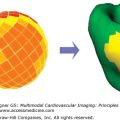
The clinical management of patients with acute coronary occlusion involves a complex assessment of the extent and severity of changes of both ischemia and infarction within the left ventricle. Often, the assessed methods are presented in different formats, and within each method, the orientation of the heart, angle selection for cardiac planes, nomenclature for segments, and assignment of segments to coronary arterial territories have evolved independently. This evolution has been based on the inherent strengths and weaknesses of the technique and the practical clinical application of these modalities as they are used for patient management. This independent evolution has resulted in a lack of standardization and has made accurate intra- and cross-modality comparisons difficult. A uniform method for display that allows for side-by-side comparison would therefore simplify data interpretation. Cerquiera et al6 proposed a 17-segment standardized polar plot representation for the left ventricle, where the outer boundaries of the polar plot represent the base of the left ventricle and where the center of the polar plot represents the apex of the left ventricle. The 17-segment model facilitates multimodal imaging approaches.
Cain et al7 used the polar plot representation for comparing myocardial perfusion SPECT, regional function by CMR, and viability by CMR. More recently, Ubachs et al3 and Bacharova et al1 developed ECG methods to visualize the ST-segment deviation on a polar plot representation (see Chapters 7 and 11). Ubachs et al3 used the presence of ST-segment elevation on the standard 12-lead ECG to locate the ischemic myocardium based on the infarct distribution method described by Strauss and Selvester.8 Bacharova et al1 used the dipolar electrocardiotopography (DECARTO) method, where the center of the location is provided by the spatial orientation of the resultant ST vector.
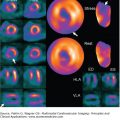
Myocardial Perfusion SPECT
Perfusion defect size by myocardial perfusion SPECT has been shown to correlate well with ex vivo measures of myocardial ischemia when the perfusion tracer is injected prior to PCI.9 Its evolution and use over the last decades has made myocardial perfusion SPECT the gold standard for quantification of myocardial ischemia (see Chapter 3). However, it has been shown that the perfusion defect size has a strong correlation with the myocardial infarct size when the myocardial perfusion SPECT is performed a few days after opening of the coronary artery.10
Cardiac Magnetic Resonance Imaging
Along with recent technical advances, CMR imaging has become a powerful tool for the evaluation of irreversible myocardial injury. During acute myocardial infarction, cell membranes lose integrity and rupture, which increases the extracellular volume. By using an extracellular contrast medium, this region of irreversibly damaged myocardium can be accurately identified.11 CMR imaging is usually undertaken 10 to 30 minutes after injection of an extracellular contrast medium.
Therefore, CMR imaging can be considered the reference method for in vivo visualization of myocardial infarction (see Chapter 6).
More recently, CMR has been introduced as a method for quantification of the myocardium at risk by using a T2-weighted sequence that visualizes myocardial edema. This method has been validated in both animals12 and humans.13 In the patients presented in this chapter, there is a difference in imaging parameters. Patients 1 and 2 were imaged using an 8-mm slice thickness, whereas patients 3, 4, and 5 were imaged using a 15-mm slice thickness. This probably results in a slight overestimation of the myocardium at risk in patients 3, 4, and 5 due to partial volume effect in the most basal slices.
Positron Emission Tomography
Unlike myocardial perfusion SPECT imaging, which detects single photons, PET imaging detects paired simultaneous annihilation photons. This coincidence detection leads to least an increase in the sensitivity of PET compared with myocardial perfusion SPECT, with improved image quality.
Flow reserve (hyperemic flow/baseline flow) and absolute quantification of regional, baseline, and maximal myocardial perfusion (in mL/min/g tissue) are feasible and well validated using dynamic PET image acquisition. These quantitative data can support visual and semiquantitative image interpretation and improve detection of preclinical and multivessel coronary artery disease. PET provides a sensitivity of 91% and a specificity of 89% for the diagnosis of obstructive coronary artery disease.14 Just as in myocardial perfusion SPECT, PET imaging uses ionizing radiation that can result in late adverse biologic effects. But positron-emitting tracers typically provide less radiation burden when compared with myocardial perfusion SPECT tracers due to their short half-lives.
The most widely used tracers for evaluating myocardial perfusion with PET in clinical practice are generator produced rubidum-82, cyclotron produced nitrogen-13 ammonia, and to some degree oxygen-15 water. Another commonly used PET tracer is fluorine-18 fluoro-2-deoxy-D-glucose (18F-FDG). The uptake and retention of 18F-FDG reflects the activity of the various glucose transporters and hexokinase-mediated phosphorylation in a matter similar to unlabeled glucose. In the setting of ischemic heart disease, viable myocardium often exhibits a shift in substrate utilization from aerobic to anaerobic metabolism. Therefore, 18F-FDG imaging can be used to assess glycolytic activity of the myocardium during ischemia.
Stay updated, free articles. Join our Telegram channel

Full access? Get Clinical Tree


