Fig. 7.1
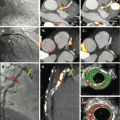
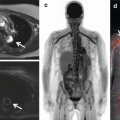
Iron overload in the myocardium decreases native T1 [30]. Native T1 maps from a patient with hemochromatosis and iron overload are shown with a remarkably low myocardial T1 (panel a). The native T1 maps in hemochromatosis and iron overload contrast with those from a patient with normal myocardial T1 who also had a small pericardial effusion (panel b)
If the clinical context is known, native T1 mapping may provide potentially useful information about the presence or absence of disease. Native T1 generally increases in conditions that increase total myocardial water. These may include focal myocardial insults such as acute myocardial infarction [17, 18], myocarditis [16, 19], or stress cardiomyopathy [20]. Diffuse and acute myocardial insults also can increase native T1 including global myocarditis [16] and even hyperemia associated with vasodilator stress [21]. Chronic diffuse disease also increases native T1 including diffuse fibrosis [22] in cardiomyopathy [23, 24], amyloidosis [25–27], and even systemic capillary leak syndrome [3]. Importantly, the extent of myocardial native T1 elevations has been shown to relate to prognosis in systemic light-chain amyloidosis [27].
Just like a multitude of other cardiac parameters (e.g., ejection fraction), abnormalities in native T1 need to be interpreted within the clinical context. Edema, increased blood volume, fibrosis, and amyloidosis can all increase native T1 values. Yet, the clinical context is usually known (e.g., a chest pain syndrome or a new cardiomyopathy), so T1 mapping remains as important and promising tool for the clinician and researcher. Investigations into the diagnostic and prognostic performance of native T1 remain an active area of research by many centers.
7.3 Decreased Native T1
Initial work suggests that low T1 appears sensitive and specific for detecting (a) myocardial glycosphyngolipid accumulation in Anderson-Fabry disease [28, 29] or (b) iron overload [30] in hemochromatosis (Fig. 7.1), thalassemia, or other disease associated with excess iron. T1 mapping therefore introduces an important CMR tool to detect these important but uncommon conditions that may have immediate diagnostic implications for patients and their physicians. Because T1 mapping appears highly reproducible [31], native T1 mapping may allow one to track response to therapy in these conditions given their ability to quantify disease burden, but such data have not yet been published.
T1 mapping could follow the precedent set by T2* (star) myocardial iron quantification measures whereby CMR-based care improved outcomes. Myocardial T2*-guided chelation therapy and clinical care appear to have culminated in dramatically lower cardiac mortality for thalassemia patients. T2* CMR measures can allow one to adjust iron chelation treatment based on myocardial siderosis quantification and match intensity of therapy with disease severity. Mortality rates from cardiac iron overload appear to have improved coincident with the introduction of this capability to clinicians [32]. This scenario of measuring important myocardial tissue changes with CMR parameters illustrates vividly a case where the fundamental promise of CMR, i.e., to match the right treatment to the right patient, appears to have been realized. T1 mapping might have the potential to deliver similar results in the future.
7.4 Extracellular Volume Fraction (ECV) Mapping
The extracellular volume fraction (ECV) quantifies the interstitial space (including the myocardial blood volume contained within the myocardial vasculature estimated to be ~4.5 % [33]) by using Gd contrast as an extracellular space marker [34–36]. ECV measures assume that Gd contrast is not bound to intravascular proteins (e.g., albumin) which would prevent the free distribution of Gd contrast throughout extracellular (plasma and interstitial) fluid. When nonprotein-bound contrast agents are used, ECV maps [3, 37, 38] image the interstitial space and are typically expressed as a percentage or a decimal that is encoded in the signal intensity of each pixel (Fig. 7.2). Clinical ECV mapping images are usually derived from a pixelwise parametric fit of a series of images acquired after one or more radiofrequency pulses for T1 mapping pre- and post-contrast. Since ECV mapping is an extension of T1 mapping, coregistration remains an important requirement for image quality.
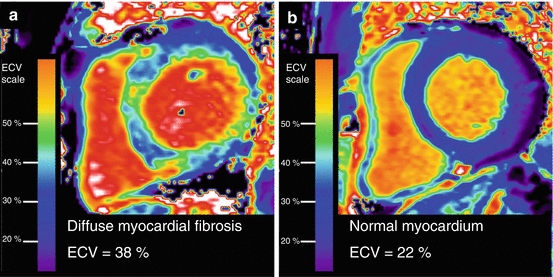

Fig. 7.2
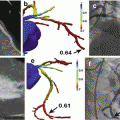
ECV mapping quantifies diffuse fibrosis in a patient with nonischemic cardiomyopathy (panel a), in contrast to a patient without fibrosis who demonstrates normal ECV measures (panel b)
Conceptually, the ECV technique simply measures the myocardial uptake of Gd relative to plasma, assuming equilibration of Gd contrast between extracellular extravascular and intravascular compartments (without any intravascular protein binding that would prevent free dispersion of contrast). The proportional uptake of myocardium is then a direct measurement of the extracellular space. The ratio of the relative concentrations in the myocardium and whole blood is measured by their specific changes in relaxivity (i.e., ΔR1 = 1/T1postcontrast – 1/T1precontrast) to yield the partition coefficient, λ = ΔR1myocardium/ΔR1blood. The Gd concentration in myocardial interstitial fluid is in a dynamic equilibrium with plasma (not whole blood) during renal clearance, which is relatively slow compared to the dispersion of Gd. Due to the displacement of Gd contrast by erythrocytes in whole blood T1 measurements, one must multiply λ by (1-hematocrit) to yield ECV, which is expressed as a volume percent: ECV = λ · (1-hematocrit). Water exchange effects may introduce some time dependence which is likely a concentration dependence especially at high Gd concentrations or early (i.e., <10 min) after contrast administration [39–43], but these effects do not appear to represent major barriers to its clinical utility as an important imaging biomarker with significant prognostic potential [27, 44–48].
ECV has been shown to be a robust measure of myocardial fibrosis assuming that myocardial edema or amyloidosis is absent. Although significant distortions in myocardial tissue can occur with tissue processing, multiple studies have still shown high agreement between ECV and histologic measures of myocardial collagen content such as the collagen volume fraction (CVF) [40, 49–52]. ECV is also reproducible [39, 43, 50, 53–55] although a small amount of Gd dose dependence has been observed as well as cross vendor issues [39–41, 43]. Nonetheless, R 2 values for correlation of myocardial fibrosis between ECV and histologic CVF measures are high [40, 49–52] and range between 0.69 and 0.90 [36, 40, 42, 43, 47]. The R 2 values for ECV compare favorably to significantly lower R 2 ranges of 0.32–0.61 between isolated post-contrast T1 measures and CVF measures, where isolated post-contrast T1 measures are a surrogate for ECV [56–58]. Isolated post-contrast T1 values are likely confounded by variation-related weight-based gadolinium contrast dosing, renal clearance, time elapsed between contrast bolus and T1 measurement, and displacement of contrast by the hematocrit. Thus, gender, obesity, renal disease, technologist practice, and anemia would be expected to exert greater influence on isolated post-contrast T1 measures than ECV. Notably, large prognostic studies across multiple centers have chosen to report associations between ECV and outcomes rather than isolated post-contrast T1 measures [44, 45, 47, 48], suggesting that ECV is the more robust measurement to demonstrate relationships between myocardial fibrosis and outcomes.
7.5 Initial ECV Results
ECV introduces a new concept in cardiology practice and permits one to dichotomize the myocardium into its cellular compartment (mostly myocytes, i.e., 100 %-ECV) and interstitial compartment (i.e., ECV, mostly collagen, but also amyloid protein or edema depending on the clinical setting). The heart may be like other organs (e.g., the lung with pulmonary fibrosis, liver with cirrhosis, or kidney with glomerular fibrosis) where disruption of its architecture through interstitial expansion from myocardial fibrosis leads to organ dysfunction and vulnerability [2, 59]. Importantly, myocardial fibrosis exhibits a high degree of plasticity [60] and has been shown to be a modifiable “intermediate phenotype” of pathologic remodeling [59, 61–64] and “interstitial heart disease” [65] that are fundamentally treatable [66–69]. Myocardial fibrosis may be an important modifiable therapeutic target for both contemporary and emerging treatments. Indeed, myocardial fibrosis can be a common disease pathway from a variety of potential insults [2, 60].
Myocardial fibrosis also indicates vulnerability to adverse outcomes [44–47, 70, 71]. Preliminary outcome data using ECV measures of myocardial fibrosis [44, 45, 48] or amyloidosis [27] suggest that ECV can improve risk stratification [47] as well as identify therapeutic targets for therapy with conventional or newer antifibrotic agents [2]. Even after accounting for common clinical conditions that relate to outcomes in multivariable Cox regression models, ECV may improve the classification of individual patients at risk and provided added prognostic value beyond age, gender, renal function, myocardial infarction size, ejection fraction, hospitalization status, and heart failure stage using contemporary statistical metrics [47]. Initial outcome data show that increased ECV is associated specifically with mortality or hospitalization for heart failure.
Notably, “antifibrotic” treatment with conventional medications such as lisinopril, losartan, and spironolactone has been shown to reverse fibrosis and improve diastolic function and perfusion reserve [66–69]. These same agents also have improved patient outcomes in several large-scale trials in select populations [71–78], regardless of blood pressure lowering effects [79, 80], even in the absence of clinical heart failure [80]. As one may expect from these data, ECV detects lower myocardial fibrosis in patients receiving renin-angiotensin-aldosterone antagonists, although the extent of the reduction appears modest [44]. Detection of the expected clinical changes in ECV with “antifibrotic treatment” by ECV suggests that ECV is indeed a robust clinical measurement.
Illustrating the importance of quantifying structural disease in the myocardium, these associations between ECV and outcomes appear stronger than more traditional risk stratifiers such as ejection fraction or a disease exposure category (e.g., hypertension or diabetes) [44, 45, 47]. Furthermore, myocardial ECV may predict outcomes better than left ventricular mass [46] suggesting that left ventricular myocardial “quality” may be more important than its “quantity.” Myocardial fibrosis measured by ECV in humans correlates positively with LV mass [44, 45, 81], reflecting prior pathologic observations [70, 82–85]. These findings whereby myocardial mass is increased in the setting of myocardial fibrosis suggest that “replacement” is not the solitary mechanism leading to myocardial fibrosis, a situation where one would expect to encounter decreased myocardial mass. On this issue, further work is needed to understand complex relationships between the myocyte compartment and the fibroblast in interstitial compartment. In addition, further work is also needed to understand how interstitial expansion from myocardial fibrosis or even amyloid may impact myocyte energetics regardless of the etiology [63, 86]. Interestingly, cardiac amyloidosis yields typically higher values of ECV than myocardial fibrosis which renders it a promising diagnostic tool and prognostic tool for cardiac amyloidosis [27, 51, 87–90].
7.6 Comparison of ECV Versus Late Gadolinium Enhancement (LGE) to Quantify Interstitial Expansion
Quantifying interstitial expansion in the noninfarcted myocardium from fibrosis or amyloidosis is an important endeavor based on the relationship between interstitial expansion, diagnoses, and adverse outcomes [27, 44, 45, 48]. Late gadolinium enhancement (LGE) imaging is the traditional method employing Gd contrast to image regions of higher extracellular space relative to the myocardium with less extracellular space. On the other hand, ECV quantifies the full spectrum of interstitial expansion in the noninfarcted myocardium regardless of whether LGE is apparent.
Unlike LGE, ECV is inherently quantitative and remains the metric of choice to understand the biology of interstitial expansion in noninfarcted myocardium. ECV is the better metric for this purpose compared to LGE based on (a) robust ECV validation, with high correlations with myocardial CVF measurements [36, 40, 42, 43, 47], (b) excellent ECV reproducibility across separate CMR scans rendering ECV suitable for evaluating serial changes in myocardial fibrosis [39, 43, 50, 53–55], and (c) superior ECV associations with outcomes [44]. In contrast, interscan reproducibility data for use of LGE as a quantitative metric interstitial expansion in the noninfarcted myocardium are lacking. Validation data for use of LGE as a quantitative metric of fibrosis in the noninfarcted myocardium as defined by the collagen volume fraction are also lacking.
In principle, significant limitations related to LGE should not be allowed to bias fully quantitative validated ECV measures of interstitial expansion (e.g., fibrosis) in the noninfarcted myocardium. Spatial variation of interstitial expansion is the key feature that renders it detectable by LGE. There is no biologic rationale to permit spatial variation of myocardial fibrosis (or any interstitial expansion) apparent on LGE images to influence quantification by ECV. Excluding foci of apparent LGE from ECV measurements will arbitrarily bias ECV measures downward to an unpredictable degree based on the same issues that limit LGE as a quantitative metric for myocardial fibrosis in the noninfarcted myocardium. LGE should not be used as an arbiter to gauge the extent of fibrosis in noninfarcted myocardium.
Employing LGE as a quantitative measure of fibrosis in the noninfarcted myocardium to capture the full range of fibrosis may be a futile endeavor. There remains a persistent inability to identify a generalizable threshold between the normal myocardium and fibrosis in the noninfarcted myocardium over the past 16 years since the initial description of LGE [91]. While most clinicians can agree on the presence of dense foci of “nonischemic” LGE, ascertaining a threshold between lesser degrees of nonischemic LGE and unenhanced myocardium is subjective, remains unresolved, and is not generalizable across centers. Fundamentally, one never knows whether foci of LGE in the noninfarcted myocardium are truly isolated or represent the focal “tip of the iceberg” of a more widespread, diffuse process. One can never discern the extent of fibrosis contained within the nulled, unenhanced myocardium on LGE images. LGE may erroneously portray a “non-enhanced” myocardium as normal [3, 37, 39, 45, 49, 92, 93].
This lack of agreement on an LGE threshold between “normal” and “abnormal” is expected when one considers how patient characteristics and acquisition parameters influence the appearance of fibrosis in the noninfarcted myocardium on LGE images. These limitations culminate in an inability to identify a threshold that is robust and generalizable. The appearance of fibrosis in the noninfarcted myocardium on an LGE image varies with the extent of fibrosis contained within the nulled “reference” myocardium that does not appear enhanced on LGE images. In addition, the appearance the “threshold” between “normal” and “abnormal” is influenced by pulse sequence and several other parameters (e.g., 2D vs. 3D, phase-sensitive reconstruction, surface coil intensity correction, slice thickness and spatial resolution, inversion time, contrast agent and dose, extent renal clearance, signal-to-noise ratios, patient body habitus such as obesity, segmented versus “single-shot” acquisition, breathholding adequacy, arrhythmia, temporal resolution and heart rate, coil design, parallel imaging acceleration, factor, and other factors). LGE signal intensity is expressed in arbitrary units, and the relationship between LGE signal intensity and Gd concentration is nonlinear.
While LGE is not robust for quantifying fibrosis in noninfarcted myocardium, it is important to recognize that LGE is the clinical gold standard to quantify myocardial infarction. LGE is exceedingly well validated for this purpose of detecting and quantifying myocardial infarction [91, 94, 95], whether recognized or not [96–98]. Separating infarcted from noninfarcted myocardium is usually straightforward with LGE given the tremendous difference in signal intensity between infarcted and noninfarcted myocardium. Myocardial infarction typically occurs in spatially constrained patterns (e.g., endocardial involvement, coronary distribution, etc.) which facilitate its identification further [99]. So myocardial infarction is simple to distinguish from the noninfarcted myocardium and quantify its extent.
7.7 Overlap of T1 or ECV Across Patient Groups for Diagnosis Versus Prognosis
While initial results of T1 and ECV data are promising, concern may arise when the distributions of ECV or other T1 data overlap according to a disease classification scheme (e.g., dilated cardiomyopathy [23, 52]) or some disease “exposure variable” such as aortic stenosis [53, 81], diabetes [44], heart failure with or without preserved ejection fraction [100, 101], etc. When native T1 and ECV are used as diagnostic tools to detect that condition or disease classification scheme, this concern is valid. Overlapping distributions of T1 and ECV may pose limitations for their use as a diagnostic tool specifically for that the classification scheme or disease is “exposure variable.” Yet, it is important to put this concern into a biological context. It is expected that the myocardial “response” to a given stimulus or disease state measured by T1 mapping would overlap across disease categories. For example, the spectrum of myocardial fibrosis in the noninfarcted myocardium measured by histology is known to vary across individuals [40, 52, 81, 102] and also reflected in the robust histologic validation data for ECV where one encounters a spectrum of disease [40, 49–52]. Determinants of myocardial fibrosis [2] or amyloidosis in the noninfarcted myocardium remain incompletely understood.
The goal of native T1 or ECV for prognostic purposes, however, is to measure the myocardial “response” to a given stimulus from a disease state or classification scheme. This “response” or “nonresponse” may be more prognostically relevant than the clinical disease state or classification scheme. It is important to recognize that outcome data are the final arbiter of what constitutes eventual vulnerability to the patient among the various parameters that can be measured in the genesis of various disease states. Ascertainment of subsequent event rates therefore represents the gold standard for vulnerability. Therefore, any overlap of ECV data (or other T1 data) between disease categories does not limit their clinical assessment of vulnerability nor does any overlap of myocardial fibrosis across disease categories relegates its status as a biologically and prognostically meaningful measurement. Indeed, ECV has robust histological validation data [40, 49–52] and has been shown to have high reproducibility [39, 43, 50, 53–55]. In fact, ECV measures of myocardial fibrosis may be the critical determinant of vulnerability rather than a patient’s disease category or classification (e.g., diabetes [44]).
Outcome data are necessary to compare T1 or ECV measures with more traditional disease states of classification schemes for prognostic purposes. Such data are important because they inform paradigms of disease. In general, the stronger the association with outcomes, the more likely the specific measurement is biologically important. Trials that modify the measurement under investigation can then discern whether the measurement is a risk marker or a risk factor that is causal. Notably, despite any overlap in disease category or classification scheme, preliminary data demonstrate that ECV may improve the classification of individual patients at risk and provide added prognostic value beyond age, gender, renal function, myocardial infarction size, ejection fraction, and heart failure stage [47, 48]. Additional outcome data regarding T1 mapping and ECV mapping to advance our understanding of myocardial fibrosis are accruing.
7.8 ECV and T1 Mapping Limitations
ECV detects subclinical changes [3, 37], but native T1 mapping algorithms are not yet standardized, remaining center dependent and vendor dependent [5]. Normalization to some reference standard may be a potential solution to correct for site-specific difference and still retain the ability to stratify patient cohorts. Optimization of T1 maps and ECV maps is ongoing. Systematic biases in T1 measurements are likely to cancel one another for ECV measurements since ECV is a ratio. This situation is analogous to ejection fraction measurements whereby systematic biases in estimated volumes also cancel one another to a large extent. Indeed, most centers consistently report similar normal ECV reference ranges of <29 % [10, 33, 37, 39, 52–54, 87, 103, 104].
ECV and T1 mapping also remain limited by partial volume effects constrained by their limited spatial resolution, whereby relatively large pixels can straddle tissue borders. As such, T1 mapping and ECV are not yet well suited for quantitative measurements of the right ventricle or left atrium given the thinness of these tissues [5, 105]. ECV also cannot assess the precise composition and structural modifications of the myocardial fibrosis, such as extent of cross-linking and the accumulation of advanced glycation end products. Despite these limitations, T1 mapping and ECV mapping are yielding novel insights into myocardial disease and showing promise as risk stratifiers.
Stay updated, free articles. Join our Telegram channel

Full access? Get Clinical Tree


