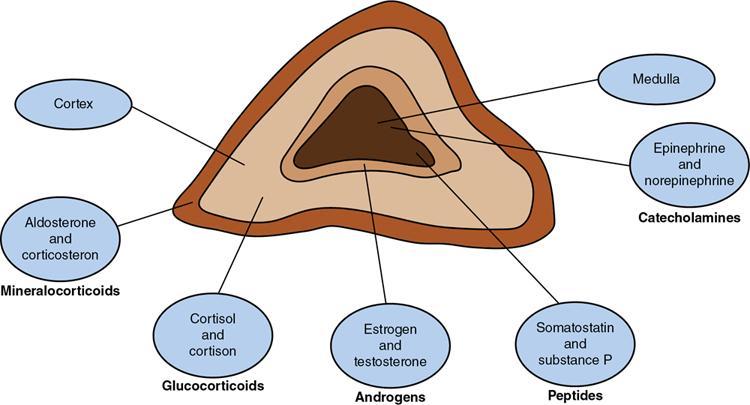
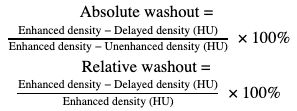
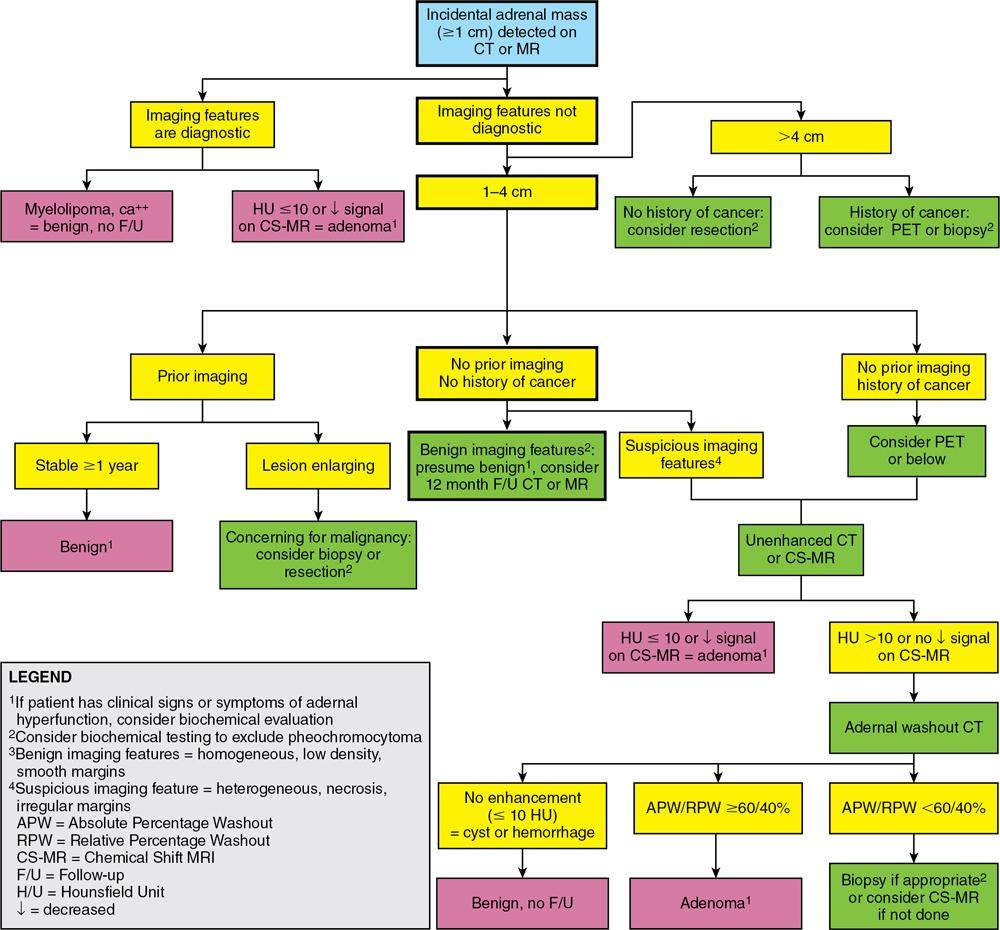
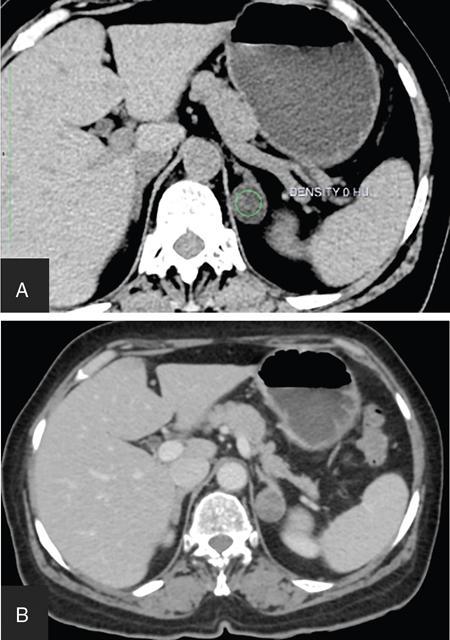
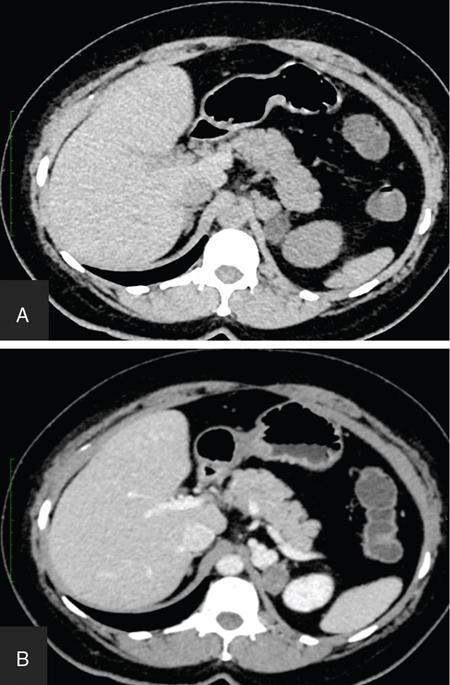
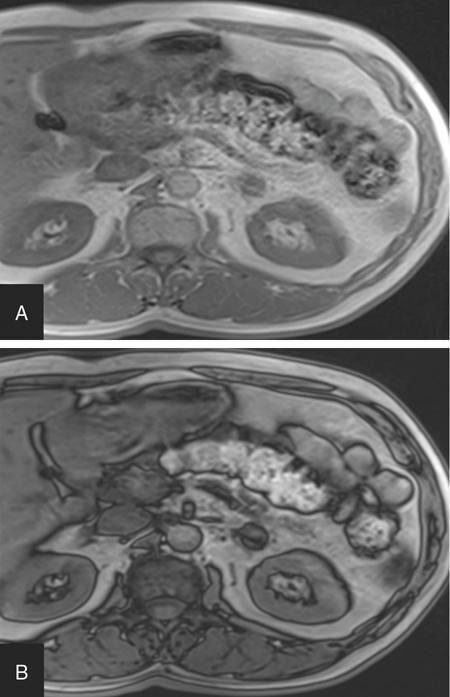
ADRENAL ANATOMY AND IMAGING TECHNIQUES Dipak Patel, Sanjay Mehta, Vishal Shah The adrenal glands (also called suprarenal/surrenal glands) are a pair of endocrine glands, retroperitoneal in location, situated superior and ventromedial to kidney on either side. Bartolomeo Eustachi described regrading adrenal in 1563 while its importance was recognized by Thomas Addison in 1855 and Brown-Séquard in 1856. It has two distinct components, the cortex and medulla, responsible for the production, release of the multiple hormones, regulating the metabolism, salt–water equilibrium in blood stream and immune system functions; besides helping body’s response to stress. Adrenal has two main parts: the cortex and the medulla. It is enclosed in complete fibrous capsule, merging with the renal capsule on either side and liver on right side. Because of lipid rich contents, cortex appears yellow. It consists of three microscopic zones. Zona glomerulosa – outer most layer, produces mineralocorticoids, largely responsible for the regulation of blood pressure; zona fasciculata – central layer, responsible for the production of glucocorticoids and zona reticularis – inner zone, thinner and darker, produces androgens. Medulla is the core of the adrenal, surrounded by the cortex and mainly found in head of the gland. It is ellipsoid in shape, grey-tan in colour and <10% of the gland volume. Greatly vascularized medulla emanates about 80% of adrenaline (epinephrine) and 20% noradrenaline (norepinephrine) (Fig. 10.16.1.1). Computed tomography (CT) histogram is another tool to unenhanced CT. It utilizes Hounsfield unit (HU) of each pixel in the given region in context of its number as well as frequency of negative pixels. It has been noted that >10% negative pixel (i.e. less than 0 HU correlate with the amount of lipid content) on histogram has sensitivity of 91% to detect adenomas accurately as compared to sensitivity of 66% on unenhanced CT scan, if used alone. Dedicated multiphasic adrenal CT protocol consists of unenhanced phase, followed by venous (about 60–90 s, after intravenous injection of nonionic iodinated contrast about 1.3–1.5 mL/kg body weight at the rate of 3–4 mL/s) and delayed (at 15 min) phases. Routinely neutral oral contrast is preferred unless indicated otherwise. Acquisition of additional arterial phase images (20–25 s) may be considered for two reasons, one for understanding adrenal arterial anatomy, may provide a guide for surgical mapping, if needed, and another to see for any hypervascular lesion like pheochromocytoma. Adrenal washout ratios are obtained using venous and delayed contrast images. (Venous and delayed phase images are required for the calculation of adrenal washout ratios.) For the evaluation of HU values, ROIs have to be placed covering at least two-thirds of the lesion, excluding areas of calcification, necrosis or haemorrhage, if any. Absolute washout = Enhanced density − Delayed density (HU) Enhanced density − Unenhanced density (HU) × 100% Relative washout = Enhanced density − Delayed density (HU) Enhanced density (HU) × 100 % Accuracy of washout calculation improves after the incorporation of unenhanced HU value (inclusion of noncontrast HU value helps in more accurate calculation of washout); therefore, whenever possible, absolute percentage wash-out (APW) should be calculated. Absolute and relative washout of about ≥60% and ≥40%, respectively, strongly suggest benign adrenal adenoma. There are certain pitfalls to washout ratios, ROI calculation may be inappropriate if it is a heterogeneous lesion with haemorrhage/necrosis and few of the lesions may show similar enhancement characteristics (hypervascular adrenal metastases, pheochromocytomas and adrenocortical carcinoma). Certain technical modifications can be applied to reduce the radiation dose and scan time, like higher pitch (should not be more than 1.5 for optimal image quality). Low-dose CT scan (LDCT) is performed with kilovoltage peak (kVp) in the range of 90–120 and mA of 40–80, particularly for lung cancer screening. According to Godoy et al., adrenal masses >2 cm (or ≥1 cm in patients with cancer history) and <4 cm in LDCT should be evaluated with adrenal protocol CT. Dual-energy CT scan (DECT) uses two different tube voltages in a single acquisition, like 140 and 80 kVp. Postcontrast and excretory phase acquisition will be done at two different tube current in single breath hold. Virtual noncontrast images have been acquired after subtraction/deduction of iodine from the contrast images. With this data set, we can calculate the contrast washout values and diagnose adenoma. Magnetic resonance imaging is a second preferred imaging modalities for assessment of adrenal disease. It has the advantage of multiparametricity, multiplanarability and high contrast-to-noise (CNR) compared to the CT scan. Chemical shift imaging (CSI) furnishes details of microscopic fat (CSI provides insight into intracytoplasmic fat). The normal adrenal appears isointense to the renal cortex on T1-weighted images and may show corticomedullary differentiation on T2-weighted images. Standard magnetic resonance imaging (MRI) protocol should provide information about the anatomical and histological characteristics of an adrenal mass (Table 10.16.1.1). Fluid component of lesion is appreciated on T2-weighted images. Pheochromocytoma appears hyperintense compared to other lesions. Diffusion-weighted images (DWIs) – Apparent diffusion coefficient (ADC) value of adenoma and metastatic lesion show considerable overlap in their values, which limits the use of DWI in the indeterminate lesion. Pheochromocytoma reveals high ADC value than adrenal metastasis or adenoma. Postcontrast dynamic imaging is useful in case of indeterminate lesion where contrast study provides information regarding enhancement pattern and vascularity of lesion. Same parameter is mandatory for the enhancement evaluation of lesion on precontrast and postcontrast studies. A dynamic study has been acquired in arterial, interstitial and delayed phases using breath-hold 3D gradient sequences. CSI is the most important tool to detect microscopic fat and hence in the differentiation of adenoma with other lesions. We will discuss about fundamental principles behind CSI in short as it has been covered in detail in the section of MRI physics. Roles of CSI would be described in different section. High intracytoplasmic (microscopic) fat is one of the features of adrenal adenoma. Fat-suppressed MR sequences are sensitive to detect macroscopic fat, but CSI due to its virtue to detect microscopic fat becomes a mainstay for adrenal MRI. Chemical shift manifests differences of Larmor frequency in protons and shown in parts per million (ppm). The chemical shift for fat and water is 3.3–3.5 ppm. In-phase and out-phase imaging is commonly used in clinical practice for chemical shift. Latterly, Dixon methods are widely applied for CSI. Phase cancellation artefact happened because of chemical shift is exploited for in-phase and out-phase imaging. When protons of fat and water are in-phase (same location), the received signal from protons are additive while fat and water protons are completely in out-phase, the received signals cancel each other. The Dixon method is acquired using the same principle of in-phase and out-phase imaging and then fat and water imaging created by mathematic postprocessing. Fat-water swapping – measurement fallacy occurred in areas of field inhomogeneity leads to error in deciding voxel contents of water or fat. So, fat- and water-only images may not be useful. Black boundary artefact or Indian ink artefact is seen at the interface of water and fat, usually seen at muscle–fat interface and the boundary of abdominal organ, which will be the hallmark to identify out phase images. Adrenal lesion characterization better performed by conventional in-phase and out-phase images while quantitative assessment of fat in adrenal lesion better accomplished on Dixon technique. Qualitative assessment is the visual analysis for signal drop between in-phase and out-phase images of adjacent organs like liver, spleen or paraspinal muscles. Subtraction images show a signal drop at a bright spot, which makes identification of fat within the lesion more obvious. Quantitative assessment is the process in which ROI kept on in-phase and out-phase images of lesion to acquire signal drop. Fat fraction and fat ratio are additional quantitative methods to measures fat in the lesion by Dixon techniques. The fat fraction is the proportion of fat signal of lesion on fat-only images divided by sum of lesion signal intensity on fat- and water-only images. The fat ratio is the value which show signal intensity of lesion on fat-only images compared to anterior abdominal wall subcutaneous fat signal intensity on fat-only images. Spleen is preferred as a reference organ as propensity of fatty infiltration into liver and paraspinal muscle. In case of iron deposition in the spleen, kidney parenchyma can be used as a reference organ. Microscopic fat within tissue makes them appear darker on out-phase images than in-phase images. Four sets of images: water-only, fat-only, in-phase and opposed-phase are the result of a Dixon sequence. Microscopic fat has been detected and quantify by this technique. Indeterminate lesions on plain CT with density higher than 10 HU and less than 30 HU further evaluated with the help of contrast-enhanced CT with adrenal protocol which exploits washout characteristics of lesion or chemical shit MRI which identifies signal dropout due to abundance of microscopic fat within the lesion. Embryonic origin of adrenal cortex is from mesoderm while medulla is from neuroectoderm. Outer cortex further divides into three distinct layers, which already we understood in anatomic section. Adrenal primordium develops by the 25th day of gestation, medial to the mesonephros and urogenital ridge. Adrenal gland enlarges to 1 mg by the 45th day of gestation. Medulla develops by the migration of primitive sympathetic cells and neural crest at around 45th day. At about 18th week of gestation, foetal adrenal is four times the kidney and it weighs around 5 gm at birth, about one-third the size of kidney as a result of regression in size of the cortex. Adult-type cortex is developed by 4–5 years of age. Adrenal agenesis has association with ipsilateral renal agenesis while fusion of adrenal glands (joining posterior to abdominal aorta) has association with fused kidneys. Adrenal hypoplasia occurs as absence/hypoplasia of the foetal cortex with deformed medulla or as disorganized foetal medulla and cortex with absent permanent cortex. Ectopic location of adrenal is called adrenal heterotopia. Congenital adrenal hyperplasia leads to early puberty in boy and girl and appearance of male characteristics in female due to impaired production of cortisol and raised levels of male hormones. The adrenals, retroperitoneal structures lie ventromedial and superior to the kidneys and enclosed by the perirenal fascia. Each glands made of body and medial and lateral limbs. Right adrenal appears as ‘V’ or comma shape and left adrenal appears as ‘Y’ or triangular shape. Right adrenal is comparatively smaller than the left gland. Maximum width of the right adrenal is about, 6.1 mm and of left adrenal 7.9 mm. Normal weight is 4–6 gm. Relations — Right adrenal show right crus of diaphragm and right inferior phrenic artery medially, laterally right lobe of liver, anteriorly inferior vena cava and posteriorly right kidney. Left adrenal has left crus of diaphragm and left inferior phrenic artery medially, anteriorly splenic vessels, pancreas, lesser sac and stomach, anteromedially diaphragm and posteriorly left kidney. Three pairs of arteries supply adrenal glands, superior adrenal artery, which is a branch of inferior phrenic artery; middle adrenal artery, a branch of abdominal aorta and inferior adrenal artery, a branch of renal artery. Venous drainage – Right adrenal vein is short and drains into IVC and left adrenal vein is longer and drains into left renal vein. Lymphatics are limited to the capsule only and drain into the para-aortic nodes. Celiac, aorticorenal and renal ganglia supply postsynaptic fibres and abdominopelvic splanchnic nerves supply presynaptic fibres to the gland. Imaging of adrenal is indicated for differentiation of benign versus malignant lesions, nonmetastatic versus metastatic lesion and hence to reach up to definite diagnosis, to avoid invasive procedures or follow-up. Medullary tumour like pheochromocytoma and occasionally neuroblastoma are better evaluated on nuclear scan. Adrenal lesion evaluation done by different imaging modalities which includes ultrasound, CT, MRI and nuclear imaging. Adrenal glands are often difficult to see on ultrasound, and hence not the imaging modality of choice. However, ventrolateral axial scanning is the best approach to assess the adrenals. Ultrasound is the choice of investigation for the evaluation of adrenals in neonate and young children, which will be dealt within paediatric section. CT is one of the baseline imaging modality for the evaluation of adrenal lesions. On detection of incidental or suspected adrenal lesion, protocol should be tailored for optimum characterization of adrenal pathology. Due to widespread use of multidetector CT, number of adrenal incidentalomas is increased. Adrenals appear as inverted ‘V’-/‘Y’-shaped organs, situated ventromedial and superior to the kidneys. Scanty retroperitoneal fat may render imaging of adrenals difficult due to compromised spatial resolution. Unenhanced CT and multiphase contrast-enhanced CT play a very important role in adrenal imaging. On noncontrast (unenhanced) CT, evidence of intralesional macroscopic fat is highly suggestive of benign myelolipoma, whereas CT density of <10 HU suggests benign lipid rich adrenal adenoma and hence further imaging is not required. It also helps to evaluate foci of intralesional haemorrhage as well as calcification. ADRENAL INCIDENTALOMA Rushabh Shah Adrenal incidentalomas or incidental adrenal lesions are defined as clinically inapparent adrenal masses or nodules (larger than 1 cm) discovered incidentally during diagnostic imaging performed for indications other than adrenal disease. Probability of adrenal incidentalomas increases with age approximately 0.2% in young age reaches up to 7% to 10% in old age. Adrenal incidentalomas further subclassified into nonfunctioning versus functioning, primary versus metastatic, benign versus metastatic. Most frequent (80% to 90%) type of the incidentaloma is nonfunctioning benign adenoma. However, adrenal gland is the common site for metastasis and much less commonly site for primary adrenal tumours including pheochromocytoma, functioning adenomas and adrenocortical tumours (Tables 10.16.2.1–10.16.2.2). Adenoma (nonfunctioning) Adenoma (functioning) – cortisol secreting, aldosterone secreting Hyperplasia (PBMAH – primary bilateral macronodular adrenal hyperplasia) Adrenocortical carcinoma (secreting or nonsecreting) Pheochromocytoma (benign/malignant) Ganglioneuroma Neuroblastoma, ganglioneuroblastoma Haemangioma, angiosarcoma myelolipoma – lipoma, teratoma and other mesenchymal lesions More commonly from lung, breast, ovarian, kidney, melanoma, lymphoma, leukaemia Endothelial, pseudocyst, epithelial, parasitic, hamartomatous Lymphoma, amyloidosis, sarcoidosis Tuberculosis, histoplasmosis, blastomycosis The primary role of imaging in management of incidentalomas is to correctly identify hyperfunctioning adenomas and relatively uncommon malignant lesions and as a result avoiding unnecessary clinical workup – follow-up of benign clinically and radiologically insignificant disease. In 2017, American College of Radiology (ACR) incident finding committee published a white paper regarding management of incidental adrenal lesions. Recommendation takes into consideration of certain diagnostic features (presence of macroscopic fat, low CT density – less than +10 HU, signal drop on chemical shift imaging and presence of haemorrhage). Further lesions with large size or growing size have been considered as suspicious. History of known malignancy or clinical signs and symptoms related functioning adrenal lesion may help in management of incidental adrenal lesions for metastasis or functioning adrenal tumours, respectively (Fig. 10.16.2.1). ADENOMA Bhavdeep Rabadiya One of the most common benign adrenal cortical neoplasm, adrenal adenoma, depending on hormone secretions classified into ‘hyperfunctioning’ and ‘nonhyperfunctioning’. A precursor for hormone production is believed to be intracytoplasmic fat in adrenal cortex. Intracytoplasmic fat is seen in about 70% adenomas, which are lipid-rich and substantial amounts of lipids is not seen in lipid poor 30% adenomas. Nonhyperfunctioning and even few hyperfunctioning adenomas are clinically silent and they are frequently discovered as an incidentaloma. Adrenal adenomas are usually made up of cell cords with intracytoplasmic lipid. Significant association between functional status and lipid content of adenomas is not still established. Differentiation between hyperfunctioning and nonhyperfunctioning adenomas is not yet established by chemical shift (CS) magnetic resonance imaging (MRI). Nonhyperfunctioning adenomas are the most common adrenal tumour, approximately 70% of total adrenal masses and greater than 90% of incidentalomas. These lesions are clinically nonsignificant, but may require characterization in order to exclude other causes of an adrenal mass. Due to the absence of ionizing radiation as seen on computed tomography (CT), MRI is modality of choice for following up. Precontrast and postcontrast CT scans with delayed phase can also diagnose adrenal cortical adenomas. Cortisol producing adenomas are common hyperfunctioning adrenocortical neoplasm. Cushing’s syndrome is a complex resulting from excess levels of cortisol due to either endogenous causes or prolonged steroid administration. Excessive production of adrenocorticotropic hormone (ACTH) by pituitary adenoma is known to cause 85% of endogenous Cushing’s syndrome (Cushing’s disease). Contrast-enhanced MRI brain, focused on sella/pituitary gland helps in determining pituitary adenoma. About 15% of endogenous, Cushing’s syndrome is ACTH-independent, where the cortisol production is autonomous. About 50% of these lesions are probably due to adrenocortical neoplasm, commonly an adenoma, than carcinoma. Hyperaldosteronism, may be suspected of for patients who present with hypokalaemia or persistent hypertension despite conventional therapy. About 60% of primary hyperaldosteronism, is caused by an aldosterone-producing adenoma, which is also called ‘aldosteronoma’, described first by Conn. Forty per cent of cases are idiopathic. Aetiology of sex hormone-producing adenomas is either central or peripheral. Lesions secrete androgens oestrogens, which cause virilization or feminization. It results in sexual precocity, hirsutism, gynecomastia or impotence. Rapid progression of symptoms suggests a neoplastic source of hormones, and ovaries and adrenal glands should be evaluated. Adenomas are usually small, homogeneous, having well-defined margins and measure less than 3 cm. Morphologic features overlap with malignant lesions. Adenomas are characterized by the presence of intracytoplasmic fat. And to differentiate adenomas from malignant lesions, a high level of specificity is recommended. CT densitometry (HU) may be used to distinguish nonadenomatous lesions from adenomas. More than 50% surface area of the lesion needs to be covered by region of interest (ROI) for densitometry. A cut-off value of <10 HU is conventionally used to identify an adenoma on noncontrast-enhanced, CT scan (Figs. 10.16.3.1 and 10.16.3.2). Noncontrast-enhanced CT scan and chemical shift imaging (CSI) have limitations in the evaluation of lipid poor adenoma, which are 30% of total adenomas. Differentiation between lipid-rich and lipid-poor adenomas may be possible in delayed enhancement in CT (HU values). Adenomas de-enhance faster than nonadenomatous lesions. There is delayed and persistent contrast accumulation in malignant adrenal pathology due to increased vascular density and increased permeability due to disorganized angiogenesis. Percentage washout calculation gives reproducible method to evaluate contrast washout and to identify the adrenal lesion. Absolute and relative percentage washout (APW and RPW, respectively) formulae are described in various imaging techniques. For reasonably accurate calculation of washout, noncontrast HU value needs to be included; therefore, if possible, APW should be calculated. APW of >60% and RPW of >40% highly suggests adenoma. If the precontrast-enhanced HU value indicates benignity, then it should supersede the washout characteristics. Lesion with noncontrast enhancement value of ≥43 HU might raise high suspicion for malignancy regardless of washout characteristics. Adenomas appear isointense to hypointense on T1-weighted image, isointense to mildly hyperintense on T2-weighted image demonstrates less enhancement and shows rapid washout than pheochromocytoma or adrenal metastases. CSI with in-phase and opposed-phase gradient-echo sequences so far the best imaging technique, which depend on intracellular lipid content of adenoma (Fig. 10.16.3.3).
10.16: Adrenals
Introduction
Anatomic features
Contrast washout
Sequence Type
Imaging Plane
Section Thickness (mm)
T2-weighted
Axial Coronal
5
T1-weighted gradient-echo in-phase and opposed-phase
Axial Coronal
3
T1-weighted fat-suppressed gradient-echo
Axial
3
Optional sequence: Diffusion-weighted (b values of 50, 500, and 800 s/mm2)
Axial
6
Optional sequence: T1-weighted fat-suppressed gradient-echo dynamic contrast-enhanced
Axial Coronal
3
Techniques and its pitfalls
Artefacts
Image analysis
Embryology
Anatomic anomalies/normal variants
Radiological anatomy
Imaging techniques – protocols
Ultrasound
Computed tomography scan
Adrenal incidentaloma
Adrenal cortex lesions
Adrenal medulla lesions
Other stromal lesion
Metastases
Cysts
Adrenal haemorrhage and haematoma
Infiltrations
Infections and granulomas
Adrenal adenoma
Histology
Nonhyperfunctioning adenomas
Cortisol-producing adenomas
Aldosteronomas and primary hyperaldosteronism
Sex hormone-producing adrenal adenomas
Imaging
Computed tomography findings
Magnetic resonance imaging findings
Related posts:


Stay updated, free articles. Join our Telegram channel

Full access? Get Clinical Tree


