Fig. 2.1
Intravascular ultrasound image of mid-segment of the left anterior descending artery. The top arrow coincides with the top two IVUS images and the lower arrow with the lower two IVUS images. The atherosclerotic plaques are shown in yellow, vessel lumen in red and IVUS catheter in gray. In comparison to the accompanying angiogram, the IVUS images show almost half of the vessel area filled by atherosclerotic plaque. The plaque is not associated with luminal stenosis, because it has expanded the vessel size at the lesion site
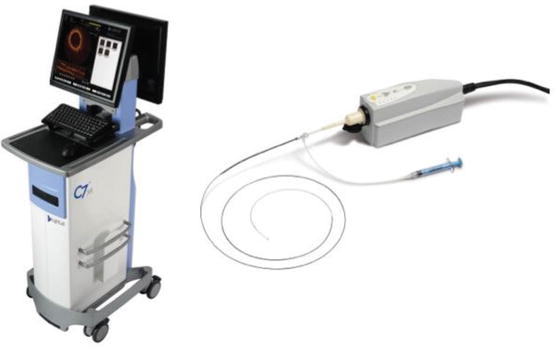
Fig. 2.2
Optical coherence tomography system (C7-XR) showing the image display on the left and the Dragonfly imaging catheter on the right. The Dragonfly catheter has an insertable length of 135 cm with a 2.7 Fr tip and a 0.014 in. wire lumen and is able to produce images at 30 cm/s with a maximal length per run of 54 mm
Information regarding plaque composition is also available with the use of IVUS, as different plaque compositions will reflect ultrasound differently. The characteristic architecture of a thin-cap fibroatheromas (TCFA) overlying a lipid pool has prompted enhancements in IVUS, including backscatter-intravascular ultrasound (BS-IVUS), virtual histology-intravascular ultrasound (VH-IVUS), IVUS elastography, and palpography. Conventional gray-scale angiography is limited in its ability to characterize plaque components. Automatic processing uses the amplitude of the backscattered echo signal to differentiate highly echogenic components (calcium and fibrous tissues) from echolucent ones (lipid and necrotic cores) but it is not able to accurately distinguish between fibrous from fatty plaques [11]. Virtual histology IVUS uses an autoregression model to generate multiple spectral parameters of the backscattered ultrasound signal. These parameters are used in classification of trees to generate a tissue map of the plaque components: fibrous (dark green), fibrofatty (yellow-green), necrotic core (red), and dense calcium (white). The VH-IVUS has been validated in histopathology of autopsy specimens and found to have an accuracy of 79.7, 81.2, and 92.8 % in detecting fibrous, necrotic cores, and calcium, respectively [12, 13]. Backscatter IVUS uses fast Fourier transformation to extract buried frequency components in the original IVUS signal. In autopsy-based studies, the sensitivity of IB-IVUS for calcification, fibrous and lipid-rich plaque was 100 %, 94 %, and 84 %, respectively, which compares favorably with OCT (100 %, 98 %, and 95 %, respectively) and when compared to “VH-IVUS” there is higher diagnostic accuracy with histological assessments [14]. Intravascular elastography and palpography are methods to assess the strain properties of atherosclerotic coronary arteries using tissue characteristics to determine the degree of deformation of vessel walls [15, 16]. Additional information provided by IVUS has improved our understanding in several areas for example gender-specific differences in atherosclerosis. The coronary vessels in women tend to have a smaller lumen and external elastic lamina in comparison to men [17]. Interestingly these vessel dimensions change in heart transplantation when a donor female heart is transplanted into a male recipient suggesting some direct hormonal influence. In addition, the extent of atherosclerotic calcification is higher in men than in women suggesting an earlier onset of atherosclerosis with potentially different pathophysiology to injury [18]. These differences may help to understand differences in outcomes of percutaneous coronary intervention (PCI) in women compared to men. In some situations IVUS provides more precise quantification of plaque morphology over conventional coronary angiography. Coronary angiography provides an imprecise measure of lumen morphology and size especially when there is haziness noted in the vessel [19, 20]. This can be due to the presence of irregular plaque, dissection, thrombus, or calcified plaque. IVUS can help to distinguish between these and can often reclassify “angiographically” normal vessels into those with diffuse disease [21].
IVUS provides visualization of vessel wall which is critical to study of plaque and arterial remodeling. The coronary arteries are living structures that can adapt and change with atherosclerosis. Coronary arteries will initially enlarge over time to accommodate focal plaque deposition in an attempt to preserve luminal integrity. This compensatory enlargement to preserve luminal diameter will not be seen on conventional angiography [22–24].
Clinical Applications of IVUS
Anatomically Ambiguous Lesions
IVUS is useful in characterizing angiographically ambiguous lesions including intermediate lesions, ostial stenosis at branch vessels, sites with dissections, and plaque rupture [25]. However, specific threshold criteria for intervention derived by IVUS have not been prospectively validated with noninvasive assessments of myocardial ischemia. Functional lesion assessment using a coronary pressure wire has been prospectively validated and some studies have provided concordance between IVUS characteristics and functional flow reserve (FFR) of <0.75 [26]. The most consistent IVUS cutoff value for major epicardial coronary arteries (excluding the left main) with moderate correlation with an FFR < 0.75 are minimal luminal area (MLA) in the range of 3–4 mm [2]. Furthermore, an MLA of >4 mm [2] is associated with a good clinical outcome but has a low FFR-based specificity. While a combination of an MLA <1.8 mm and angiographic area stenosis of >70 % has a better sensitivity (100 %) [27]. Taken together, these modalities are synergistic and may lead to a reduction of many unnecessary revascularization procedures for intermediate lesions.
Left Main Lesions
The correlation between IVUS measurements and FFR within the epicardial tree is modest. The left main trunk is uniquely suited given the large vessel size and variable length allows a greater degree of concordance between these two modalities. The MLA of the LMCA on IVUS was a strong predictor of the rate of major adverse cardiac events [28]. Furthermore, several outcome-based studies have addressed the IVUS criteria that correlates with FFR and major adverse cardiovascular events (MACE) but an MLD of 2.8 mm [2] was found to have the highest sensitivity and specificity (93 % and 95 %, respectively) for defining true functional significance of the ULMA stenosis. In the absence of corresponding physiological measurements, IVUS-based criteria of LM compromise have been successfully used to solely guide clinical decision making. While several values have been studied, an MLA of <6 mm [2] has been used as a binary cutoff to defer those who can be managed with revascularization versus medical therapy [29].
Percutaneous Coronary Intervention
The use of IVUS in PCI helps in planning a pre-intervention strategy based on vessel morphology, the presence of calcium, and the burden of thrombus in the vessel and is supported by the American Heart Association (ACC/AHA) PCI guidelines [30]. Adequacy of stent deployment can be very effectively studied with IVUS. Several IVUS characteristics have been associated with increased adverse events after PCI with bare-metal stents (BMS), including smaller minimal stent area (MSA), stent underexpansion, persistent edge dissections, incomplete stent apposition (ISA), and incomplete lesion coverage [31–36]. Smaller MSA has been most commonly associated with target vessel failure at follow-up with rates of restenosis reduced by 19 % per 1 mm [2] increase in MSA [37]. The main clinical benefit of an IVUS-guided BMS PCI strategy is driven by a reduction in restenosis rate and target vessel revascularization (TLR) [38].
There is increasing evidence for utility of an IVUS-directed approach in drug-eluting stenting (DES) [39]. Most of the evidence is however retrospective. Although the randomized trials including HOME-DES (Long-Term Health Outcome and Mortality Evaluation After Invasive Coronary Treatment Using Drug-Eluting Stents with or without IVUS Guidance) and AVIO (Angiography versus IVUS Optimization) did not demonstrate lower rates of TLR or improved clinical outcomes, IVUS provides important clinical information in many patients to justify its widespread use [40, 41]. There is some evidence for benefit with IVUS-directed DES placement with a reduction in the incidence of stent thrombosis [42], detection of high-grade edge dissections [43] and stent underexpansion [44]. IVUS may also have a role in the treatment of long lesions (>20 mm) which was studied in the TULIP study when at 12 months the use of IVUS guidance was associated with a significant reduction in angiographic restenosis (23 % versus 45 %) and TLR (10 % versus 23 %) [45]. In unprotected left main PCI, the adverse effects of suboptimal stenting are more dramatic and in this subset IVUS guidance is of particular use. This was studied in the MAIN-COMPARE (Revascularization for Unprotected Left Main Coronary Artery Stenosis: Comparison between Percutaneous Coronary Angioplasty Versus Surgical Revascularization) trial. In this analysis, there was a trend toward lower 3-year mortality in the IVUS-guided strategy versus angiography alone group (6.0 % versus 13 % P = 0.0063) and this was significant in the subgroup receiving DES (4.7 % versus 16 %, P = 0.048) [40]. IVUS is also advocated by the ACC/AHA PCI guidelines in assisting in the treatment of in-stent restenosis (ISR) [30]. In these cases, IVUS can assist in differentiating between restenosis due to intimal hyperplasia versus that due to mechanical complications such as strut fracture or stent underexpansion.
Allograft Coronary Vasculopathy
Since the intimal and medial layers of the arterial wall have differing acoustical densities, IVUS can distinguish these layers and thereby detect abnormal thickening of the intima. IVUS detects intimal thickening in more than 80 % of patients as early as one year after transplantation. The most rapid rate of intimal thickening occurs in the first year after transplantation, followed by a slower rate of thickening. This process is diffuse and circumferential, many patients with moderate to severe intimal thickening on IVUS. These changes are not detectable on coronary angiography. The proximal segments of the transplanted coronary arteries have focal and eccentric pattern (similar to that seen in native coronary arteries) while the mid and distal segments of the vessels have diffuse and circumferential disease. This suggests at least two etiologies for the vascular lesions: proximal disease that may be donor-transmitted; and distal disease that may be the result of acquired immune-mediated vessel injury exacerbated by significant metabolic perturbations that occur after transplant. The only possible way to distinguish between donor-transmitted disease and de novo allograft vasculopathy is by performing serial IVUS studies starting with a baseline imaging early after transplant. The identification of allograft vasculopathy has prognostic importance. It has been noted that the absence of angiographic coronary disease was a significant predictor of survival without adverse cardiac events at 2 years [46]. Worsening global TIMI frame count (the mean TIMI FC for the three coronary arteries) from baseline to one year was associated with increased mortality rate during mean 4.3-year follow-up [47–51]. Abnormalities detected by IVUS are predictive of cardiac events and death. In a multicenter study of 125 patients, the change in maximal intimal thickness (MIT) from baseline to 1 year was compared at several matched sites in the same coronary artery. An increase in MIT of ≥0.5 mm was present in 24 patients (19 %). At 5-year follow-up, these 24 patients had more frequent death or graft loss (20.8 versus 5.9 % in those with an MIT increase <0.5 mm) [46]. Similar findings were noted in a series of 143 patients in which MIT on IVUS was measured at baseline and 1 year; rapidly progressive vasculopathy was again defined as an increase in MIT of ≥0.5 mm [50]. Rapid progression by IVUS was noted in 54 patients (37 %) at 1 year after transplant. At 5.9-year follow-up, patients with rapid progression at 1 year had significantly higher rates of mortality (26 versus 11 % in those with an MIT increase of less than 0.5 mm), the combined endpoint of death or myocardial infarction (51 versus 16 %), as well as angiographic disease (22 and 2 %).
These data have led to use of IVUS as a surrogate endpoint in clinical trials of new immunosuppressive and other agents known to affect intimal proliferation. Given the cost, small risk and the time-consuming nature of the procedure. The ISHLT consensus statement recommends against use as routine surveillance outside of clinical trials [52]. In addition to its value in research, IVUS may be of clinical value in selected patients in identifying the cause of unexplained graft failure (i.e., in the absence of rejection) patients with normal coronary arteriography.
Preventative Strategies on Coronary Artery Atherosclerotic Plaque Dimensions and Composition
Coronary artery disease continues to be the most common cause of mortality and morbidity worldwide and preventative strategies only reduce cardiovascular risk by 30–40 %. Germane to further reduction in cardiovascular risk are therapies directed at prevention of atherosclerotic disease. As described above, IVUS is able to detect the contours of the leading edge of the lumen and the media–adventitia interface and so permits direct measurements of the lumen and the total vessel cross-sectional area and absolute and percent plaque volume. While the relationship between low-density lipoprotein (LDL) cholesterol levels and coronary atherosclerosis was established in postmortem studies. The linear relationship between the LDL cholesterol levels and the atheroma plaque progression was first noted using IVUS [53, 54]. There have now been many studies that have studied the progression or regression of coronary atherosclerosis using IVUS. The REVERSAL (Reversal of Atherosclerosis with Aggressive Lipid Lowering) trial tested in a prospective, randomized manner the effect of 18 months of intensive versus moderate intensity lipid-lowering therapy on coronary artery plaque progression [55]. The intensive lipid-lowering arm reduced the LDL cholesterol levels to 78 mg/dL and stopped progression of atherosclerosis. The ASTERIOD (Study to Evaluate the Effect of Rosuvastatin on Intravascular Ultrasound-Derived Coronary Atheroma Burden) trial extended this observation by showing regression of atherosclerotic plaque volume with the use of high-intensity statin therapy [56]. Besides statins, other novel agents including inhibitors of acyl-coenzyme-A cholesterol acyltransferase (ACAT) and cholesterol ester transfer protein have been studied and these have shown no change in coronary plaque progression [57, 58].
Optical Coherence Tomography
OCT is a light-based imaging modality that generated high-resolution cross-sectional image of tissue microstructure [59]. Thus, the principle of OCT is similar to the use of ultrasound in IVUS. In essence, by measurement of the time delay of the optical echoes obtained due to reflection or backscatter from biological tissues, structural information as a function of depth can be obtained.
OCT light is in the near-infrared (NIR) range with wavelengths in the 1.3 μm. Both the bandwidth of the infrared light used and the wave velocity are orders of magnitude higher than in medical ultrasound. Like IVUS, the OCT image quality is dependent on the spatial resolution (distance between two points that are detectable by the imaging modality). This is measured as the degree of axial (line parallel to the light beam) or lateral resolution (perpendicular to the light beam) and is dependent on the spectral wavelength. Near the tip of the catheter, light is focused and directed at the vessel wall and as such the lateral resolution is best at its area. The resulting resolution is one order of magnitude larger than that of IVUS: the axial resolution of OCT is about 15 μm; the lateral resolution is approximately 25 μm seen in Fig. 2.1 and Table 2.1. However, the imaging depth of approximately 1.0–1.5 mm within the coronary artery wall is less than that of IVUS.
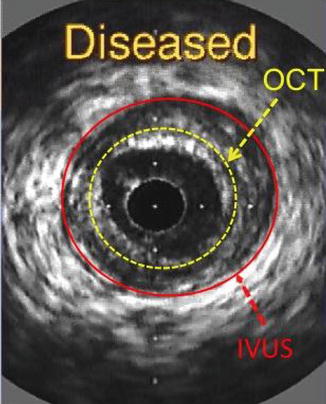

Fig. 2.3
Intravascular ultrasound (IVUS) cross-sectional image of a coronary arterial wall showing the imaging depth obtained by both modalities. OCT optical coherence tomography
Table 2.1
A comparison of FD-OCT and IVUS
Variables | IVUS | FD-OCT |
|---|---|---|
Wavelength | 1.3μ | 20–40 MHz |
Resolution | 12–15 μm (axial) | 35–80 μm |
20–40 μm (lateral) | 100–200 μm (axial) | |
200–300 μm (lateral) | ||
Frame rate | 100 frames/s | 30 frames/s |
Pullback rate | 20 mm/s | 0.5–1 mm/s |
Max. scan diameter | 9.7 mm | 15 mm |
Tissue penetration | 1.0–2.5 mm | 10 mm |
OCT measures the time delay of light reflected or backscattered from tissue using interferometry. Light from the OCT system is split into a sample (going to the patient) and reference (going to a predetermined reference distance) segment. When light is reflected back from tissue, it is collected by the catheter, and combined. The distances between the sample and reference light transferred and detected generates a pattern of high and low intensities known as interference. The OCT system is able to interpret this pattern and determine the degree of backscatter in relation to depth. When the optics are rotated in the catheter around a 360° plane, the result is a cross-sectional image of the vessel wall.
There are two types of OCT systems: earlier time-domain OCT (TD-OCT) and recent Fourier-domain OCT (FD-OCT). In the FD-OCT system, the depth profile can be constructed by the Fourier transform. Most signals can be thought of as a summation of sine waves with different frequencies. The Fourier transform extracts those frequencies, and their relative weights, from the signal. The source wavelength in Fourier-domain OCT can be swept at a much higher rate than the position scan of the reference arm mirror in a time-domain OCT system. This development has led to faster image acquisition speeds, with greater penetration depth, without loss of vital detail or resolution, and represents a great advancement on current conventional OCT systems [60]. Coronary arteries can be imaged with high OCT catheter pullback speeds within seconds, which allows for widespread clinical use in a broad range of patients and lesions.
Optical Coherence Tomography: Imaging Catheters and Imaging Procedures
OCT imaging catheters have an imaging core at the distal tip that is oriented at 90° to the length of the catheter as shown in Fig. 2.2. When these catheters are rotated along the long axis of the vessel a cross-sectional view of the coronary artery is obtained allowing the user to get a high-resolution image of the coronary artery. When performing an intracoronary OCT, the imaging catheter (2.7 Fr) is introduced over a guidewire (0.014 in.) into the distal coronary artery. A motorized pullback is performed to scan the coronary artery segment. The pullback speed is typically 20 mm/s with a frame rate of 100 frames per second or higher. Since blood scatters the OCT signal, it is temporarily cleared by an injection of X-ray contrast medium during the duration of the OCT pullback (typical flush rate 3.0 mL/s). A variety of solutions, warmed to 37 °C have been used alternatively as flush medium, including Lactated Ringer’s, viscous iso-osmolar contrast media, and mixtures of lactated Ringer’s and contrast media or low molecular weight dextrose. The time needed to image a 50 mm artery segment is typically 3 s with a total volume of X-ray contrast of 10–12 ml, which is comparable to the amount of X-ray contrast needed for a single angiographic run.
Like IVUS, current practice requires that patients be anticoagulated, typically with heparin, before insertion of the guidewire into the coronary artery. The image acquisition should be performed only after the administration of intracoronary nitroglycerin. In patients with severe left ventricular dysfunction, single remaining coronary vessel, renal dysfunction, and compromised hemodynamics, OCT should be performed with caution. In lesions with coexisting rich collateral blood flow or when coaxial positioning of the guiding catheter is not feasible, OCT imaging can be difficult due to the inability of blood clearance. In these cases, wire-based OCT can be used with a proximal balloon occlusion to facilitate blood clearance. If there are near complete stenosis or complete total occlusions of vessels, then OCT cannot be performed until there is antegrade restoration of blood flow.
OCT is a safe procedure with little applied energy (output power 5–8 mW) and is not thought to cause any functional or structural damage to tissue. The principle safety considerations relate to the possible induction of ischemia due to the need of blood displacement for image acquisition. This was more so with the TD-OCT systems where there was transient T-wave inversion or ST segment depression in 44–46 %, 1.1 % incidence of ventricular fibrillation, and 0.2 % risk of vessel dissection. Current OCT systems allow for very fast data within a few seconds and therefore are unlikely to lead to significant ischemia. In preliminary registries of patients imaged with FD-OCT, the most frequent event was transient T-wave inversion or ST segment depression (10 %) but there were no complications within a 24-h period [61, 62].
Components of the OCT Image
The normal vessel wall is characterized by layered architecture, comprising highly backscattered (signal-rich) intima (appears bright), followed by low backscattered (signal-poor media) and then heterogeneous but highly backscattered (signal-rich) adventitia as shown in Fig. 2.4. Light is highly reflected by the elastic membranes and this serves to distinguish between the three concentric layers with the innermost signal-rich layer reflects the internal elastic membrane and the outer, signal-rich layer representing the external elastic lamina. It must be noted that the normal three-layer appearance by OCT is not synonymous to the three-layer appearance by IVUS. IVUS cannot visualize the architecture of a normal coronary vessel due to its resolution of 120 μm while OCT is able to do so (resolution of 10 μm) as seen in Fig. 2.1.
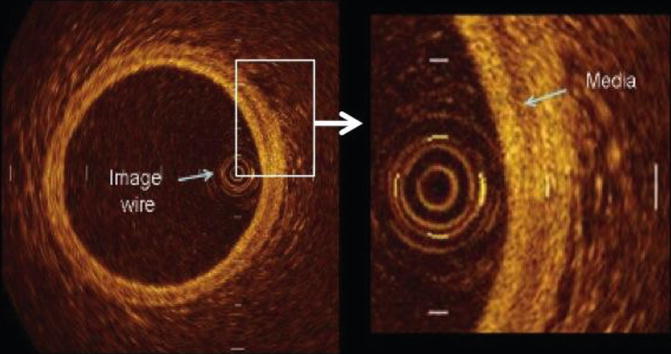

Fig. 2.4
Optical coherence tomographic image of a normal coronary artery showing the cross-sectional anatomy. The normal vessel wall is characterized by layered architecture, comprising highly backscattered (signal-rich) intima (appears bright), followed by low backscattered (signal-poor media) and then heterogeneous but highly backscattered (signal-rich) adventitia
IVUS and OCT images are fundamentally different from histology. However, owing to the high, 10 μm resolution of OCT, images do appear similar to histological sections. There may be some capacity to detect and quantify specific contents of vessel walls analogous to histological features. Caution must be used as not all features can be identified and the extent to which OCT can describe pathology is still unknown.
Qualitative Description of Atherosclerosis
As various components of atherosclerotic plaques have different optical properties, OCT makes it possible to differentiate between them. The identification of plaque components by OCT depends on the degree of vessel wall penetration by the incident light beam. The depth of penetration is highest in fibrous tissues but least in thrombi with calcium and lipid tissue having intermediate values. There are distinct morphological characteristics that have been found when assessing atherosclerotic plaque.
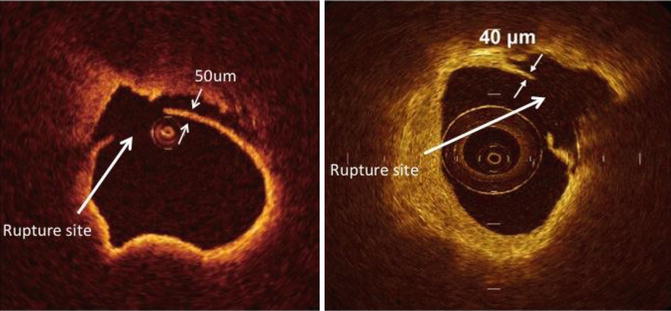
TCFA is a delineated necrotic core with an overlying fibrous cap where the minimal thickness of the fibrous cap is less than 65 μm (defined by histology) shown in Fig. 2.5. Thin fibrous cap atheromas are considered the most important morphologic substrate for a plaque at high risk to rupture and causing acute coronary syndrome. OCT allows the diagnosis of thin fibrous cap atheroma with a sensitivity of 90 % and a specificity of 79 % when compared to histopathology and for accurate measurement of the fibrous cap thickness with low variability [63]. Ongoing research suggests that the ability of OCT to measure changes in the fibrous cap thickness could be used to monitor the effect of therapeutic agents aiming at plaque stabilization although this is still extremely controversial.
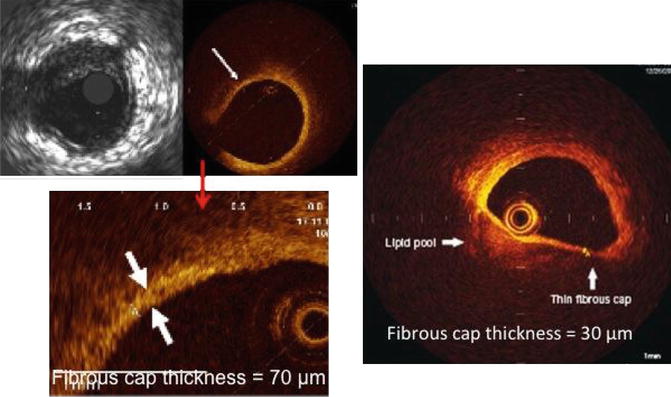
Fig. 2.5
Optical coherence tomographic images showing precise measurement of the fibrous cap thickness. The OCT image on the right shows a fibrous cap thickness of <65 μm with a large lipid pool and is called a thin-cap fibroatheroma (TCFA)
Atherosclerotic plaque (atheroma), which is a mass lesion (focal thickening) or loss of the layer structure of the vessel wall.
Fibrous plaques have high backscattering with relatively homogenous signal due to the rich collagen or smooth muscle cells present in Fig. 2.6. Calcifications within plaques are identified by the presence of well delineated, low backscattering, signal-poor heterogeneous regions.

