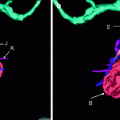
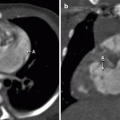
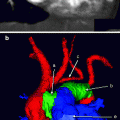
Fig. 3.1
End-systolic (a) and end-diastolic (b) volume of the right ventricle. Evaluation of the data is provided in Table 3.1

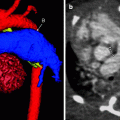
Fig. 3.2
End-systolic (a) and end-diastolic (b) volume of the left ventricle. Evaluation of the data is provided in Table 3.1
Table 3.1
Functional cardiac CTA calculations
RV and LV parameters | Gross volume, mL | BSA, m 2 | Gross volume ÷ BSA = volume index, mL/m 2 | Normal volume index range, mL/m 2a | Ejection fraction, % (range, %) |
|---|---|---|---|---|---|
RV end-systolic | 7.2 | 0.2 | 36 | 19–30 | – |
RV end-diastolic | 14.5 | 0.2 | 72.5 | 62–88 | – |
RV stroke volume | 7.2 | – | – | No normal indexed values | – |
RV | – | – | – | – | 49.9 (40–60) |
LV end-systolic | 6.0 | 0.2 | 30 | 17–37 | – |
LV end-diastolic | 12.2 | 0.2 | 61 | 50–84 | – |
LV stroke volume | 6.2 | 0.2 | 31 | 30–65 | – |
LV | – | –
Stay updated, free articles. Join our Telegram channel
Full access? Get Clinical Tree
 Get Clinical Tree app for offline access

|

