4 AUTOMATED ANALYSIS OF CORONARY ANGIOGRAMS*
Departments of Electrical and Computer Engineering, and Radiology The University of Iowa, Iowa City, IA 52242, USA
4.1. INTRODUCTION
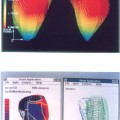
Each year about 1.5 million people in the United States with coronary artery disease suffer myocardial infarction.1 The death rate from coronary artery disease is in excess of 500,000 per year. In the 35 years since 1959 when Sones introduced selective catheterization of the coronary arteries, coronary angiography has achieved a preeminent position in the armamentarium of the physician caring for the cardiac patient.2 Assessment of coronary arterial geometry is central to the diagnosis of coronary artery disease, to decisions about pharmacological therapy or coronary artery revascularization with transluminal coronary angioplasty or coronary artery bypass surgery,3 to judgments about the short and long-term outcome of revascularization procedures, and to assessment of patient prognosis. Although a variety of cardiac imaging techniques are under active development, selective coronary arteriography is the only method capable of accurately depicting the details of coronary anatomy2 (Figure 1). Accordingly, coronary angiography has maintained a pivotal role in the evaluation and treatment of patients with coronary disease4 and hundreds of thousands of coronary angiograms are performed every year in the United States.
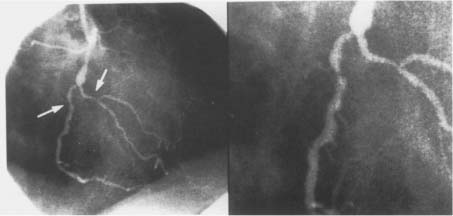
Figure 1. Coronary angiograms, (left) Angiogram of the coronary tree. Stenotic vessel is depicted by arrow, (right) Stenotic vessel segment, magnified.
The vast majority of these angiograms are interpreted visually. Visual assessment of the severity of coronary disease is associated with very substantial inter- and intra-observer variability.5–7 Moreover, visual interpretation of coronary angiograms does not allow accurate assessment of the physiological significance of coronary obstructions.8 The shortcomings of visual analysis have prompted leading clinical investigators to call for the use of quantitative coronary angiography for assessing coronary obstruction severity in routine patient care.3,9–12 A very substantial amount of research has been directed at the development of semi-automated and automated methods for defining coronary arterial borders and calculating indices of lesion severity and physiologic significance.13–25 As a result, automated approaches were developed to identify vessel borders and calculate indices of stenosis severity from coronary angiograms. Automated coronary border detection has become a standard component of experimental studies evaluating diagnostic approaches to detecting coronary disease,26 assessing the efficacy of surgical, mechanical and pharmacological interventional therapeutic procedures,4,27 and studying the progression and regression of coronary atherosclerosis.28–30 To date, automated border detection methods have seen limited application in routine clinical care and most patient management decisions are based on visual estimates of percent diameter stenosis.11 Factors that have contributed to the limited acceptance of automated methods include the need for specialized equipment and software, the time-consuming nature of some methods, and problems in reliably detecting vessel borders.
Despite the widely recognized limitations of visual assessment of lesion severity, most patient management decisions continue to be based on visual assessment of percent diameter stenosis.3,11 An important reason for the poor clinical acceptance of quantitative coronary angiography is its limited reliability in clinical use. Current automated methods for identifying vessel borders from coronary angiograms often fail to accurately identify vessel borders, particularly when applied to the routine analysis of clinical angiograms. The presence of poor contrast, branching vessels, and overlapping or adjacent structures near the vessel segment of interest all present difficulties for automated methods.
4.2. APPROACHES TO ANALYSIS OF CORONARY ANGIOGRAMS
Assessment of coronary obstruction severity by visual estimation of percent diameter stenosis from angiograms suffers from poor inter- and intra-observer reproducibility.5–7 The limited reproducibility of visual assessment is a particular concern in the evaluation of risk factor modifications and pharmacologic and mechanical interventions where accurate estimates of stenosis regression or progression are required. Visual estimates also demonstrate systematic errors with visual estimates of percent diameter stenosis being larger than quantitative estimates by as much as 30 percentage points.31 Visual interpretation significantly overestimates lesion severity before angioplasty and underestimates stenosis severity after angioplasty.32 These systematic errors cannot be attributed to the experience of the observer.32 The widely recognized shortcomings of visual evaluation of coronary angiograms have led to substantial research directed at development of automated methods to assess coronary artery geometry.33
4.2.1. Videodensitometric Approaches
Automated methods for evaluation of coronary lesion severity can be divided into geometric13–25 and videodensitometric approaches. Videodensitometric approaches are based on the density of contrast material in the vessel lumen and allow estimation of lumen cross-sectional area from a single angiographic view.19, 34–38 Importantly, these approaches do not depend on assumptions about the cross-sectional shape of the vessel and do not require precise definition of the vessel borders.39 Thus, videodensitometric approaches should in theory be of particular value following percutaneous transluminal angioplasty when indistinct borders and irregularly shaped and eccentric stenoses are common.40–42 In practice, videodensitometric approaches are limited by numerous sources of error. These include beam hardening, scatter, veiling glare, vessel foreshortening, contributions from background, and incomplete mixing of contrast.28,43,44 As a result, reproducibility of videodensitometric methods may be less than that for geometric methods45 and estimates of lumen area obtained in multiple views may not agree.46 Perhaps accordingly, more research has been directed at the development of automated border detection methods than on videodensitometric methods. It is of course possible and even advantageous to combine border detection and videodensitometric approaches.16,19,41,47
Conventional geometric approaches to evaluation of coronary geometry are based on automated detection of individual coronary borders and on using data from two or more angiographic projections to reconstruct a three-dimensional representation of coronary lesion size and shape. An example of this latter approach is the Brown-Dodge method of quantitative coronary arteriography.13 This method has been widely used and extensively validated13,48–50 and it was employed as an independent standard in many later studies. A great variety of methods for automated detection of coronary borders have been introduced.13–25,51 In general, these methods detect coronary borders by identifying image pixels with large gradients. Such edge detection is typically a local process in that the position of the detected edge depends largely on local image characteristics. Although this approach works well in high-quality images, it ignores global information that is very useful in detecting local border position in images of intermediate or poor quality. Reiber et al. were the first to report a coronary border detection technique that identified a border that in a global sense was optimal.15 Computer identification of optimal coronary borders is typically based on 2-D graph searching principles.20 An optimal border can be defined as the border that in an overall sense had the greatest likelihood of corresponding to the actual coronary border. Parker and associates have developed a method based on dynamic programming that also identifies an optimal border.52 Related approaches that are not restricted to defining the coronary border as a sequence of points, one per profile, have been reported.22,53,54
Although the anatomical characteristics of a coronary obstruction are of interest to the clinician, it is the physiological consequences of the obstruction that are important in arriving at decisions with respect to patient management. Minimal lumen diameters derived from automatically-identified coronary borders have been used to assess obstruction severity.18–20,55 This approach is motivated by the fact that the minimal dimension of a stenosis is the single most important factor in determining the hemodynamic consequence of an obstruction.28 Nonetheless, such methods fail to take into account important stenosis characteristics (normal area, stenotic area, length of lesion, entrance and exit angles) that can have functional consequences. An excellent example of an automated method that incorporates all of the vessel dimensions and predicts coronary flow reserve is that reported by Kirkeeide et al.16 This method combines automated border detection and videodensitometry together with fluid dynamic principles to provide a single integrated functional measure of lesion severity.56
4.3. RELIABILITY OF QUANTITATIVE CORONARY ANGIOGRAPHY
The substantial research on quantitative coronary angiography has been motivated by two factors. The first is the extremely important role that assessment of coronary arterial geometry plays in the diagnosis and treatment of cardiovascular disease. With the dramatic expansion of interventional procedures for treating coronary disease in the catheterization laboratory, the need for reliable and readily available measures of lumen geometry has become ever more pressing.4 Unfortunately, the standard deviation in visual estimation of percent stenosis is about 18% and a major disagreement occurs between readers in about 31% of vessels.7 Illustrative of the poor reproducibility of visual analysis is the finding in the Coronary Artery Surgery Study that when one angiographer reported a stenosis of 50% diameter narrowing or more in the left main coronary artery, a second angiographer reported no lesion in 19% of cases.57 Moreover, visual assessments are often inaccurate as demonstrated by comparisons with post-mortem anatomy.58 Lesions with greater than 50% narrowing are overestimated by 15% to 30% diameter stenosis units.3,4,32 Lesions below 50% narrowing tend to be underestimated. This leads to very substantial overestimation of the improvement in lumen diameter resulting from angioplasty.32 Gould calls attention to the 189% error in assessing the average benefit of coronary angioplasty that results from inaccurate visual assessment of pre- and post-angioplasty percent stenosis.10 Finally, visual estimates of percent diameter stenosis correlate poorly with direct measures of the physiologic significance of coronary obstructions.8
As a result of the shortcomings of visual analysis of coronary angiograms, use of quantitative coronary angiography in scientific studies and clinical trials has become the accepted standard. However, quantitative coronary angiography has not achieved widespread acceptance or use in routine patient care.3,11 There are several explanations for the lack of acceptance of quantitative coronary angiography methods. Some methods are time consuming and require specialized equipment and/or expertise. This is a serious obstacle to routine clinical use since ease and speed of use are essential in a clinical setting.4 No consensus has developed as to the best analysis algorithms.4,33 Only a few border detection methods have been carefully validated in vivo by comparison to independent geometric and physiologic standards.16,19,20,59 While automated border detection methods yield excellent results in investigational settings when applied to high quality images of vessel segments free of vessel overlap and other confounding variables, they often fail when applied to unselected vessel segments in a clinical setting. The limited reliability of quantitative coronary angiography methods in the clinical setting has severely impeded the routine use of these techniques.
Gurley et al. recently examined the suitability of quantitative coronary angiography for routine clinical use.60 They analyzed 38 stenoses in digital angiograms from 25 consecutive patients using a commercially available analysis system.61 Only definite lesions, defined as vessel segments visually determined by four independent observers to have lumen diameter reductions exceeding 50%, were analyzed. Quantitative coronary angiography successfully traced 20 stenoses but failed in 18/38 stenoses or 48%. The failures were attributed to stenosis at a bifurcation (72%), diffuse disease with no normal reference segment (44%), excessive vessel tortuosity or overlap (22%), and poor image contrast or under penetration (28%). Gurley et al. concluded that quantitative coronary angiography is unsuitable for routine clinical use and that a practical method of objectively assessing stenosis severity in the clinical setting remains to be developed.61 Although details as to what constituted an analysis failure were not given and their results may not generalize to other quantitative coronary angiography techniques, clearly the reservations about quantitative coronary angiography expressed by these authors are shared by many clinicians. The critical need for robust quantitative coronary angiography methods and the substantial failure rate of current border detection methods form the impetus for development of robust knowledge-based approaches to coronary border detection.
4.4. BORDER DETECTION AS GRAPH SEARCHING
Graph searching is a standard technique of image segmentation and is particularly useful if borders of thin elongated objects like vessels are to be detected.62 For graph construction, the edge image is resampled perpendicular to the vessel centerline to “straighten” the artery. The centerline becomes a straight line and the graph consists of a rectangular grid of nodes corresponding to pixels in the straightened image. A profile is defined as a set of nodes perpendicular to the straightened centerline. A cost is associated with each node that is inversely related to the edge strength of the corresponding pixel. A path through the graph connecting pixels at one end of the vessel (start nodes) to pixels at the other end (end nodes) corresponds to a possible coronary border. The graph searching technique determines the minimum cost path or optimal border. The cost function f(xi) for a path containing a particular node xi on the profile i typically consists of two components; an estimate  (xi) of the minimum cost partial path between a starting node x1 and xi, and an estimate
  (xi) of the minimum cost partial path between xi and an end node xE. The cost
  (xi) is the sum of costs associated with the nodes that are on the path. If the estimate
  (xi) is not considered (i.e.,
  (xi) = 0), no heuristic is included in the algorithm and a uniform-cost search is done (standard graph searching method). Although a uniform cost search guarantees that the optimal border (i.e., minimum cost path) will be found, a large number of paths must be examined.
One way to increase the search efficiency is to avoid examining paths that are far (in terms of cost) from the path that is ultimately determined to be optimal. If the cost of the minimum cost node on each profile is subtracted from the cost of each node on the profile, search efficiency is improved. We refer to this approach as the lower bound method. In effect, this shifts the range of costs associated with nodes on a given profile from

to

where c(k, i) is the cost of the k-th node on the i-th profile and cLB (k, i) is the new lower bound cost of the node. It can be shown that the borders detected using the lower bound and conventional methods are exactly the same.
Additional increases in search efficiency can be achieved if  (xi) > 0. The minimum cost path identification can be guaranteed only if
  (xi) ≤ h(xi), where h(xi) is the actual cost of the minimum cost partial path from xi to xN. The closer the estimate
  (xi) is to h(xi), the greater the efficiency of the search. The problem is that h(xi) is not known beforehand. Should
  (xi) exceed h(хi), detection of the optimal border is not guaranteed but search efficiency will be high since the search can be stopped before the optimum is found. Further details on heuristic graph searching image segmentation techniques are available in62.
Dynamic programming represents another approach to optimal graph searching and is based on the principle of optimality.63–65 It searches for optima of functions in which not all variables are simultaneously interrelated. The main idea of the principle of optimality is: whatever the path to the node N was, there exists an optimal path between N and the end_point. In other words, if the optimal path start_point – end_point goes through N then both its parts start_point – N and N – end_point are also optimal.
It has been shown that heuristic search may be more efficient than dynamic programming for finding a path between two nodes in a graph.66 Further, heuristic graph search does not require explicit definition of the graph. However, dynamic programming presents an efficient way of simultaneous search for optimal paths from multiple starting and ending points. If these points are not known, dynamic programming is probably a better choice. Nevertheless, which approach is more efficient for a particular problem depends on evaluation functions and on the quality of heuristics for heuristic graph search. A comparison between dynamic programming and heuristic search efficiency can be found in67.
4.5. CONVENTIONAL CORONARY BORDER DETECTION
Tremendous investigative effort has been devoted to the development of automated methods for evaluating coronary artery anatomy. Coronary border detection approaches traditionally consist of a number of steps:
1. observer identification of the vessel segment of interest;
2. application of an edge operator to derive an edge image;
3. geometric warping of the edge image;
4. construction of a directed graph and optimal border identification; and
5. mapping of the detected borders back into the original image space and calculation of a diameter function.
Many conventional geometric methods presented in Section 4.2.2 follow the above processing strategy. The method introduced in20 can be considered a typical representative of such conventional methods. Below, we describe the approach to border detection reported by Fleagle et al.
4.5.1. Image Preprocessing
Following digitization of an optically magnified cine frame into an 8-bit 512 × 512 image matrix (resolution in object plane of about 60 μm/pixel), the centerline of the vessel segment of interest is interactively defined by an observer. The observer also enters two points, one on either side of the vessel, which together with the vessel centerline define the image region of interest within which the vessel segment is located. The defined centerline only approximates the actual vessel centerline and is heavily smoothed.
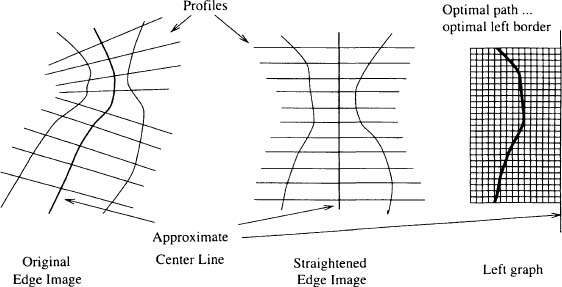
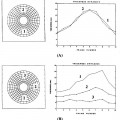
Figure 2. Illustration of the geometric warping applied to the edge image. The edge image is resampled along profile lines perpendicular to the vessel centerline in the original image space so as to produce a straightened artery in the resampled space. A two-dimensional graph is constructed from each half-plane of the straightened edge image.
A two-dimensional edge operator is then applied to the digitized image to produce an edge image (Figure 3a). The utilized edge operator is a weighted combination of a Sobel operator and a Marr-Hildreth operator. The Sobel operator uses an 11 × 11 mask and approximates the first derivative of image intensity. The Marr-Hildreth operator uses a 21 × 21 mask and approximates the second derivative of image intensity. It is reasonably well accepted that a combination of first and second derivative edge operators produces an accurate estimate of coronary edge position.24,28,43 In20, the mask sizes and relative weights were determined empirically from phantom studies.
For computational convenience, the edge image is resampled (on a square grid with one-pixel spacing and using interpolation) along profiles perpendicular to the centerline to “straighten” the artery (Figure 2). The straightened edge image is smoothed in the direction parallel to the vessel centerline.
4.5.2. Identification of Individual Borders
As described in Section 4.4, heuristic graph search is used to identify optimal coronary borders. A directed graph is constructed from the straightened edge image. A node in the directed graph corresponds to a pixel in the warped edge image. The cost associated with a node is inversely related to the edge strength of the corresponding pixel (i.e., cost is defined to be the difference between the maximum pixel value in the warped edge image and the value of each pixel). The links are defined so as to connect a node on one row of the directed graph to one of the three closest nodes on the next row. Thus, all paths through the graph contain one and only one node derived from each of the profile lines in the vessel segment of interest. This link definition ensures that all detected coronary borders are continuous in the warped image space. The node with lowest cost in the first row (greatest edge strength on perpendicular profile at proximal end of vessel segment of interest) is defined as the initial start node. The other nodes from the first row are also included as possible start nodes. The nodes on the last row of the graph are defined as goal nodes. Using these definitions for start and goal nodes, the path is not restricted to start or finish at any particular points, but is required to start and finish at the proximal and distal ends of the vessel segment of interest. Each path through the graph corresponds to a possible coronary border. The path with minimum cost is defined as corresponding to the optimal coronary border. For each vessel segment of interest, two independent searches are performed, one for the left border and one for the right border.
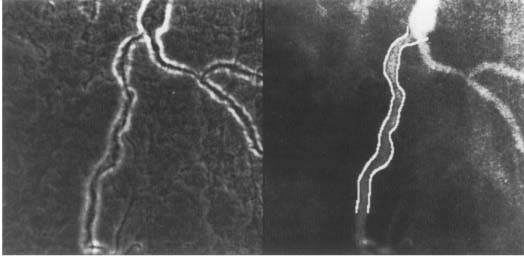
Figure 3. Conventional coronary border detection, (left) Edge image — a weighted combination of a Sobel operator and a Marr-Hildreth operator was used as an edge operator. See Figure 1 for the original angiogram, (right) Coronary borders identified using the conventional method superimposed over the original image.
4.5.3. Diameter Function Calculation
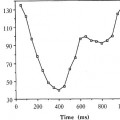
After the optimal borders are identified in the straightened image space, the detected borders are mapped back into the original image space and smoothed. A diameter function depicting serial diameters along the length of the vessel is calculated and expressed in units of mm by reference to a catheter of known size. The minimal lumen diameter and the location of the minimum are automatically determined from the diameter function.
In the conventional coronary border detection method described above, coronary borders are determined using the conventional method for coronary border detection based on two-dimensional graph searching principles. This method is conventional in that it identifies the left and right coronary borders separately.
Although the method20 was demonstrated to yield accurate borders by comparison to independent geometric (Brown-Dodge quantitative coronary arteriography) and physiological (intracoronary measures of coronary vasodilator reserve) standards and the accuracy of the method was similar in good images and in images with poor contrast or high levels of noise, experience with conventional automated methods, including those available commercially, suggests that even the most robust conventional techniques often fail to identify acceptable borders. The failure rate is especially high when these methods are routinely applied to unselected images in a clinical setting. Images with poor contrast, high noise, branching vessels, or nearby or overlapping structures present particular problems for automated techniques. Conventional automated methods for coronary border detection fail in part because they identify the left and right borders independently. Clearly, there is information contained in the position of one border that might be useful in identifying the position of the other border.
4.6. SIMULTANEOUS CORONARY BORDER DETECTION
While all existing conventional border detection algorithms independently identify the left and right coronary borders, the main principle of the simultaneous border detection is that it takes into consideration mutual relationships between borders.68–71 As a result, the left and right borders are interrelated in agreement with physical reality. The developed strategy corresponds well with human approach to border detection. The basic steps in the simultaneous border detection algorithm are:
1. image preprocessing;
2. three-dimensional graph construction;
3. cost function calculation;
4. multi-stage identification of the optimal border pair; and
5. calculation of a diameter function.
Steps 1 and 5 are identical to those described in Section 4.5.
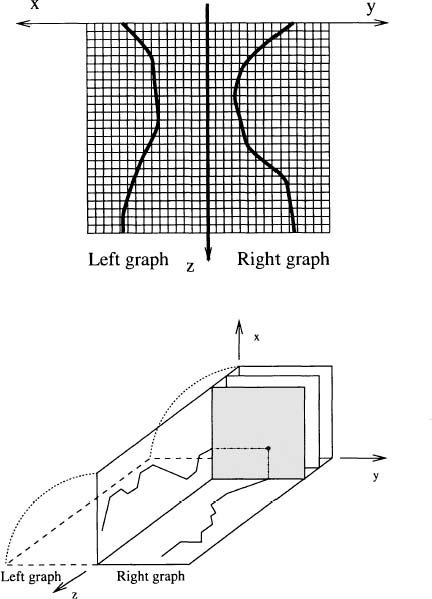
Figure 4
Related posts:
Stay updated, free articles. Join our Telegram channel

Full access? Get Clinical Tree


