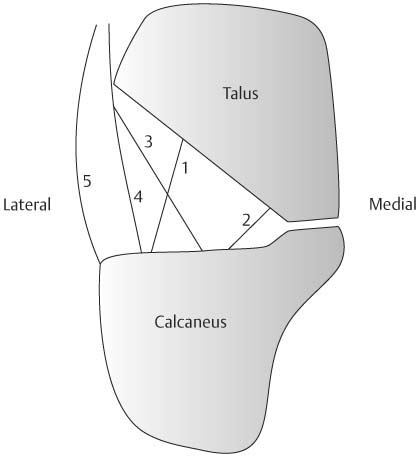
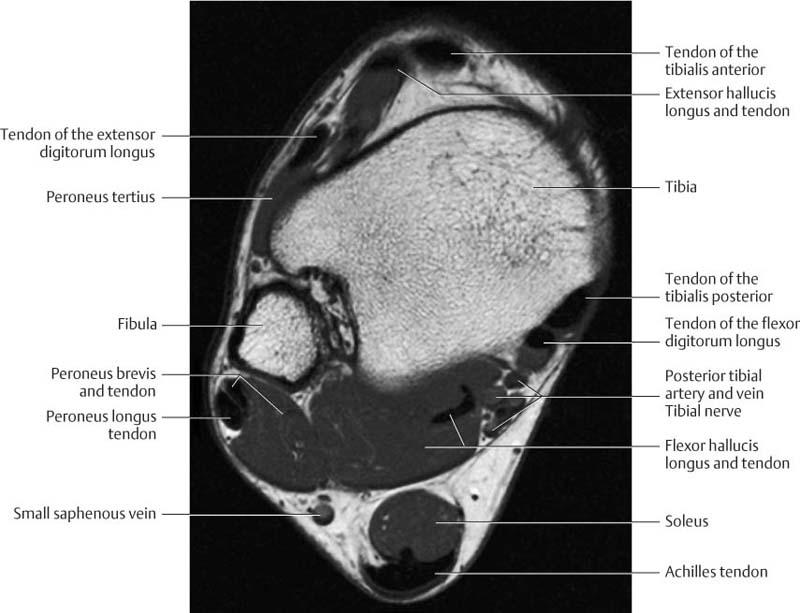
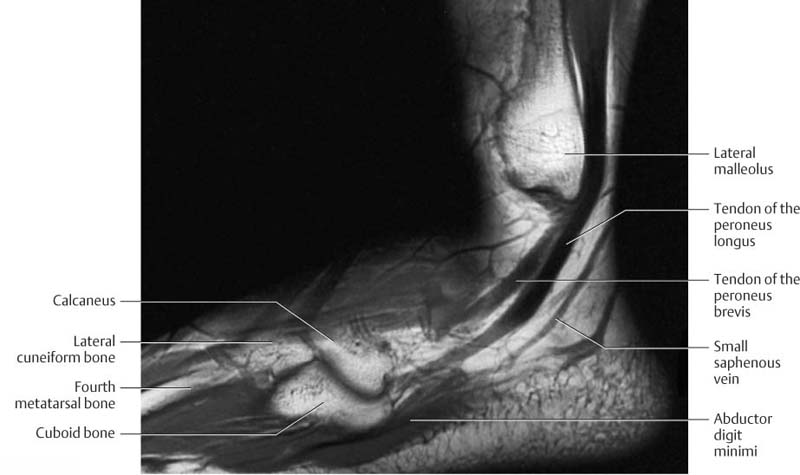
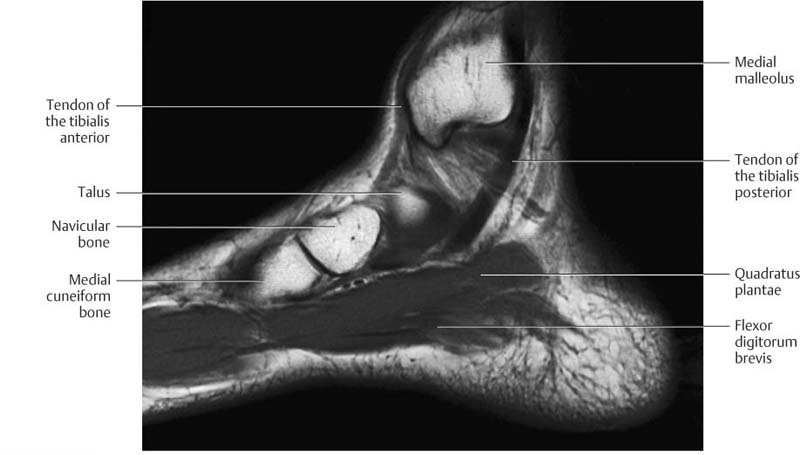
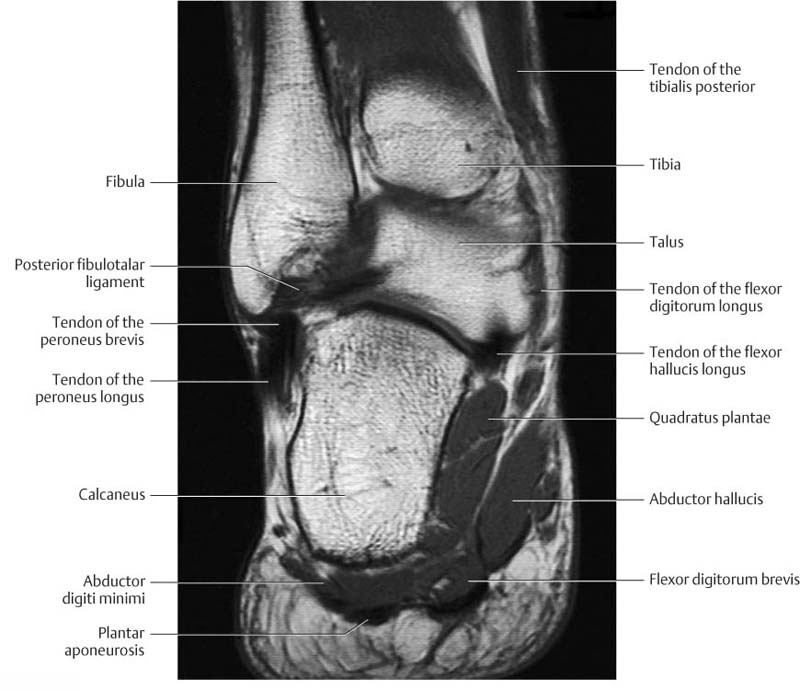
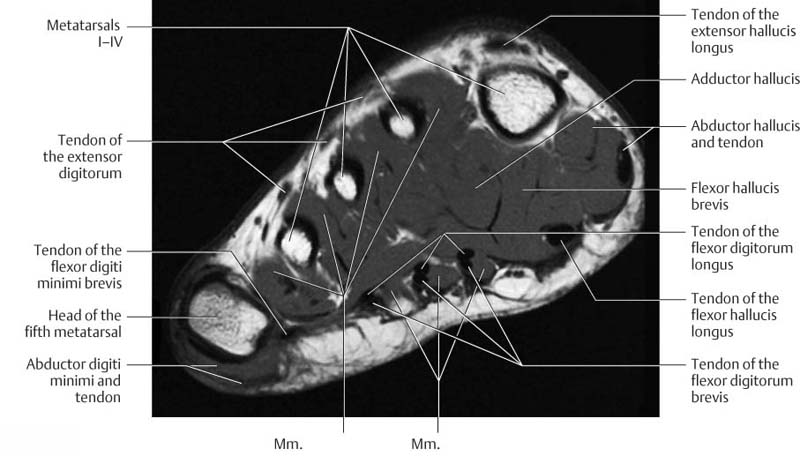
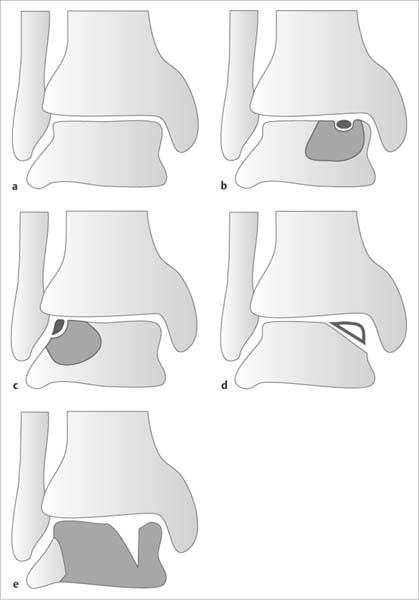
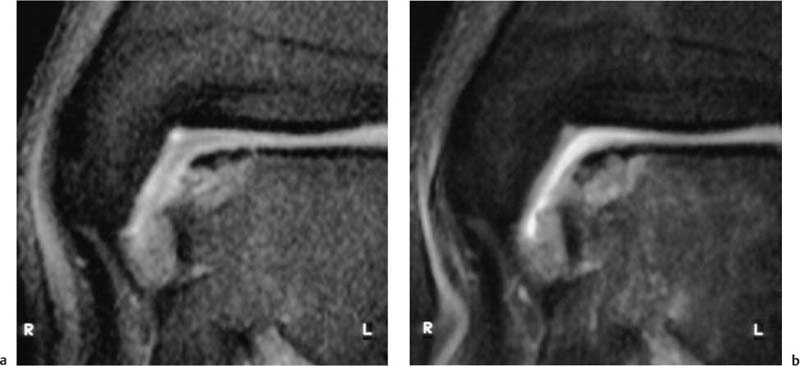
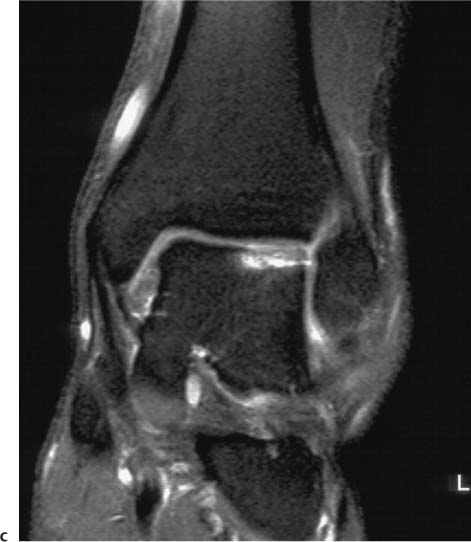
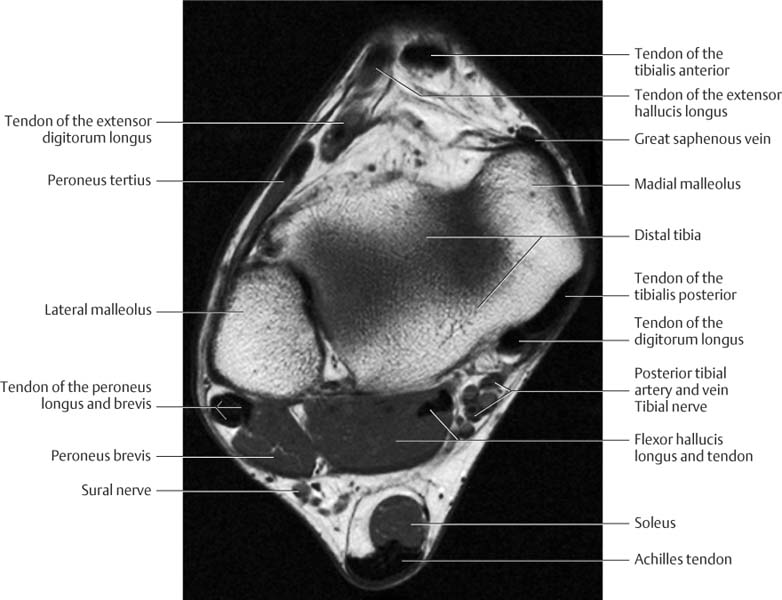
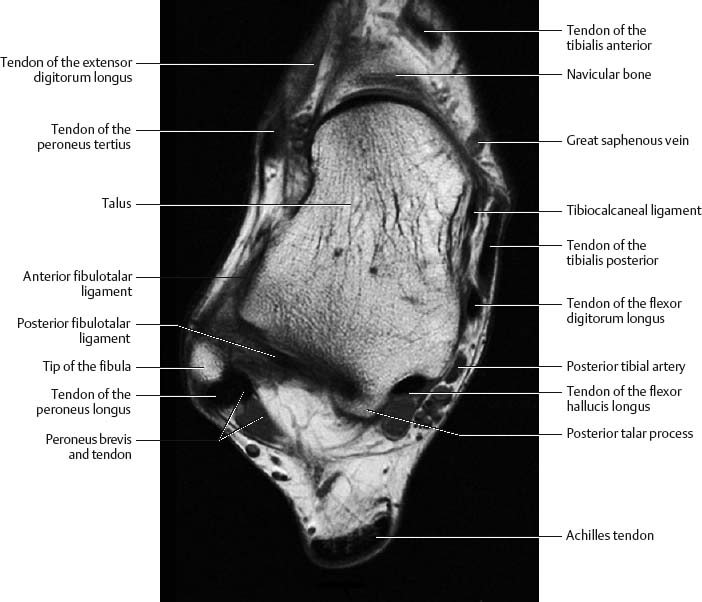
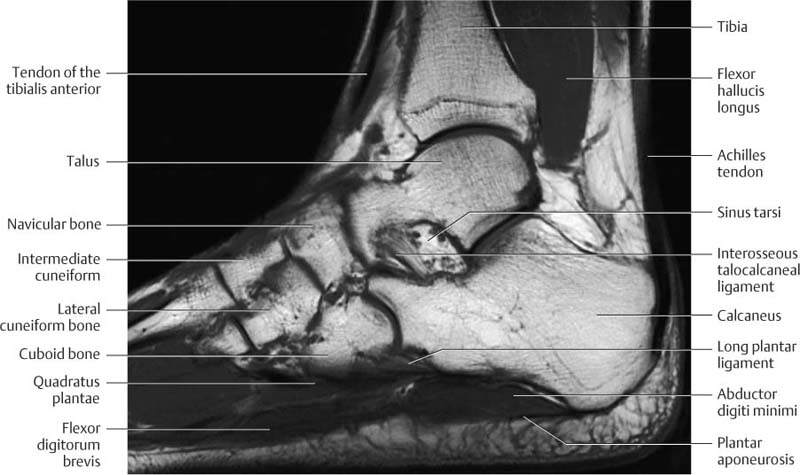
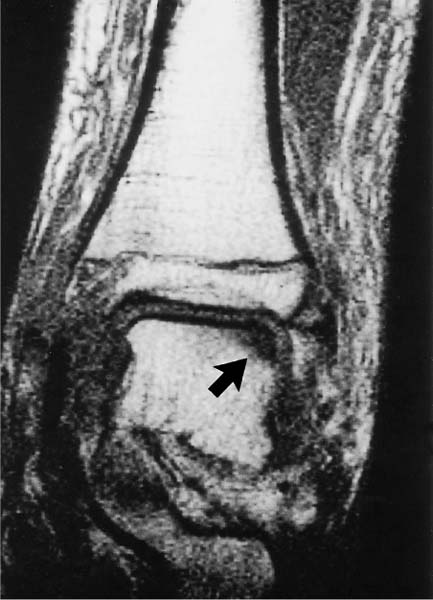
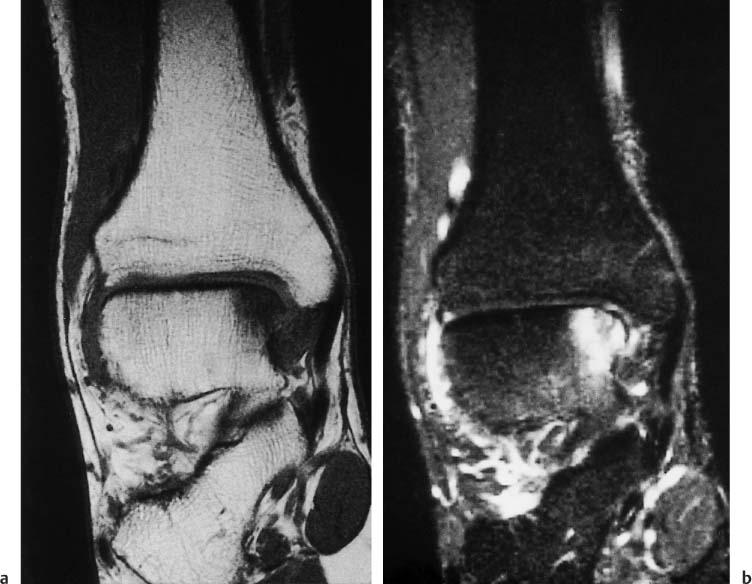
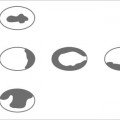
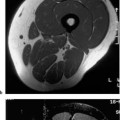
8 Ankle and Foot With many osseous elements and a complex arrangement of active and passive stabilizers, ankle and foot constitute an anatomically complex unit, accommodating the various movements of standing, walking, and running. Apart from the knee, the ankle is the joint most frequently subjected to trauma. Often, however, the ankle becomes symptomatic without the patient recalling any trauma. Both chronic and acute complaints are often only inadequately localized and diagnosed clinically. Since MRI achieves an exquisite visualization of both osseous and cartilaginous structures, it has become an indispensable diagnostic method. The patient is examined supine in the foot first position. The foot should be placed in a neutral position or in slight plantar flexion, with the feet held in this position by sandbags and straps. For visualization of the ligaments of the ankle, positioning in extreme dorsal or lateral position can be advantageous. To achieve an adequate signal for the required resolution, the examination should be conducted with an extremity coil (knee coil). If a comparison of both sides is required, the two ankles can be examined together with a head coil. To visualize the toes, a flexible surface coil can be used. The examination of the ankle should begin with an axial T2-weighted SE sequence by virtue of its high anatomic resolution, followed by axial, sagittal and coronal SE, TSE and GRE sequences. It is helpful to obtain images in at least one plane using a STIR technique. Such a protocol will detect most pathologic changes. Sometimes, the protocol must be modified to accommodate specific questions and diagnostic presumptions. Specific angulations are employed to visualize ligamentous structures. The field of view (FOV) is characteristically between 120 and 160 mm2 with a section thickness of 3–4 mm. Recommendations for the remaining technical parameters are found in the table in the Appendix. The forefoot and toes are generally examined in the axial and sagittal planes. In contrast to the examination of the ankle, a thinner section thickness of 3 mm and a smaller field of view of 80–100 mm should be used. For unclear bone and soft tissue processes and for the delineation of inflammatory changes, the use of IV Gd-based contrast medium might be necessary. After administration of contrast medium, fat saturated T1- weighted images can be obtained in addition to T1- weighted SE sequences. For the examination of the ligamentous structures, sequences with acquisition of a three-dimensional data set can be used to reconstruct images in any plane. Because of the lower resolution and the inferior image contrast of these reconstructed images, additional SE sequences cannot be abandoned where a definitive assessment of the ligaments is needed. The reconstructed images benefit the evaluation of the ligamentous connections and the exact geometric planning of the SE sequences. Fibula, tibia, and talus constitute the ankle or talocrural joint. The fibula and tibia form the ankle mortise, which is stabilized by the taut anterior and posterior tibiofibular ligaments, also referred to as the tibiofibular syndesmosis. The joint capsule inserts into the anterior tibia about 10 mm proximal to the joint space and at the mid portion of the talar neck. Elsewhere, it inserts near the bone–cartilage junction. Along its medial plantar surface, the talus has a deep sulcus, the sulcus tali, which forms the roof of a fat-containing space, the sinus tarsi. Laterally, the sinus tarsi is bordered by the inferior extensor retinaculum (Figs. 8.1 and 8.25). The medial collateral ligament (also known as the deltoid ligament) is divided into four fibrous cords that arise at the tip of the medial malleolus and extend to the navicular tuberosity and by way of the talar neck and sustentaculum tali to the posterior talar process. Fig. 8.1 Schematic drawing of the ligaments in the sinus tarsi. Coronal section (after Klein and Spreitzer). 1 = cervical ligaments 2 = interosseous talocalcaneal ligaments 3 = medial fascicle of the inferior extensor retinaculum 4 = intermediate fascicle of the inferior extensor retinaculum 5 = lateral fascicle of the inferior extensor retinaculum The lateral collateral ligament complex consists of three ligaments: the anterior fibulotalar ligament, the posterior fibulotalar ligament, and the fibulocalcaneal ligament. The anterior fibulotalar ligament arises at the anterior circumference of the tip of the fibular malleolus and inserts into the lateroanterior aspect of the talar neck. In dorsiflexion, it assumes an almost transverse course. This ligament is frequently divided, resists the anterior translation of the talus and, especially in plantar flexion, any varus deviation. The posterior fibulotalar ligament originates at the posterior inner margin of the fibula and extends horizontally to the posterior talar process where it inserts at the lateral tubercle. The fibulocalcaneal ligament arises near the tip of the lateral malleolus medially and runs obliquely to the lateral surface of the calcaneus. It is extra-articular and separated from the joint capsule by a fatty layer. Its primary function is to resist supination. The anterior extensor group of the lower leg constitutes, in mediolateral direction, tibialis anterior, extensor hallucis longus, and extensor digitorum longus. The tendon of the tibialis anterior inserts into the plantar surface of the first metatarsal base and medial cuneiform. The tendon of the extensor hallucis longus inserts into the proximal and distal phalangeal bases of the first toe, while the extensor digitorum longus inserts by means of four digital expansion into the middle and distal phalanges of the second to fifth toes. The lateral extensor group consists of the peroneus longus and brevis. The tendons of both muscles pass behind the lateral malleolus in a common synovial sheath and are held in place by the superior perioneal retinaculum. The peroneus longus forms a sling under the foot inserting into the tuberosity of the first metatarsal base and the intermediate cuneiform. The peroneus brevis inserts at the tuberosity of the fifth metatarsal base. The superficial flexor group constitutes the triceps, comprised of three muscles, the gastrocnemius, soleus, and the variably developed plantaris. Gastrocnemius and soleus have a common tendon, the Achilles tendon, which inserts at the posterior calcaneal tuberosity. The deep flexor group includes, medial to lateral, the flexor digitorum longus, tibialis posterior, and flexor hallucis longus. In the distal third of the lower leg, the flexor digitorum longus crosses the tibialis posterior tendon, placing the latter in the most anteromedial position. Between the medial malleolus and the calcaneus, obliquely oriented fibers in the crural fascia cover and restrain the tendons (flexor retinaculum). The tarsal tunnel is bordered by the tip of the medial malleolus, the medial surface of the talus and calcaneus, and the flexor retinaculum. In the anteroposterior direction, the posterior tibialis tendon, flexor digitorum longus tendon, posterior tibial vessels, and, most posterior, the flexor hallucis longus tendon pass through the tarsal tunnel (Fig. 8.33). The extensor digitorum brevis and extensor hallucis brevis arise on the dorsum of the foot. In the inter-osseous spaces between the metatarsals, the dorsal interossei are found dorsally and the plantar interossei inferiorly. The plantar muscles form three lengthwise groups, which are incompletely separated by connective tissue septa. The medial group comprises the abductor hallucis, adductor hallucis, and flexor hallucis longus, the intermediate group the flexor digitorum longus, flexor hallucis longus, flexor digitorum brevis, quadratus plantae and lumbricals, and the lateral group the abductor digiti minimi, flexor digiti minimi brevis, and opponens digiti minimi. The subtalar joint is formed by the talus, calcaneus, and navicular. Anatomically, it consists of two completely distinct joint cavities separated by a joint capsule and the interosseous talocalcaneal ligament. In the posterior joint cavity, the posterior calcaneal articular surface of the talus articulates with the posterior talar articular surface of the calcaneus, forming the talocalcaneal articulation. In the anterior joint cavity, the spherical articulating surface of the talar head and neck articulates with the articulating surface of the calcaneus and navicular, forming the talocalcaneonavicular articulation. The long plantar ligament runs in the superficial plantar layers. It arises from the plantar surface of the calcaneus and extends to the second to fourth metatarsal bases across the insertion of the tendon of the peroneus longus. Talocrural and subtalar articulations: Proximal to the talocrural joint, the transverse sections show, medial to lateral, the tendons of the tibialis anterior, extensor hallucis longus, extensor digitorum longus, and peroneus tertius. The tendons of the tibialis posterior, flexor digitorum longus, and flexor hallucis longus are seen in the posterior compartment, from medial to lateral. The order of the tendons can be easily recalled easily, using the mnemonic Tom, Dick, and Harry (tibialis posterior, flexor digitorum longus, and flexor hallucis longus). The strongest of all tendons, the transverse ovoid Achilles tendon, is most posterior. Its posterior border is characteristically convex and its anterior border flattened. The muscle and tendon of the peroneus brevis and, posterolateral to it, the tendon of the peroneus longus pass as the lateral muscle group behind the lateral malleolus. The anterior neurovascular bundle (anterior tibial artery and vein, deep peroneal nerve) descends posteriorly to the extensor tendons, while the posterior neurovascular bundle (posterior tibial artery and vein, tibial nerve) is seen as low signal intensity structures anteromedially to the flexor hallucis longus on the T2- weighted image. The sural nerve is demarcated as a low signal intensity structure within the high signal fatty tissue posterior to the peroneal tendons. Aside from the forementioned muscles, tendons, vessels, and nerves, the transverse sections at the level of the inferior tip of the lateral malleolus show segments of the deltoid ligament (the medial ligament comprising tibionavicular, anterior tibiotalar, and tibiocalcaneal ligaments). The posterior fibulotalar ligament can be delineated along its entire course as a low-signal structure, while the anterior fibulotalar and fibulocalcaneal ligaments are only visualized in segments. Visualizing their entire course requires the foot to be repositioned or different section planes. Transverse sections through the foot at the level of the metatarsals delineate the extensor tendons as low-signal structures within the high-signal fatty tissue posterior to the bones. The interossei can be seen between the metatarsals, while the muscle bellies and the tendons of the abductor digiti minimi and flexor digiti minima are visualized lateral to the fifth metatarsal. Abductor hallucis, flexor hallucis brevis, tendon of the flexor hallucis longus, adductor hallucis, and tendon of the flexor digitorum longus are seen, medial to lateral, in the sole of the foot. Figs. 8.2–8.10 Axial ((8.2–(8.4), sagittal ((8.5–(8.7), and coronal ((8.8–(8.10) MRI sections illustrating the normal anatomy. Fig. 8.3 Talocrural and subtalar articulations: The sagittal sections delineate the longitudinal course of the long muscles of the foot. They also offer a comprehensive overview of the osseous structures that form the talocrural and subtalar articulations and are especially suitable for assessing articular surfaces including articular cartilage. The medial sagittal sections show the tibialis posterior and flexor digitorum longus tendons, which pass behind the medial malleolus. The flexor hallucis longus runs along the posterior surface of the talus and below the sustentaculum tali of the calcaneus in the sulcus tali. On the plantar aspect, its tendon crosses under the flexor digitorum longus, sending fibrous slips to it that terminate at the distal phalanx of the second and third toes (rarely to the fourth toe). The quadratus plantae muscle is seen on the plantar aspect of the foot arising from the plantar surface of the calcaneus and inserting along the flexor digitorum longus tendons distally. The midsagittal sections are especially suitable for visualizing the articular surfaces of the talocrural and subtalar articulations. In both joints, the articular cartilage is delineated as a linear zone of intermediate signal intensity on the T1-weighted image. The subtalar articulation can be divided into an anterior and a posterior compartment, separated by the sinus tarsi. The sinus tarsi is almost completely filled by the interosseous talocalcaneal ligament, which is embedded in high-signal fatty tissue. The transected muscle and tendon of the flexor hallucis longus are seen posterior to the tibia. The fat pad of the Achilles tendon and Achilles tendon itself are located immediately behind these structures. On the dorsum of the foot, the tibialis anterior tendon is visualized. Sagittal sections through the distal fibula primarily visualize the longitudinal course of the peroneal tendons. The peroneus brevis tendon is located anterior to the peroneus longus tendon and continues distally to the fifth metatarsal base. The tendon of the posteriorly located peroneus longus leaves the section plane early, at the level of the lateral border of the calcaneus, and runs medially to the medial and intermediate cuneiforms. Fig. 8.4 Fig. 8.5 Fig. 8.6 Fig. 8.7 Talocrural and subtalar articulations: Coronal sections through the posterior aspect of the tibia and fibula show segments of the tibialis posterior tendon and flexor digitalis longus medial to the tibia. The flexor hallucis longus is located medial to the partially transected talus. Portions of the quadratus plantae are visualized medial to the calcaneus. The peroneal tendons are recognized as low-signal structures below the tip of the lateral malleolus. Like the sagittal sections, the midcoronal sections allow evaluation of the talar and tibial articular surfaces and the articular cartilage. The strong posterior tibiotalar ligament is seen as low-signal structure between the medial malleolus and the medial surface of the talus. The sinus tarsi appears in the subtalar joint space, with its high-signal fat pad and sections of the interosseous talocalcaneal ligament (Fig. 8.30). The cross-section of the flexor hallucis longus tendon is identified under the sustentaculum tali. The abductor hallucis is the most medial muscle in the sole of the foot. The superficial flexor digitorum brevis and the underlying quadratus plantae are part of the intermediate muscle group. The abductor digiti minimi is in the lateral aspect of the sole. Fig. 8.8 Fig. 8.9 Fig. 8.10 The talus is a common site of spontaneous or post-traumatic osteonecroses. Spontaneous osteonecrosis, osteochondritis dissecans, is usually located medially while post-traumatic osteonecrosis is frequently observed after lateral avulsion fractures. The lack of edema distinguishes an old avulsed fragment or accessory ossicle from an acute fracture or osteochondritis dissecans. Fractures and dislocations of the talus with injuries to the nutrient vessels can cause a partial or total necrosis of the talus, which shows as demineralization on conventional radiographs, following immobilization, and extensive regional or total bone marrow edema on MRI (Fig. 8.11). MRI is an excellent method for the early detection of osteochondral lesions of the talar articular surface. Traumatic osteochondral injuries are generally preceded by a severe supination injury. The lateral talar margin fractures with dorsiflexion and the medial talar margin with plantar flexion (Fig. 8.12). Osteochondritis dissecans is a disease of young patients, characteristically between the ages of 20 and 40 years. This condition constitutes an avascular necrosis at the medial aspect of the talar trochlea. Its cause is not clearly known, although vascular impairment and microtrauma are frequently discussed as possible causes. The disease can be bilateral. Fig. 8.11 a–e Avascular necrosis. Diagrammatic drawing of osteochondritis dissecans as seen in the coronal plane.a Normal findings.b Osteochondritis dissecans, characteristic location in the medial posterior third of the talar trochlea, illustrating an advanced stage. Osteochondral fragment in the crater. Surrounding perifocal edema.c Necrotic fragment, not dislodged, after relative recent trauma with a flake fracture typically located at the lateral talar trochlea, with localized perifocal edema.d Osseous fragments of the medial talar trochlea with signal intensities equal to that of bone marrow fat and without perifocal edema, representing S/P old undisplaced fracture or accessory osseous elements.e Extensive signal changes throughout the talus or in large areas within the talus as manifestation of total or partial talar necrosis following severed vessels in the sinus tarsi or tarsal tunnel caused by fractures or dislocations. The talar body is more frequently involved than the talar neck. Fig. 8.12 Osteochondral trauma of the lateral aspect of the talar trochlea, concurrent with a fracture of the medial malleolus. Subchondral decrease in signal intensity on the coronal T1-weighted section (TR = 520 ms, TE = 20 msec) in the region of the lateral talus with intact cortex (arrow), perifocal edema with diffuse decrease in signal intensity (bone bruise). Marked decrease in signal intensity also in the region of the medial malleolus. Sagittal and coronal sections should be selected when evaluating the talar articular surface. Osseous defects and integrity of the cartilaginous cover can be assessed on these sections. Fat suppressed imaging has been found useful for evaluating the cartilage (Fig. 8.13). Direct MR arthrography following intra-articular injection of contrast medium can demonstrate the extension of contrast medium from the joint space into the osseous crater. Indirect MR arthrography following intravenous injection of contrast medium and exercising of the joint also delivers contrast medium to the osseous crater. With this method, however, granulation tissue around the fragments can produce a high signal intensity and this should not be interpreted as extension of contrast medium into the cartilage defect. In our experience, the signal intensity of the enhancing granulation tissue is less than the intensity of the joint space after an adequate interval following intravenous injection (Fig. 8.13) (see Chapter 1). Fig. 8.13 a–c Osteochondritis dissecans.a Fat suppressed SE image (TR = 600 msec, TE = 18 msec), coronal section. Magnification. Integrity of the cartilage can be seen.b The indirect MRI arthrography shows no extension of contrast medium into the crater. The granulation tissue around the fragments shows faint enhancement only.c Indirect MR arthrography of another patient. Very high signal intensity in the osseous crater, comparable to the intra-articular signal intensity in the lateral joint space. This finding is to be interpreted as a disrupted cartilage with extension of contrast medium from the joint capsule into the osseous crater. Fig. 8.14 a, b Osteochondrosis dissecans, grade 1.a Coronal T1-weighted (TR = 520 msec, TE = 20 msec) sections shows a decreased signal intensity in the subchondral bone in the region of the medial corner of the talar trochlea.b The STIR sequence (TR = 4800 msec, TE = 60 msec, T1 = 150 msec) shows a high signal intensity of the subchondral osseous defect and reactive edema in the adjacent bone marrow. Degenerative osteoarthritis. Nelson and co-workers (19) developed an MR classification that parallels the arthroscopic grading system and distinguishes four grades: • Subchondral lesions of grade 1 show an intact cartilage on MRI. The osseous defect generally presents as low signal intensity on the T1-weighted image. On the T2-weighted image, it can have a low (sclerosis) or high (blood, joint fluid) signal intensity. A reactive bone marrow edema is frequently seen in the osseous neighborhood. It has a high signal intensity, which is best seen on STIR sequences (Fig. 8.14). • The grade 2 osteochondral lesion is demarcated from the surrounding bone by a junctional zone, which can represent a reactive sclerosis or hypervascular connective tissue and consequently is of variable signal intensity. While the sclerosis is of low signal intensity on all sequences, hypervascular connective tissue shows high signal intensity on T2-weighted images, which can make it difficult to distinguish it from fluid (Figs. 8.15 a, b
Introduction
Examination Technique
 Patient Positioning
 Coil Selection
 Sequences and Parameters
 Special Examination Technique
Anatomy
 General Anatomy
 Specific MR Anatomy
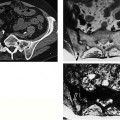
Transverse Plane (Figs. 8.2–8.4)
Foot
Sagittal Plane (Figs. 8.5–8.7)
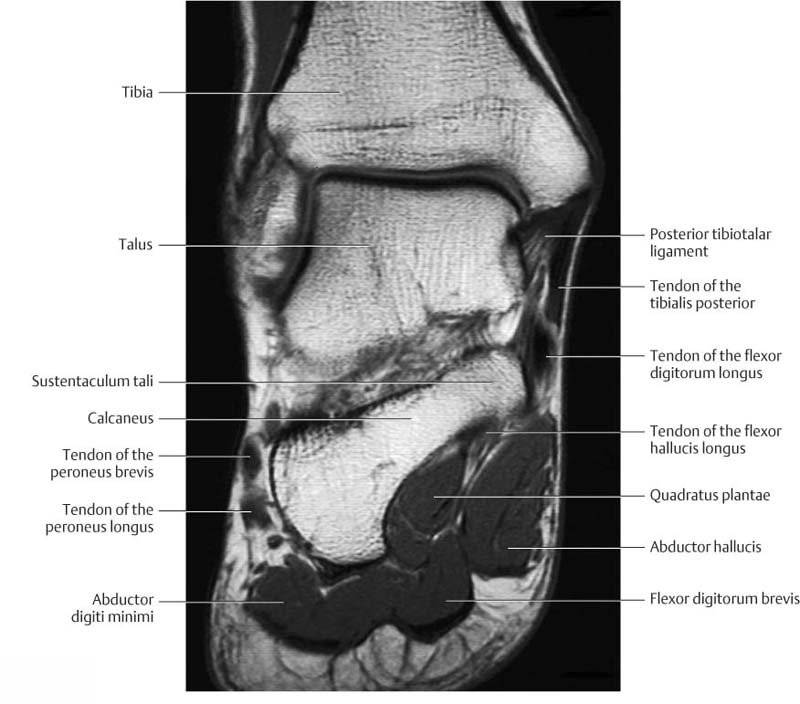
Coronal Plane (Figs. 8.8–8.10)
Disorders of the Bone
 Osteochondral Injuries and Osteochondritis Dissecans
![]()
Stay updated, free articles. Join our Telegram channel


Full access? Get Clinical Tree


