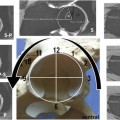
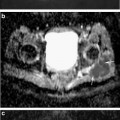
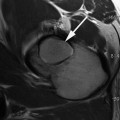
Fig. 16.1
Radiographs (top panel), MRI with indirect arthrography (bottom left panel), and dGEMRIC scan (bottom right panel) of hip with mixed impingement. No evidence of joint space narrowing seen on radiograph but a rim fracture is noted. On the morphologic MRI scan, there is labral chondral degeneration. The dGEMRIC scan shows fairly extensive acetabular cartilage damage as indicated by dark red and black regions in the acetabular cartilage. The femoral head cartilage is intact (color code: white—T1 1,200 ms, black—T1 200 ms)
Contrast Administration and Timing of Imaging in Clinical Studies
Technical issues regarding optimization of the dGEMRIC technique for human clinical application have been investigated and reviewed [8, 9]. The dGEMRIC effect depends on the use of a charged gadolinium contrast agent. A non-ionic contrast agent will not be able differentiate between disease and normal tissue. Additionally, the relaxivity of the contrast agent will influence the change in T1, hence, when the dGEMRIC scans are quantitated the amount and type of contrast agent used will be critical. The most commonly used contrast agent for the dGEMRIC technique is Magnevist (Bayer Heathcare). Even though the contrast agent Magnevist has been approved for clinical use as an MRI contrast agent, the dGEMRIC technique itself is an off-label application. The recommended dose for dGEMRIC studies is 0.2 mM/kg or twice the recommended clinical dose but this should be corrected for body mass index [10] due to the fact that plasma levels of Gd-DTPA(2-) was 1.4 times higher in subjects with BMI of 45 compared to subjects with BMI of 20. Some authors have advocated using a triple dose to improve sensitivity to small changes in GAG [11]. However, due to the risk of contrast reaction [12], most clinical studies are performed using double dose contrast injection.
The “delay” refers to the time that is required for the contrast agent to diffuse into the cartilage after an intravenous (IV) injection. In femoral knee cartilage, T1Gd was found to be relatively stable at 90–120 min postinjection, which has been the recommended window for dGEMRIC imaging of the knee [8, 11]. In the hip joint, early data indicated no difference in signal intensity in T1-weighted images between 30 and 90 min postinjection [8], and a time point of 30 min postinjection has been used for some hip dGEMRIC studies [13, 14]. Most recent study evaluating the optimal window for hip dGEMRIC imaging in asymptomatic individuals and patients with early hip osteoarthritis (OA) due to dysplasia shows that the wash-in of Gd-DTPA(2-) into healthy hip cartilage is similar to previously determined kinetics in femoral knee cartilage, with a maximum concentration at approximately 90–120 min [11, 15]. However, diseased cartilage had faster wash-in kinetics (Fig. 16.2). The results indicate that imaging at earlier time points (30–65 min) increases the sensitivity to disease, but may decrease the reproducibility due to imaging during the slope of wash-in.
Fig. 16.2
The dGEMRIC index (mean ± sd) at four times (min ± sd) after intravenous injection of double dose Magnevist. The dGEMRIC index was 20–30 % lower in the patients with early OA compared to healthy volunteers (P < 0.003) at all time points, with largest difference at the earlier time points due to faster wash-in of the contrast in the OA cartilage. However, earlier time point in the OA subjects showed a higher SD, possibly due to variability of contrast penetration slope during this wash-in period (Magn Reson Med. 2007 Apr;57(4):803–5)
Exercise of the joint after contrast administration has been shown to increase convective transport of the contrast agent into the joint and cartilage [15]. The reproducibility of hip dGEMRIC measured at 30 min post-contrast shows CV% on the order of 15 % [13]. However, with standardization of timing of image acquisition and exercise routine and with the use of more rapid T1 acquisition, the reproducibility can be improved to 5–8 % in the hip [16] and 4–7 % in the knee [17]. For cross-sectional studies, the ease of early imaging may motivate early imaging time points. For longitudinal studies in which reproducibility is a concern, the later, more stable time points may be beneficial.
Fast T1-Mapping
Traditionally dGEMRIC has been performed using a two-dimensional T1-weighted inversion recovery (2D-IR) sequence to acquire data for quantitative T1 mapping [18, 19]. The major advantage of this method is the widespread availability of the sequence and desirable contrast properties (cartilage versus fluid). However, the 2D technique suffers from obvious limitations such as limited coverage (single slice) and susceptibility to motion effects between acquisitions with different inversion times (TI) [20]. Therefore, it has not been possible to perform a full-joint assessment of the GAG distribution in a single imaging session. Furthermore, in single-slice 2D imaging, difficulties associated with obtaining the same section in subsequent imaging sessions makes interpretation of follow-up scans unclear. Given the spatial variations observed with cartilage diseases, and the importance of following the progression of disease over time, it is important to be able to obtain information about the biochemical status of cartilage across the joint [10].
Recently, several methods for performing dGEMRIC in a three-dimensional (3D) volume of interest have emerged. In the long-term, there are many advantages of using 3D sequences for dGEMRIC. With 3D, it will be possible to evaluate the whole joint cartilage, instead of just a selected cross-section as with 2D. This will make it possible both to study local changes and lesions over larger portions of the cartilage, including improved possibilities for giving diagnoses regarding specific locations on the cartilage as well as improved possibilities for performing measurements that can more easily be reproduced [21].
As of today, the usage of 3D techniques in dGEMRIC is at an early stage; however, validation studies comparing 3D to 2D techniques [20, 22] appear promising. To obtain full-joint coverage, a 3D inversion recovery spoiled gradient echo (IR-SPGR) sequence has been shown to be effective. However, to sample the T1 recovery curve comparable to the 2D approach, the total acquisition time is considerably long, approximately 18 min for 5 TIs [10]. Alternate 3D methods for fast and efficient T1 mapping have been introduced. The two main 3D techniques that are considered for T1 quantification in dGEMRIC today are 3D-Look-Locker (3D-LL) [11, 20] and 3D-variable flip angle (3D-VFA) [22, 23].
The 3D Look-Locker technique has been validated against the traditional inversion recovery technique. With this approach, volume imaging can be obtained within an acquisition time comparable to single slice 2D acquisition with IR-FSE (with 5 TIs), while sampling the T1 recovery curve better (typically using 10–12 TI values). Preliminary feasibility and accuracy studies, comparing the 3D-LL technique with traditional 2D IR-FSE technique, indicated a potential limitation of the technique in terms of segmentation of the cartilage for analysis. Because of the short echo times (TE) used for the acquisition, the contrast between the cartilage and synovial fluid was minimal [20, 24]. These limitations can be overcome by acquiring a set of additional position-matched anatomical images immediately before or after 3D-LL acquisitions. These anatomical images provide sufficient contrast between cartilage and fluid, and much better signal to noise ratio (SNR) and, hence, serve as a visual guide to define anatomy [20].
The dual flip angle technique has been validated against the traditional inversion recovery technique. It can decrease the imaging time significantly compared to IR techniques while still allowing 3-D acquisition. It must be noted that the choice of flip angle is optimized for a range of T1 values. Outside, this window, the T1 measurement will be inaccurate (Fig. 16.3). Furthermore, with this gradient echo-based technique, it is important to center the hip in the middle of the imaging matrix since the T1 mapping data is inaccurate at the periphery of the imaging matrix [22].
Fig. 16.3
T1 was measured using dual flip angle fast T1 mapping technique vs. inversion recovery in gadolinium phantoms. Bland-Altman plots of T1 values measured are shown. For center T1 of 756 ms, the Pearson regression constant was −1.65 ms and the slope was 0.01 with R 2 of 0.17. When the center T1 deviates from the measured range, the dual flip angle technique becomes inaccurate (Magn Reson Med. 2008 Oct;60(4):768–73)
Both Look-Locker [20] and dual flip angle [23] techniques of fast T1 mapping is dependent on accurate knowledge of the flip angle, hence, any type of B1 inhomogeneity will cause an error in the T1 measurement. B1 field inhomogeneity correction methods are available and recommended when using these fast T1 mapping techniques [25].
T Versus 3 T
The current literature suggests that musculoskeletal imaging at 3 T MRI offers multiple benefits compared to 1.5 T [26, 27]. Firstly, 3 T MRI results in an increase in SNR compared with 1.5 T MRI. The use of 3 T imaging results in an SNR that is roughly twice that of a 1.5 T scanner. This gain in SNR can be used to either improve image quality or decrease the scan time in contrast to 1.5 T imaging. Higher spatial resolution in a joint with thin cartilage such as the hip can result in improved diagnostic accuracy. Decreased scan times possible at 3 T MRI will help reduce artifacts related to patient motion in individuals who are unable to or who have difficulty holding still during the MRI process. This results in a preservation of image quality and resolution even at reduced imaging times [28].
However, in practice, altered relaxation times of tissue together with the need for changing the imaging parameters results in SNR gains that are inferior to what has been predicted by theory [29]. For example, since the chemical shift increases linearly with the field strength, an adjustment of the receiver bandwidth is necessary to maintain the fat-water shift used at lower field strengths. This further reduces the possible increase of the SNR while the larger frequency dispersion at 3.0 T facilitates an improved frequency-selective fat suppression that might be beneficial for knee and hip imaging. Some authors even reported a reduced contrast between suppressed fat and surrounding hypointense tissues [29]. Imaging at higher field strength is also prone to pronounced susceptibility gradients, in particular for gradient echo and steady-state free precession (SSFP) sequences. Nonetheless, a number of in vitro studies have shown improved visualization of cartilage and ligament pathology at the knee and ankle using 3.0 T in comparison with 1.5 T MRI [30, 31]. Studies have also demonstrated 3.0 T MRI to have high sensitivity and specificity in diagnosing knee meniscus, cartilage, and ligamentous pathology when compared with subsequent arthroscopy [32]. Wong et al. performed a study comparing visualization of cartilage, ligaments, and menisci at 1.5 and 3.0 T in the same subjects. They showed that 3.0 T MRI was superior for detecting and grading cartilage lesions compared to 1.5 T. Though a higher diagnostic confidence was found at 3.0 T, the false-positive rate was not decreased. Overall image quality at 3.0 T was rated superior to 1.5 T [28].
When performing dGEMRIC at 3 T, the change in relaxivity at the higher field strength will alter the T1 value obtained. In general, the T1 value of the same cartilage will be higher at 3 T. Additionally, the effects of B1 inhomogenity will be higher and hence B1 correction algorithm should be used when performing fast T1 mapping at 3 T.
dGEMRIC in Dysplasia
By some estimates, 20–40 % of hips requiring arthroplasties may be due to secondary OA from DDH [33–35]. The smaller area of anterolateral acetabular coverage in DDH increases mechanical stress in the cartilage, which results in cartilage damage [36]. The risk of developing OA in dysplastic hips appears to be a function of severity of dysplasia and age [37]. Cooperman at al. [38] have shown that hips with severe dysplasia with joint subluxation degenerated quickly, while Murphy et al. [39] demonstrated that hips with center–edge angle less than 16° all developed eventual osteoarthritis. Fuji et al. reported in their arthroscopic study that cartilage lesions in DDH are commonly seen in the anterosuperior aspect of the acetabulum. They found cartilage lesions in 14 of 18 hips in pre-arthritic cases with 11 located in the anterosuperior part of the acetabulum in patients younger than 20 years [40]. McCarthy and Lee confirmed this pattern of early cartilage damage. They reported that 100 (59 %) of 170 hips with DDH had chondral defects situated in the anterior quadrant and concomitant anterior labral lesions were as frequent as 66 % [41].
Kim et al. investigated the applicability of dGEMRIC in hip dysplasia [13]. In 68 hips (43 patients), the dGEMRIC index and joint space width were compared to radiographically and clinically relevant factors such as pain, severity of dysplasia, and age. The dGEMRIC index correlated significantly with pain and lateral center–edge angle as measure of severity of dysplasia. In contrast, joint space width did not correlate with pain or severity of dysplasia as shown in Fig. 16.4. A statistically significant difference of the dGEMRIC index among mild, moderate, and severe dysplasia could be observed. The average dGEMRIC index ranged from 570 ms (no dysplasia), to 550 ms (mild dysplasia), to 500 ms (moderate dysplasia), to 420 ms (severe dyplasia). This study demonstrates that biochemical MRI (i.e., dGEMRIC scans) correlates better with clinical important parameters in hip dysplasia than do traditional radiographic measures of OA, thus suggesting that this is a valid metric to be used in clinical studies of OA.
Fig. 16.4
Scatter plots of the dGEMRIC index and joint space width (JSW) versus the WOMAC pain score. The Spearman rank correlation showed a significant negative correlation between the dGEMRIC index and pain but no significant correlation between joint space width and pain. GAG glycosaminoglycan content (J Bone Joint Surg Am. 2003 Oct;85-A(10):1987–92)
In an attempt to better understand the anatomic and demographic factors that may predispose a hip to early OA, a study involving 96 hips with acetabular dysplasia was performed to look at risk factors of early OA as defined using dGEMRIC [42]. Hips with a dGEMRIC index <390 ms were used as the definition of hips with early OA; by this metric, cases <390 ms were older, had smaller lateral and anterior center–edge angles, and had an increased incidence of radiographic joint subluxation and labral tears. Using these data, the probability of significant OA (T1 < 390 ms) as a function of age, severity of dysplasia, and with and without labral tears could be plotted (Fig. 16.5). This type of paradigm shift may improve our understanding of other conditions that lead to OA. The results of the study are consistent with the conclusion by Murphy et al. [39] that osteoarthritis will eventually develop in hips with a lateral center–edge angle of less than approximately 15°.
Fig. 16.5
Probability of osteoarthritis developing as a function of age in moderately (lateral center–edge angle 5–15°) and severely (LCE < 5°) dysplastic hips with and without labral tear (J Bone Joint Surg Am. 2009 May;91(5):1120–9)
Bernese periacetabular osteotomy (PAO) is effective for mild to severe hip dysplasia in relieving hip pain and improving joint biomechanics. The goal of surgery to treat AHD is to realign the acetabulum into its optimal mechanical position. The PAO does not produce a normal acetabulum. This surgery reorients the position of an abnormally shallow acetabulum to optimize stress transfer across the joint by increasing the contact area [43]. This osteotomy may slow the progression of secondary OA and delay the need for salvage surgery, arthrodesis, or arthroplasty [44]. In general, early reconstructive osteotomies performed on younger patients who have little radiographic evidence of OA by Tönnis grades are regarded the best candidates for this procedure. Hips that fail prematurely after osteotomy are expected to have more evidence of OA on radiographs [45].
In order to assess the clinical value of dGEMRIC in predicting surgical outcome after pelvic osteotomy, a cohort of 47 patients who underwent PAO for hip dysplasia was investigated prospectively [14]. In addition to patient age, radiographic severity of OA, severity of dysplasia, and the dGEMRIC index was evaluated. This study showed that PAO is an expedient tool to reduce pain and ameliorate joint function. When clinical and radiographic failure groups were compared with satisfactory groups, identified predictors included radiographic joint subluxation, Tönnis grade, joint space width, and the dGEMRIC index (498 ± 105 ms [satisfactory] versus 370 ± 88 ms [failed]; P < 0.01). A multiple logistic regression model that included joint space width, joint subluxation, Tönnis grade, and dGEMRIC index as independent variables showed the preoperative dGEMRIC value and joint subluxation to be the best independent predictors of early postoperative failure of the PAO. The probability of total hip arthroplasty increased dramatically when the dGEMRIC index was <390 ms (Fig. 16.6).
Fig. 16.6
Calculated probability of the patient needing an arthroplasty after periacetabular osteotomy for hip dysplasia as a function of the preoperative dGEMRIC index (J Bone Joint Surg Am. 2006 Jul;88(7):1540–8)
These studies demonstrate the validity of dGEMRIC as a metric of OA in dysplastic hips. By extension, these studies demonstrate the validity of using dGEMRIC in the clinical setting and support the use of this metric as the primary radiographic tool to assess osteoarthritis rather than plan radiographs.
dGEMRIC in FAI
The most frequent location for FAI is the anterosuperior rim area and the most critical motion is internal rotation of the hip in 90° flexion. Two types of FAI have been identified. Cam-type FAI, more prevalent in young male patients, is caused by an offset pathomorphology between head and neck and produces an outside-in delamination of the acetabulum. This carpet phenomenon is located mostly in the anterosuperior region of the acetabulum and results in permanent intraarticular cartilage damage [46]. Pincer-type FAI, more prevalent in middle-aged women, is produced by a more linear impact between a local (retroversion of the acetabulum) or general overcoverage (coxa profunda/protrusio) of the acetabulum. The damage pattern is more restricted to the rim and the process of joint degeneration is slower, so that the labrum might be damaged prior to cartilage damage. Most hips, however, show a mixed FAI pattern with cam predominance [47, 48].
The abnormal contact between the acetabular rim and femoral head neck junction can progress over time and result in osteoarthritis (OA) of the hip joint if the underlying cause of impingement is not addressed. Untreated symptomatic FAI is a risk factor for the development of premature osteoarthritis (OA) in the hip [47]. Multiple reports have shown good outcomes following early surgical intervention in patients with preexisting mild changes of OA, but poor results in patients with advanced degenerative changes [49


Related posts:

Stay updated, free articles. Join our Telegram channel
Full access? Get Clinical Tree
