Fig. 5.1
PET images differentiate neoplastic areas with hypermetabolic activity from within the surrounding normal tissue. (a) CT image , (b) PET image, and (c) fused PET/CT image . The teal color marks the gross tumor volume (GTV) as determined from PET image. Modified and adapted with permission [18]
Like PET, SPECT has also been extensively employed in the clinic. In general, SPECT isotopes have long half-lives, whereas PET isotopes have relatively short half-lives. Commonly used isotopes for SPECT imaging include [111In] indium and [177Lu] lutetium. Most importantly, SPECT can distinguish among different radioisotopes based on the isotope-specific energies of the emitted photons . Therefore, it is possible to image different targets simultaneously using SPECT [19]. In recent times, application of SPECT imaging in the clinic is less compared to MRI, PET, and ultrasound .
MRI
In modern times, magnetic resonance imaging (MRI) has become a highly versatile imaging and diagnostic tool [20]. The technique was developed in the early 1970s and led to a Nobel Prize in Physiology and Medicine to Paul Lauterbur and Peter Mansfield in 2003. MRI involves the detection of nuclear spin reorientation in an applied magnetic field [21]. Compared to CT imaging, MRI has several advantages, such as high temporal and spatial resolution, excellent tissue contrast and tissue penetration, no ionizing radiation, capability of serial studies, and simultaneous acquisition of anatomical structure and physiological function [22]. The intensity of the MR image depends mainly on four parameters: nuclear density; two relaxation times, called T1 (T1 relaxation time is a time constant in which the nuclei align in a given magnetic field) and T2 (T2 is the time constant for loss of phase coherence of excited spins); and motion of the nuclei within the region of interest (ROI) . As the nuclear density increases, increasing numbers of nuclei align with the magnetic field, producing a proportionately intense MR signal [21]. Abnormal soft tissue can be better differentiated through measurement of these four parameters compared to any other previous described techniques. MRI-based high soft-tissue contrast allows the assessment of extent and spread of disease, which ultimately can influence radiation treatment volumes [23]. In addition , spatial orientation of the MR image can be performed in any plane, because of the feasibility of manipulating the magnetic field gradients. These inherent advantages of MRI make it a useful imaging method for the evaluation of neurological, musculoskeletal structures, cancer diagnosis, and radiotherapy treatment planning [24–28]. For brain metastases, MRI is much more sensitive than CT, particularly at identifying small lesions (≤0.5 cm) [29]. The ability to visualize tiny lesions prevents patients from aggressive definitive-intent local therapies and allows these lesions to be targeted by stereotactic radiosurgery , which can be delivered with submillimeter accuracy. Additionally, MRI is used for treatment planning in gastrointestinal [30], genitourinary [31, 32], head and neck [33], gynecologic [34], and sarcomatous tumors [23]. By attaching paramagnetic labels to appropriate targeting ligands, MR signal intensity and contrast can be modulated to directly or indirectly obtain functional information of the labeled target, for example, 1H MRI of tissue water protons can be used to indirectly image membrane receptors, such as ERBB 2 (also known as HER-2 ) on breast cancer cells [35], the integrin αvβ3 on endothelial cells [36–38], and the phospholipid phosphatidylserine on the surface of apoptotic cells [39, 40]. MR image resolution in vivo at the single cell level is currently not possible; however, it is possible to image the presence of single cells using iron oxide-based nanometer or micrometer-sized particles . The effect of these particles on the surrounding magnetic field extends beyond the boundaries of the cell enabling imaging of single cell [41]. This technique has been used to track implanted stem cells in the brain and spinal cord [42, 43], to monitor T-cell trafficking in immunogenic tumors [44, 45], and to image the location of implanted dendritic cells in the clinic [46].
Imaging of Tumor Metabolism
In recent years, molecular imaging of tumor metabolism has gained considerable interest. Several preclinical studies have indicated relationship between activation of various oncogenes and alterations in cellular metabolism, now considered as one of the hallmarks of cancer [47, 48]. In normal mammalian cells under aerobic conditions, mitochondria oxidize pyruvate to CO2 and H2O while generating energy equivalents. Conversion of glucose to lactic acid even in the presence of oxygen is termed as aerobic glycolysis and frequently noticed in malignant cells. Otto Warburg first reported this phenomenon at the beginning of the twentieth century as a specific metabolic abnormality of cancer cells, commonly known as “Warburg effect .” He hypothesized that cancer arises from a defect in mitochondrial metabolism leading to aerobic glycolysis [49]. Over time studies conducted in human and rodent glioma cells exhibited high or moderate susceptibility to inhibitors of oxidative phosphorylation, and glioma cells exhibiting high glycolytic phenotype oxidized pyruvate and glutamine even when glucose levels were found to be low [50]. These experimental data suggested that a mitochondrial defect is not a prerequisite for the genesis of cancer and in a strict sense disproved Warburg’s hypothesis . Nevertheless, several studies have confirmed frequent overexpression of glucose transporters and glycolytic enzymes in malignant tumors including brain, head and neck, breast, and prostate cancer indicating altered glucose metabolism [51, 52].
18F-FDG PET/CT
18F-fluorodeoxyglucose (FDG) is the most commonly used and the only oncologic PET tracer approved by the Food and Drug Administration (FDA) for routine clinical monitoring of tumor glucose metabolism . More than 90 % of oncologic PET imaging is performed by FDG-PET due to the increased metabolism of glucose by most of the solid tumors including the lung, colorectal, esophageal, stomach , head and neck, cervical, ovarian, breast, melanoma, and most types of lymphomas. In addition to diagnosis, staging, restaging, and monitoring response to cancer treatment, FDG-PET can be useful for selection or delineation of radiotherapy target volumes. FDG-PET has been used as a dose-painting target for sub-volume boosting and thus guiding radiotherapy planning. The use of FDG-PET for radiotherapy planning purposes has shown increasing importance, as more and more radiation oncologists believe that target volume selection and delineation can be adequately performed using FDG-PET in certain cancer types such as non-small cell lung carcinoma (NSCLC) stage N2-N3 patients [53]. In head and neck squamous cell carcinoma (HNSCC) , methodological studies have shown that the use of pre-radiotherapy using FDG-PET led to a better estimate of the exact tumor volume, as defined by the pathologic specimens, compared with CT and MRI. Interestingly, when validated segmentation tools were used, the mean FDG-PET-based GTV was consistently smaller than the GTV defined from morphologic imaging in all investigated tumor locations and at all-time points during radiotherapy (Fig. 5.2a) [12, 56, 57]. 18F-FDG PET/CT is also increasingly used for monitoring tumor response after completion of therapy as demonstrated for malignant lymphoma lung, colon, and breast cancer [58]. An example from a lymphoma patient shown in Fig. 5.2b demonstrates that high metabolic activity (measured by high uptake of FDG) of the tumor before the therapy had reduced after the therapy (indicated by reduced FDG uptake), indicating the efficacy of the treatment [54]. Persistently increased FDG uptake after treatment is also associated in predicting a high risk for early disease recurrence and poor prognosis. In patients with Hodgkin’s disease and aggressive non-Hodgkin’s lymphoma , 18F-FDG PET showed very promising results for assessing tumor response early in the course of therapy. This study included 260 patients with Hodgkin’s lymphoma and utilized 18F-FDG PET before and after two cycles of chemotherapy to monitor tumor response. The 2-year progression-free survival for patients with positive PET results after two cycles of chemotherapy was 13 %, whereas it was 95 % for patients with a negative PET scan. In a univariate analysis, the treatment outcome was significantly associated with PET response after two cycles of chemotherapy and various well-known clinical prognostic factors such as stage and the international prognostic score (IPS) . In multivariate analyses, however, only positive PET results after two cycles of chemotherapy turned out to be significantly correlated with patient survival (P < 0.0001). These data indicated that tumor response in 18F-FDG PET after two cycles of chemotherapy is a stronger predictor of patient outcome than the IPS and other well-established clinical prognostic factors [59]. The results from this study concluded that 18F-FDG PET appears to be the single most important tool for risk-adapted treatment in Hodgkin’s lymphoma [59]. The ability of 18F-FDG PET to predict tumor response early in the course of therapy as in the case of Hodgkin’s lymphoma offers the opportunity to intensify treatment in patients who are unlikely to respond to first-line chemotherapy. Conversely, treatment could be shortened in patients who show a favorable response after two cycles of chemotherapy . This is of particular interest in Hodgkin’s lymphoma, since chemotherapy combined with radiotherapy can cure most of the patients but also puts them at increased risk for secondary malignancies and other serious long-term complications, such as infertility and cardiopulmonary toxicity . Focal 18F-FDG uptake after chemo- or radiotherapy has been shown to be a strong prognostic factor. In one of the largest prospective studies published so far, Schwarz et al. [55, 60] prospectively performed 18F-FDG PET in patients with cervical cancer treated by chemoradiotherapy . Post therapy 18F-FDG PET (2–4 months later) showed a complete metabolic response (Fig. 5.2c) in 70 % of the patients, a partial metabolic response in 16 %, and progressive disease in 13 % of patients. The 3-year progression-free survival rates of these patient subgroups were estimated to be 78 %, 33 %, and 0 %, respectively (P < 0.001) [55, 60]. Another application of 18F-FDG PET could be in deciding sub-volumes within tumor or lymph nodes that demonstrate high metabolic activity and therefore represent high-risk lesions to be selectively treated with an increased radiation dose. Several studies in rectal and lung cancer have shown that FDG-PET allows selective boosting of hypermetabolic areas. For example, in a study conducted in patients with small-cell lung cancer, FDG-PET-based radiation planning for mediastinal lymph nodes changed the radiotherapy field in 24 % of the patients [61]. In patients with head and neck cancer, the radiation boost dose was markedly elevated and directed at the tumors with the highest FDG-avidity, and the adverse treatment-related effects remained limited [62]. Despite its great clinical utility, FDG-PET has a few limitations. The technique has lower sensitivity for slow growing, metabolically less active tumors (such as prostate, thyroid, and neuroendocrine tumors), and high levels of uptake in some normal tissues, such as the brain, that can make quantification of tumor uptake specifically difficult. Accumulation of PET tracers in infiltrating inflammatory cells, which also show high glycolysis, might give false-positive results and limit the sensitivity of the technique for detecting tumor response to treatment [63].


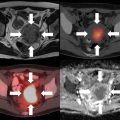
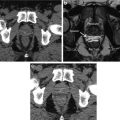
Fig. 5.2
(a) An example showing application of FDG-PET over conventional CT and MRI (T2-weighted sequence). A patient with right-sided hypopharyngeal squamous cell carcinoma received concomitant chemoradiotherapy. Images were obtained using intravenous contrast CT, MRI (T2-weighted sequence), and FDG-PET before treatment (upper panel) and at the end of weeks 3 and 5 of 30 Gy and 50 Gy radiation dose, respectively (lower two panels). FDG-PET imaging depicted the most pronounced decrease in tumor volume post therapy compared to CT or MRI. Modified and adapted with permission from [12]. (b) FDG-PET-based imaging to determine response to chemotherapy. (a) High FDG-PET uptake of 2-[18F] fluoro-2-deoxy-d-glucose (FDG) in a patient with lymphoma arrowed before (a) and reduced uptake after (b) drug chemotherapy, seen in the tumor and brain. Modified and adapted with permission from [54]. (c) Application of 18F-FDG-PET to assess complete metabolic response. PET/CT image of 52-year-old women diagnosed with stage IVA squamous cell cancer of the cervix. (a) Sagittal (top) and transaxial (bottom) CT (left), fused PET/CT (middle), and PET (right) images taken at the initial stage demonstrate high 18F-FDG uptake within the cervical mass. (b) Sagittal (top) and transaxial (bottom) CT image (left), fused PET/CT (middle) image, and PET (right) image taken 3 months after concurrent radiotherapy clearly showing resolution of cervical mass with mild or diffuse uptake of 18F-FDG within the cervix, depicting complete metabolic response. Adapted with permission from [55]
Hyperpolarized Metabolic MR
Hyperpolarized 13C MRI is an emerging molecular imaging technique that can provide unprecedented gain in amplifying signal intensity. This technique can be used to monitor uptake and metabolism of 13C-labeled endogenous biomolecules such as glucose, pyruvate, fumarate, etc. [64, 65]. The degree and magnitude of the increase in sensitivity of biomolecules depend on the extent of polarization achieved, the T1 relaxation time of the agent, the delivery time, and the MR imaging methods employed. The polarization of 13C at a magnetic field strength of 3 T is calculated to be 2.5 ppm. Consequently, biological molecules enriched with 13C suffer from poor sensitivity because of a lower magnetic moment, lower polarization, and reduced concentrations compared to tissue water proton (in range of a few mM versus 80 M for water 1H). As a result of these differences, ~ four orders of sensitivity difference for 13C-containing molecules compared to water protons need to be bridged to implement metabolic imaging using endogenous organic molecules. Increasing the polarization (fraction of molecules with nuclear spins emitting signal) needs to be increased significantly. Among the various methods used to enhance the polarization of nuclei, dynamic nuclear polarization (DNP) technique has so far been the most successful for in vivo applications [64–66]. In DNP, the higher polarization of a molecule with an unpaired electron spin is transferred to nuclei such as 1H, 13C, 15N and 19F, etc. Firstly, for a molecule to be sufficiently polarized with long signal decay, it should possess a carbon site with long intrinsic T1 that can be enriched in 13C (e.g., carbonyl or carboxylic acid). Introducing deuterium in aliphatic carbons has been shown to be very amenable. Secondly, the molecule should be able to form a homogenous glassy solid formulation with the paramagnetic agent as when frozen it must ensure polarization transfer from the electrons to nuclei. Thirdly, upon dissolution the loss of polarization should be marginal and not significantly high. Fourthly, the chemical shifts of the injected molecule and products should be clearly distinct. Lastly, the molecule should not exhibit any associated side effects when injected as a bolus at the required doses (typically approx. 0.1 mmol/kg body weight). Pyruvate labeled with 13C in the C-1 position satisfies all the prerequisite conditions listed above for a polarized agent. Hyperpolarization of pyruvate is achieved by mixing 13C-labeled compounds with an electron paramagnetic agent (EPA), e.g., OXO-63. The mixed entity is then placed in a 3.35-T magnetic field, cooled to ~1 K, and microwaves are used to transfer polarization from the electron spin of the EPA to the 13C nuclei of the biomolecule [66]. Once the polarization is achieved, the sample is rapidly dissolved with hot, sterile water and neutralized to physiological pH, temperature, and osmolality. Hyperpolarized 13C pyruvate can be intravenously injected where it metabolized in tissues to various metabolites such as bicarbonate , lactate , and alanine depending on the dominant metabolic pathway in the tissue of interest in vivo. The conversion of pyruvate to each of these metabolites can be imaged using chemical shift MRI or MR spectroscopic imaging (MRSI) . The data acquisition utilizing hyperpolarized pyruvate is very rapid, approximately 60 s for [1-13C] pyruvate at 3 T. Several studies have shown the preclinical application of using hyperpolarized pyruvate [64, 65]. Studies examined hyperpolarized 13C pyruvate and lactate in a C6 glioma-bearing animal before radiotherapy (Fig. 5.3b–d, top) and 96 h after radiotherapy (Fig. 5.3b–d, bottom). Comparison of spectra from tumor voxels with those on the contralateral side of the brain indicated high lactate signal in the tumor than in the brain (Fig. 5.3a). 13C chemical shift images acquired following intravenous injection of hyperpolarized [1-13C] pyruvate into rats with implanted C6 gliomas showed significant labeling of lactate within the tumors but comparatively low levels in the surrounding brain. Labeled pyruvate signal was observed at high levels in blood vessels above the brain and from other major vessels elsewhere but was detected at only low levels in the tumor and in the brain [67, 68]. The ratio of hyperpolarized 13C label in tumor lactate compared with the maximum pyruvate signal in the blood vessels was decreased from 0.38 to 0.23 (a reduction of 34 %) by 72 h following whole-brain irradiation with 15 Gy (Fig. 5.3) [67]. Further studies in a transgenic adenocarcinoma of the mouse prostate (TRAMP) model demonstrated elevated levels of hyperpolarized [1-13C] lactate in tumor, with the ratio of [1-13C] lactate/[1-13C] pyruvate being increased in high-grade tumors and decreased after successful treatment (Fig. 5.4) [69]. The preclinical studies using hyperpolarization of pyruvate has now advanced to human clinical trials. The first human translation of hyperpolarized technology was successfully demonstrated in patients with prostate tumor [70]. In brief, the study imaged 31 untreated patients diagnosed with localized prostate cancer, where 23 patients had Gleason score of 6, 6 patients with Gleason score 7, and 2 patients with Gleason score 8. The initial phase 1 of the study evaluated the safety, feasibility, and tolerability of injected hyperpolarized [1-13C] pyruvate. The study indicated no dose-limiting toxicities associated with hyperpolarized [1-13C] pyruvate. In addition, the median time taken for the dissolution of the agent to delivery into patient was 66 s. The 1D dynamic MRSI data obtained showed higher [1-13C] lactate signal coming from tumor, and no detectable [1-13C] lactate signal came from the area which did not had tumor. The study confirmed correlation between the high lactate signals with prostate cancer grade. In conclusion, the study successfully demonstrated safety, tolerability, kinetics of hyperpolarized pyruvate delivery, and imaging hyperpolarized 13C metabolism (Fig. 5.5). In the future, more studies will be designed utilizing hyperpolarized [1-13C] pyruvate in larger cohorts of patients with different tumor types to firmly acknowledge the correlation with tumor grade and changes with therapy .


Fig. 5.3
Representative images of hyperpolarized 13C pyruvate (c) and lactate (d) in a C6 glioma-bearing animal before (top) and 96 h after radiotherapy (bottom). ACSI dataset is shown in (a). The chemical shift images were superimposed on grayscale T1-weighted proton images (b) for anatomical reference. The lactate signals, in the false color images, were normalized to the maximum pyruvate signal in each dataset. The lactate signal was reduced following exposure to 15-Gy radiation [67]. CSI chemical shift imaging
Fig. 5.4
Hyperpolarized 13C metabolic images of a TRAMP mouse. Upper: representative anatomical image (a) and hyperpolarized 13C lactate image (b) following the injection of hyperpolarized [1-13C] pyruvate, overlaid on T2-weighted 1H image. Middle: hyperpolarized 13C spectra of primary prostrate and metastatic tumor regions. (c) Lower: 3D MRSI depicting markedly elevated lactate in the high-grade primary tumor compared with the low-grade tumor. This study demonstrated application of hyperpolarized MRSI imaging of lactate-pyruvate ratio as a biomarker for the assessment of radiation therapy response [67]. Ala alanine, Lac lactate, Pyr pyruvate
Fig. 5.5
Representative image showing 2D 13C dynamic MRSI data . Images are from a representative patient with a current PSA of 3.6 ng/ml, who had biopsy-proven prostate cancer in the left apex (Gleason grade 3 + 4) and received the highest dose of hyperpolarized [1-13C] pyruvate (0.43 ml/kg). (a) A focus of mild hypo-intensity can be seen on the T2-weighted image, which was consistent with the biopsy findings. (b–d) 2D localized dynamic hyperpolarized [1-13C] pyruvate and [1-13C] lactate from spectral data that were acquired every 5 s from voxels overlapping the contralateral region of the prostate (turquoise), a region of prostate cancer (yellow), and a vessel outside the prostate (green). The dynamic data were fit as described previously [71]. Data taken with permission from [70]
Imaging Cellular Proliferation
Measures of tumor cell proliferation can help to assess the degree of tumor aggressiveness. Several in vitro biomarkers and assays have been developed to estimate tumor proliferation correlating its aggressiveness and stage. However, conventional anatomic pathology is limited in its ability to quantify the rate of cellular proliferation and requires invasive biopsies making it difficult to obtain over time from different metastatic lesions of the patient. Therefore, efforts have been taken to develop imaging modalities to noninvasively measure and quantify the rate of cell proliferation. Noninvasive imaging to estimate the rate of tumor cell proliferation has focused on the application of PET in conjunction with tracers for the thymidine salvage pathway of DNA synthesis. A tracer of thymidine has great implications, as it is the only pyrimidine or purine base unique to DNA, thereby measuring only the DNA synthesis. In the clinics, 3-deoxy-3-[18F]fluorothymidine (FLT) is the most widely used PET tracer to noninvasively measure tumor proliferation. The principles and application of FLT/PET imaging-based radiotherapy planning and tumor response are covered comprehensively in the section on clinical imaging and radiotherapy (see Chap. 9). Here we discuss application of spectroscopy-based imaging involving magnetic resonance spectroscopy imaging (MRSI) to measure cellular proliferation and its application in radiotherapy.
MRSI
MRSI combines the ability of spectroscopy to acquire a large volume of metabolic information, with the ability of imaging to localize information spatially. Although phosphorus (31P) and carbon (13C) MRSI are possible, proton (1H) MRSI is the technique most often used in clinical settings. On 1H MRSI , tumor spectra contain resonances from metabolites such as taurine , total choline (choline, phosphocholine, and glycerophosphocholine), total creatine (phosphocreatine and creatine), pyruvate , and lactate .
Among the hallmarks of cancer described by Hanahan and Weinberg, elevated choline metabolism resulting in the accumulation of choline containing compounds such as choline , phosphocholine , and glycerophosphocholine (together represented as tCho) is recognized as an important hallmark, which is amenable for in vivo detection, by MRSI. Studies have shown that malignant transformation rather than just rapid proliferation as the reason for the increased accumulation of tCho is making this a very specific MRI-based imaging biomarker for proliferation [72, 73]. Tumor microenvironmental features such as hypoxia and acidotic extracellular conditions have also been associated with elevated tCho [74]. Several clinical studies already support the strength of monitoring tCho in detecting malignancies and predicting survival. Numerous multi-institutional clinical studies are examining the utility of MRS to detect tCho to aid in the diagnosis and treatment response monitoring .
Imaging Tumor Microenvironment
Tumors survive obtaining oxygen and nutrients passively up to a size of ~2–3 mm3. For further growth, they invoke neo-angiogenesis to grow new blood vessel network, commonly known as tumor vasculature . While in normal tissue, the angiogenesis processes are tightly regulated resulting in a physically robust vascular network functioning well to deliver oxygen and nutrients, the tumor vascular network is aberrant and not well organized and functions abnormally resulting in a marked heterogeneity in perfusion. As a consequence, tumors exhibit hypoxia and acidotic environments. These are two common features characterizing the tumor microenvironment. Imaging techniques, which can obtain information pertaining to the tumor microenvironment, such as tumor oxygen status, perfusion, and tumor pH, will be useful in both diagnoses and treatment planning.
Development of hypoxia in the tumor microenvironment is highly dynamic process resulting in alterations in cellular metabolism and proliferation. Typically, focal areas of hypoxia are observed in many solid tumors (mainly in the core of the tumor). Tumors exhibit high proliferation ability, and one of the direct consequences of unregulated cellular growth results in a greater demand of oxygen (as well as other nutrients) for energy metabolism. However, unlike normal cells, tumor cells rapidly adapt to hypoxic microenvironment by slowing their growth rate, inhibiting apoptosis, switching mitochondria respiration to glycolysis, stimulating growth of new vasculature (neo-angiogenesis), and promoting metastatic spread. Several preclinical and clinical studies have shown that hypoxic tumors also have elevated expression of key transcription factors notably hypoxia-inducible factor (HIF) expression [75]. A number of hypoxia-related genes, downstream transcription factors, and signaling molecules are also found to be responsible for the genomic changes within the tumor. Some of the most commonly associated molecular changes associated with tumor hypoxia include elevated expression of endothelial cytokines such as vascular endothelial growth factor (VEGF) and signaling molecules such as IL-1, tumor necrosis factor alpha (TNF-α) , transforming growth factor beta (TGF-β) , and loss of p53 expression [76]. Increased glycolysis observed in most hypoxic cells leads to accumulation of lactate in the microenvironment resulting in reduced glycolytic activity and increased acidosis (reduced pH) [77]. These changes arising from hypoxia create an environment conducive for tumor progression and development of metastases as well as therapy-resistant clones [77, 78]. Most chemotherapeutic drugs act by inhibiting tumor growth, but when a tumor becomes hypoxic, cells enter a resting phase in their cell cycle and tend to become refractory to these cytotoxic agents. The hypoxia-induced metastatic phenotype is also a contributing factor for the disappointing success of much acclaimed anti-angiogenic therapy. Ionizing radiation is an alternative and effective strategy for killing proliferating cells because the radiation field is homogenous and the killing effect of radiation is independent of vascular delivery. However, radiobiologists have long recognized negative influence of hypoxia on response to radiation therapy as the cytotoxicity of ionizing radiation depends on the level of intracellular O2. Gray made this observation over 50 years ago that about a three times higher dose of radiation is required to kill hypoxic cells over well-oxygenated cells. Thus, the presence of tumor hypoxia can compromise the effectiveness of radiation treatment.
Another key characteristic of tumor hypoxia is that it is heterogeneously distributed and its dynamics keeps changing over time and with therapy [79]. The blood supply of a malignant tumor is thought to be suboptimal as its vasculature network is immature, leaky , and randomly distributed making it chaotic. This chaotic microvasculature of tumor tissue leads to two types of hypoxia , which can be defined as either diffusion limited or perfusion limited. The first, also known as chronic hypoxia , is the consequence of proliferating cells exceeding the oxygen capacity of the newly formed vascular network. This is because the newly synthesized microvasculature is often insufficient in providing the normoxic microenvironment in the distant tumor areas resulting in diffusion-limited hypoxia [78]. Tumor cells exposed to acute hypoxia have easier access to the blood circulatory system, as they are thought to be nearer the blood vessels. These tumor cells may therefore have greater perfusion limited hypoxia or acute hypoxia , resulting from the structural and functional abnormalities in the newly formed vasculature with poor or insufficient blood supply. Subsequently, this leads to an unstable blood supply to the core of proliferating tumor cells producing intermittent hypoxia . This form of hypoxia is often characterized by rapidly fluctuating oxygen concentration [78]. The relevance of cycling hypoxia in tumor radiobiology and/or conferring radio resistance has been studied using animal models [80, 81]. There are few studies showing evidence of the existence of cycling hypoxia in human tumors. One such study conducted by Pigott et al. examined blood flow in various superficial human tumors, using implanted laser Doppler flow probe. In around 50 % of the lesions examined, fluctuations in the flux of red blood cells were observed to be more than a factor of 1.5 correlative to cycling hypoxia measured in animal models [82]. Another study conducted by Janssen et al. in head and neck cancer patients detected cycling hypoxia by immunohistochemistry [83]. However, all these indirect approaches to assess cycling hypoxia in human tumors are invasive and could not firmly establish any correlation between the overall oxygenation state of the tumors and the incidence of cycling hypoxia .
Methods for Evaluating Hypoxia
Clearly, the ability to identify and quantify tumor oxygenation status and energy metabolism has far-reaching implications in a wide range of medical settings. Most importantly, a clinically useful assay to measure hypoxia , firstly, must be able to distinguish normoxic regions from the ones that are hypoxic at a level relevant to tumor oxygen partial pressure (pO2) falling in the range of 5–15 mmHg. The ability to simultaneously image tumor oxygenation and metabolic profile can profoundly guide future therapies involving inclusion of radiosensitizers, hypoxia-directed cytotoxins, oxygen-enhanced gas mixtures such as carbogen (a mixture consisting of 95 % oxygen and 5 % carbon dioxide) [84], and hypoxia-activated prodrugs . Non-toxic prodrugs that generate active species in hypoxic tissue by selective bioreduction have now reached advanced clinical trials . Such hypoxia prodrugs mainly include tirapazamine [85], PR104 [86], and TH-302 [87]. In the early 1990s, hypoxia measurements were achieved by implanting properly calibrated, oxygen-sensitive electrodes (Eppendorf pO2 histograph) which directly measured pO2 in units of mmHg [88]. This technique had several practical disadvantages. It is limited to tumors that the probe can be easily accessed, and its invasive nature can cause tissue damage. However, this approach is still in use in the clinic. Other approaches such as immunohistochemistry of tumor tissue using extrinsic hypoxia-specific biomarker such as pimonidazole and intrinsic hypoxia biomarker such as carbonic anhydrase IX (CAIX) , VEGF receptor expression , and glucose transporter 1 (Glut1) are utilized to measure hypoxia [89]. These biomarker signatures show poor prognosis and are correlative to the extent of tumor hypoxia. However, the drawback of this approach is that it requires a biopsy, which is challenging and sometimes is not possible. Serum markers have also been evaluated to measure tumor hypoxia but with less success [90, 91]. Furthermore, sampled biomarkers are not able to evaluate spatial heterogeneity , which is often relevant to overall response and is essential for defining a radiation treatment field. Notably, all the above methods do not provide the longitudinal monitoring of hypoxia as the measurement is restricted to only a smaller sub-volume of a tumor. Noninvasive approaches have been instrumental in allowing serial imaging of hypoxia quantitatively and provide valuable information about cycling nature of hypoxia in both space and time. PET hypoxia imaging is noninvasive and routinely used in clinic . Due to the clinical significance of hypoxia imaging, an increasing number of hypoxia PET tracers are available and are being evaluated in the clinical setting. The first radionuclide detection of hypoxia in tumors was reported using 14C-misonidazole autoradiography [92]. Subsequently, two main tracer classes have been developed to specifically study hypoxia with PET. These tracers are 18F-labeled 2-nitroimidazole derivatives, such as [18F]-fluoromisonidazole ([18F]-FMISO) , [18F]-azomycinarabinoside [18F]-FAZA , [18F]-fluoroerythronitroimidazole [18F]-FETNIM , and Cu-labeled diacetyl-bis (N4-methylthiosemicarbazone) analogues. Among all these tracers , 18F-FMISO is the lead candidate and most extensively studied 2-nitroimidazole-based radiopharmaceutical PET tracer in the clinics. Clinical application of 18F-FMISO in radiotherapy planning and dose painting of different solid tumors is well described in Chap. 9. Despite its potential clinical application, 18F-FMISO imaging in rectal cancer was shown to be compromised by high nonspecific tracer accumulation in normoxic tissue [93]. Several other techniques to measure tumor hypoxia quantitatively and noninvasively are in preclinical development, namely, Overhauser MRI (OMRI), electron paramagnetic resonance imaging (EPRI) , and 19F MRI. Electron paramagnetic resonance (EPR) predominantly measures interstitial hypoxia. We describe here highly promising hypoxia imaging modalities that have gained immense attention in both preclinical and clinical setting .
DCE-MRI
Dynamic contrast-enhanced MRI is a powerful MRI technique to examine tissue perfusion profiles. It involves collecting a series of images rapidly following a bolus intravenous administration of the T1 contrast agents, typically gadolinium complexes. Following the bolus administration, these agents localize in the extravascular-extracellular space and are gradually cleared. The time-intensity features from these rapidly acquired sequences of images allow the determination of the microvasculature of the tumors . DCE-MRI has been applied for over a decade to extract functional information regarding the peripheral vascular system such as blood volume, blood flow, vascular permeability, as well as distribution volume and available interstitial space for the contrast agent. DCE-MRI acquires serial MR images before, during, and after the administration of an intravenous contrast agent such as low molecular weight, gadolinium-based (Gd-DTPA) contrast medium. DCE-MRI has grown with the development of anti-angiogenic and neoadjuvant strategies for treating cancer. Angiogenic inhibitors are known to reduce both the number of vessels (particularly non-functional vessels) and their permeability, which can be quantitatively imaged using DCE-MRI. In cervical cancer, DCE-MRI was shown to measure tumor hypoxia in good correlation to Eppendorf oxygen electrode and was an independent predictor of tumor recurrence and death than clinically accepted prognostic factors (e.g., stage, lymph node status, and histology) [94]. Newbold et al. demonstrated a statistically significant correlation between various dynamic contrast-enhanced MR imaging parameters [95], particularly K trans (which represents the permeability of blood vessels) and pimonidazole staining (an exogenous marker for hypoxia). DCE-MR imaging of head and neck squamous cell carcinoma and rectal cancer also has been used to successfully predict treatment response to chemoradiation therapy [96, 97]. DCE imaging also offers an exciting opportunity to predict the extent of normal tissue function post radiation. Radiation treatment can lead to vascular damage such as vessel dilation, endothelial cell death and apoptosis, microvessel hemorrhage, and eventually vessel occlusion affecting organs such as the brain, liver, and rectum [98–100]. Risk of damaging the normal tissue thereby hinders increasing the radiation dose for better tumor control or even cure. DCE-MRI can be used for early monitoring of vascular response to radiation treatments and predict the outcome of organ function after therapy, thereby selecting the patient who is resistant to radiation for higher dose, potentially leading to a better chance of tumor local control and better overall therapeutic outcome. DCE-MRI/CT thus offers promise of early assessment of tumor response to radiation therapy, opening a window for adaptively optimizing radiation therapy based upon functional alterations that occur earlier than morphological changes and enhancing radiotherapy therapeutic ratio . Although holding great promise, to date DCE-MRI and CT have yet to qualify to be a surrogate endpoint for radiation therapy assessment or for modifying treatment strategies in any prospective phase III clinical trial for any tumor site .
Related posts:
 Receptor Tyrosine Kinases as Targets for Enhancing Tumor Radiosensitivity
Histone Deacetylase Inhibitors and Tumor Radiosensitization
Receptor Tyrosine Kinases as Targets for Enhancing Tumor Radiosensitivity
Histone Deacetylase Inhibitors and Tumor Radiosensitization
 Combining Radiotherapy and Immunotherapy: Emerging Preclinical Observations of Lymphocyte Costimulatory and Inhibitory Receptor Modulation
 Radioprotection as a Method to Enhance the Therapeutic Ratio of Radiotherapy
 Novel Imaging for Treatment Planning or Tumor Response
 Stereotactic Body Radiation Therapy (SBRT) or Alternative Fractionation Schedules
Stay updated, free articles. Join our Telegram channel

Full access? Get Clinical Tree


