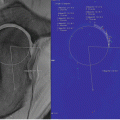
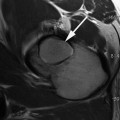
Fig. 17.1
T1-rho color map of hip hyaline cartilage superimposed over oblique sagittal anatomical image in normal (left) and arthritic hip (right). Mean T1-rho relaxation values: 32.37 ms in Control subject on the left; 36.18 ms, cam-FAI patient on right. Note the elevation of T1-rho relaxation values in the FAI subject, reflecting proteoglycan depletion, diffusely in the weight-bearing cartilage of the joint and most pronounced in the more anterior aspect
T1ρ MRI Technique
T1ρ MRI can be carried out on both 1.5 and 3.0 T systems. However, it should be noted that the T1ρ pulse sequence is not commercially available. The study is performed on a single hip at a time. A flexible coil is wrapped around the hip, with the patient supine and the leg fixed in neutral rotation. The T1ρ pulse sequence employs a spin-lock technique making it sensitive to low frequency chemical exchange processes between water molecules and the ECM [22, 40]. Typically the protocol is based on a gradient recalled echo sequence with a water excitation technique of fat suppression, with the sequence repeated several times at variable spin locking times. High spatial resolution imaging is required to allow for accurate cartilage segmentation, given how thin the hyaline cartilage may be. Offline image processing is required and hyaline cartilage is segmented manually, possibly semiautomated. Continuous, quantitative T1ρ relaxation times (continuous, quantitative values expressed in milliseconds (ms)) are generated based on the signal intensity of the pixels and mathematical algorithms [37, 38]. A T1ρ color map can be produced and is often registered to anatomic MRI images spatially matched to the T1ρ sequence to allow visual representation of the distribution of the T1ρ values, which are inversely related to the proteoglycan concentration.
One of the major limitations of the T1ρ sequence is that it imparts a relatively large amount of radiofrequency energy (quantified by specific absorption rate—SAR) into the soft tissues, which can lead to heating. All MRI scanners have inherent limiters that prevent SAR thresholds from being exceeded, although this may limit the robustness of the T1ρ protocol and thus image quality. T1ρ MRI would be best on high field strength MRI scanners as the higher signal-to-noise ratio can generate higher spatial resolution images in shorter times. However, higher field strength also results in higher SAR values.
Comparison to Other Cartilage Mapping Techniques
In addition to T1ρ, other more established MRI techniques for evaluating the biochemical composition and structure of hyaline cartilage have been studied, at both the basic science and clinical levels. Delayed gadolinium-enhanced MRI of cartilage (dGEMRIC) is another PG-sensitive, proton MRI-based technique. However, it requires the intravenous injection of a gadolinium contrast agent followed by a regimented exercise protocol prior to imaging [6, 41]. T2 [42] and T2* [43, 44] relaxation time mapping has also been investigated as a non-contrast technique. However, they are predominantly sensitive to changes in collagen content and organization [45]. Recent studies have recognized that T1ρ and T2 may provide complimentary information, predominantly but not necessarily exclusively about, PG and collagen, respectively [28, 46]. T1ρ may be preferred over T2 mapping for several reasons. PG depletion from hyaline cartilage is believed to be one of earliest steps in the evolution of OA, preceding collagen structure alteration [47]. T1ρ is less susceptible to artifacts such as background inhomogeneity, susceptibility variations, diffusion-induced signal losses, and magic angle artifact [27, 32]. T1ρ has also been found to have greater reproducibility [32, 38] and larger dynamic range within cartilage [27, 48] and it shows larger differences between normal and OA subjects [28, 48] than does T2. Although the non-contrast T1ρ MRI cartilage mapping is promising, further studies are required before confirming it as an equally efficacious alternative to the more established dGEMRIC.
Challenges of Cartilage Mapping in the Hip
There are inherent challenges to biochemical imaging of hip cartilage compared to other joints such as the knee, upon which much of the initial research on cartilage mapping was based. Hip hyaline cartilage is much thinner, especially in the periphery of the joint [16]. As well, the hip joint is grossly spherical with resultant curvature of the joint space and articular surfaces, such that planar acquisition slices can be susceptible to volume averaging artifacts. The articular surfaces of the acetabulum and femoral head are very closely opposed to one another, making spatial separation of the two surfaces challenging. For this reason several previous studies on cartilage mapping in the hip performed the analysis on a combined bilayer, including both the acetabular and femoral surfaces together [38]. However, more recently, studies have attempted to resolve the two cartilage surfaces [35, 37]. The advent of high field scanners (3.0 T and higher), 3D volume acquisitions, and continual advances in scanner hardware and surface coil technology will allow for higher resolution scanning with higher signal-to-noise ratios and shorter scan times facilitating this cartilage layer separation [18].
Conclusion
T1ρ MRI is a promising noninvasive and non-contrast-based MRI cartilage mapping technique. Along with other imaging techniques including dGEMRIC, T2, and T2* mapping, it may be able to fulfill the rapidly growing medical demand for a reliable, objective, noninvasive, and quantitative investigation of cartilage status. At present, most medical and surgical therapies for OA are only palliative and concentrate on the treatment of symptoms. However, advanced biochemical imaging techniques will detect changes much earlier, possibly before any symptoms or significant joint damage occurs. This may lead to a shift in the management of OA, from palliative, to more preventative and disease modifying. Furthermore, these novel protocols may serve as a future tool in monitoring the progression of cartilage changes and the responses to therapy, in both the clinical and research environments [18].
References
1.
2.
Felson DT, Nevitt MC. Epidemiologic studies for osteoarthritis: new versus conventional study design approaches. Rheum Dis Clin North Am. 2004;30(4):783–97, vii.
3.
4.
6.
7.
8.