and Dorin Comaniciu1
(1)
Imaging and Computer Vision, Siemens Corporate Technology, Princeton, NJ, USA
Abstract
Marginal Space Learning (MSL) has been extensively tested on multiple anatomical structure detection and segmentation problems in different medical imaging modalities. In this chapter, we provide a review of its applications in the published literature. We first review applications on “pure” detection problems, followed by those combining detection, segmentation, and tracking.
8.1 Introduction
Marginal Space Learning (MSL) is a generic and open framework for efficient object detection and segmentation. It has been extensively tested on multiple anatomical structure detection/segmentation problems in different medical imaging modalities. In this chapter, we provide a literature review of the MSL applications in medical imaging. In principle, the MSL can also be applied to detect objects in non-medical images, however, such potential applications are not the focus of this book.
A few of the applications have already been discussed in the previous chapters to illustrate various developments of the MSL. To make this chapter self-contained, these applications are included. In some applications, variants of MSL are developed to further improve the detection speed and robustness. For example, iterated MSL is presented in Sect. 8.2.9 to extend MSL to the detection of multiple instances of the same object type (e.g., intervertebral disks). Hierarchical Detection Network (HDN) (a.k.a. hierarchical MSL) is presented in Sect. 8.2.17 to perform MSL based object detection at multiple resolutions on an image pyramid . The detected object candidates at a lower resolution are propagated to a higher resolution to achieve more efficient and robust detection. Many imaging modalities can now generate a dynamic sequence of 3D volumes (3D+t) to analyze the motion of an anatomical structure. Section 8.3.7 presents a joint spatio-temporal MSL to detect the motion trajectory of the object across volumes. It is more robust than the independent detection and the traditional detection-followed-by-tracking approaches. In other applications, the MSL is only a component, for example, by providing an estimate of the bounding box of a structure, and the major contributions of those publications may be on other tasks, such as the segmentation and tracking of the target structure. We include such work in this review solely to illustrate the generalization capability of the MSL.
We first review applications on “pure” detection problems, followed by those combining detection, segmentation and tracking.
8.2 Detection of Devices and Anatomical Structures
8.2.1 Ultrasound Transducer Detection in Fluoroscopy

Fig. 8.1
Automatic transesophageal echocardiography transducer detection on 2D fluoroscopy images. The detected in-plane transformation (two translation, one rotation, and two anisotropic scaling parameters) is represented as an oriented white circle. Image courtesy of Tobias Heimann
X-ray fluoroscopy is an imaging modality used to guide minimally invasive transcatheter interventions, such as Transcatheter Aortic Valve Implantation (TAVI) and mitral valve repair . Although fluoroscopy provides a large view of the operating field, it has limitations due to the weak visibility of soft tissues and the overlapping of 3D structures on a 2D projection.
For cardiac interventions, 3D Transesophageal Echocardiography (TEE) is increasingly used as a supplementary imaging modality for its good capability to delineate soft tissues. Each imaging modality is captured in its own coordinate system and displayed separately. Fusion of both imaging modalities into a common coordinate system can provide a better visual guidance during cardiac interventions. Since the TEE probe is captured in fluoroscopy (Fig. 8.1), automatic estimation of its 3D pose helps to determine the transformation between two imaging modalities. The 3D pose of a TEE probe can be decomposed to in-plane transformation and out-of-plane rotation. In [42], the in-plane transformation of the TEE probe (which has five degrees of freedom and can be represented as an oriented bounding box) is estimated efficiently using the MSL. The out-of-plane rotation is then determined by matching against a library of pre-calculated 2D projects of the TEE probe along different orientations.
Since it is time consuming to collect and annotate a large training set necessary to build a robust detection system, synthesized data can be generated to enrich the training set [20].
Publications
Mountney, P., Ionasec, R., Kaizer, M., Mamaghani, S., Wu, W., Chen, T., John, M., Boese, J., Comaniciu, D.: Ultrasound and fluoroscopic images fusion by autonomous ultrasound probe detection. In: Proc. Int’l Conf. Medical Image Computing and Computer Assisted Intervention, vol. 2, pp. 544–551 (2012)
Heimann, T., Mountney, P., John, M., Ionasec, R.: Learning without labeling: Domain adaptation for ultrasound transducer localization. In: Proc. Int’l Conf. Medical Image Computing and Computer Assisted Intervention, vol. 3, pp. 49–56 (2013)
8.2.2 Balloon Marker Detection in Fluoroscopy for Stent Enhancement
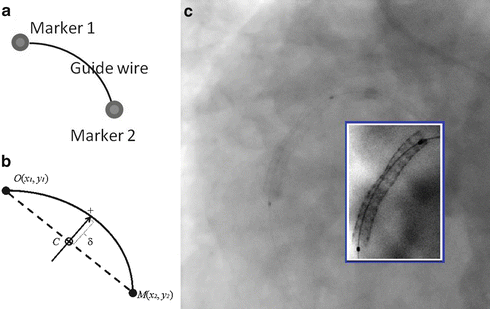
Fig. 8.2
Balloon marker detection in a fluoroscopy sequence for stent enhancement. (a) A simplified model composed of two balloon markers with a guide wire connecting them. (b) Representation of the model with five parameters (x 1, y 1, x 2, y 2, δ). (c) An image frame from a fluoroscopy sequence with an in-box showing the motion compensated enhancement of a stent. Image courtesy of Xiaoguang Lu. ©2011 IEEE. Reprinted, with permission, from Lu, X., Chen, T., Comaniciu, D.: Robust discriminative wire structure modeling with applications to stent enhancement in fluoroscopy. In: Proc. IEEE Conf. Computer Vision and Pattern Recognition, pp. 1121–1127 (2011)
Lu et al. [35] presented an interesting application of the MSL for stent enhancement from a fluoroscopy sequence . Stent thrombosis and re-stenosis are major complications for patients undergoing Percutaneous Coronary Intervention (PCI) and they are often associated with stent under-expansion. Real time fluoroscopy is the image modality to guide the deployment of a stent via a balloon. Due to motion artifacts (cardiac motion plus respiratory motion ), a stent is barely visible as shown in Fig. 8.2c. Low visibility prevents confident quantification of stent under-expansion. If the motion can be estimated for each frame, the stent can be significantly enhanced by averaging multiple frames after motion compensation as shown in the in-box of Fig. 8.2c.
In [35], two balloon markers are automatically detected to provide motion estimation. As markers appear as tiny dots on fluoroscopy, independent detection often results in a lot of false positive detections from confounding structures. The two markers are connected by a guide wire; therefore, joint detection of markers and the guide wire can remove false positive detections. The whole object is parameterized as five parameters (x 1, y 1, x 2, y 2, δ), with (x 1, y 1) for the position of one marker, (x 2, y 2) for the other marker, and δ representing the shape of the guide wire, as shown in Fig. 8.2b. Since it is time consuming to estimate five parameters simultaneously, the MSL principle is applied to estimate the model parameters sequentially. First, the position of the balloon markers is detected (using 2D Haar wavelet features) resulting in a few candidates. Each pair of marker candidates is validated after incorporating parameter δ for the guide wire shape. The steerable features [70] are adapted with a special sampling pattern capturing the guide wire shape for the final validation. The method is evaluated on a large database with 263 fluoroscopic sequences and the stent enhancement succeeds in 259 sequences (98.5 %). Since the MSL is used, the marker detection is efficient, taking about 0.05 s for a single frame. The whole processing time for a typical sequence with 100 frames is about 5 s.
The above method works in a play-back mode, where a fluoroscopic sequence is captured and one static enhanced stent view is generated. In a follow-up work [6], the motion of detected balloon marker is tracked in real time to generate an enhanced stent in the original context for each fluoroscopic frame. Since the fluoroscopic sequence is captured with a fixed orientation, only one 2D projection view of the enhanced stent can be generated using the above approaches [6, 35], which may not be enough to exam stent under-expansion. The work was further extended to rotational fluoroscopy in [57]; therefore, the 3D shape of the stent without motion artifacts can be reconstructed.
Publications
Lu, X., Chen, T., Comaniciu, D.: Robust discriminative wire structure modeling with applications to stent enhancement in fluoroscopy. In: Proc. IEEE Conf. Computer Vision and Pattern Recognition, pp. 1121–1127 (2011)
Chen, T., Wang, Y., Durlak, P., Comaniciu, D.: Real time assistance for stent positioning and assessment by self-initialized tracking. In: Proc. Int’l Conf. Medical Image Computing and Computer Assisted Intervention, vol. 1, pp. 405–413 (2012)
Wang, Y., Chen, T., Wang, P., Rohkohl, C., Comaniciu, D.: Automatic localization of balloon markers and guidewire in rotational fluoroscopy with application to 3D stent reconstruction. In: Proc. European Conf. Computer Vision, pp. 428–441 (2012)
8.2.3 Pigtail Catheter Tip Detection in Fluoroscopy
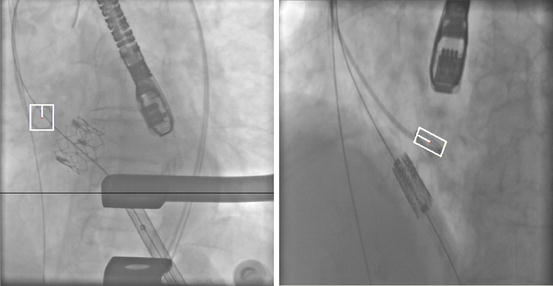
Fig. 8.3
Pigtail catheter tip detection results in two fluoroscopic images. Image courtesy of Stratis Tzoumas. ©2012 SPIE. Reprinted, with permission, from Tzoumas, S., Wang, P., Zheng, Y., John, M., Comaniciu, D.: Robust pigtail catheter tip detection in fluoroscopy. In: Proc. of SPIE Medical Imaging, vol. 8316, pp. 1–8 (2012)
Motion compensated overlay of a 3D aorta model on fluoroscopy is helpful to guide Transcatheter Aortic Valve Implantation (TAVI) . A pigtail catheter is often inserted into the aortic valve leaflet pocket for contrast agent injection to highlight the valvular structure when necessary. Once the pigtail catheter tip is tightly attached to the aortic valve, it has the same motion as the valve. Automatic detection and tracking of the pigtail catheter tip can help to dynamically update the overlay of a 3D aortic valve model, which is extracted from pre-operative Computed Tomography (CT) or intra-operative C-arm CT [78]. MSL can be exploited to detect the catheter tip on a 2D fluoroscopic frame as an oriented bounding box [50] and the tip position in the following frames can be tracked via online learning [56].
A pigtail catheter tip forms a circular shape. However, depending on the projection angle of fluoroscopy, the shape varies from a circular structure to an elongated ellipse, or even degenerating to a line on a 2D projection view, as shown in Fig. 8.3. Therefore, a direct application of MSL achieves a moderate success rate. The MSL detection pipeline is revised in [50] to further improve the detection rate by splitting the catheter tip into three shape categories: a circular shape, an elongated ellipse, and a line. A combined position detector for all shape categories is trained for early rejection of easy negative samples. Different position-orientation and position-orientation-scale detectors are then trained for different shape categories. During detection, an estimated position candidate is forwarded to the detectors of each shape category. The final detection is achieved by cluster analysis of all estimated bounding-box candidates. Thus, by treating each shape category differently, the detection accuracy is increased.
Publications
Tzoumas, S., Wang, P., Zheng, Y., John, M., Comaniciu, D.: Robust pigtail catheter tip detection in fluoroscopy. In: Proc. of SPIE Medical Imaging, vol. 8316, pp. 1–8 (2012)
Wang, P., Zheng, Y., John, M., Comaniciu, D.: Catheter tracking via online learning for dynamic motion compensation in transcatheter aortic valve implantation. In: Proc. Int’l Conf. Medical Image Computing and Computer Assisted Intervention, vol. 2, pp. 17–24 (2012)
8.2.4 Catheter Detection and Tracking in Fluoroscopy

Fig. 8.4
Catheter tracking results in fluoroscopic image sequences. The tracked catheter tips and electrodes are indicated by white circles. (a) Coronary sinus catheter. (b) Circumferential mapping catheter. (c) Ablation catheter. Image courtesy of Wen Wu. ©2011 IEEE. Reprinted, with permission, from Wu, W., Chen, T., Barbu, A., Wang, P., Strobel, N., Zhou, S.K., Comaniciu, D.: Learning-based hypothesis fusion for robust catheter tracking in 2D X-ray fluoroscopy. In: Proc. IEEE Conf. Computer Vision and Pattern Recognition, pp. 1097–1104 (2011)
Atrial fibrillation is the most common cardiac arrhythmia, characterized by fast irregular heart beats of the atria. Catheter based ablation is used to treat atrial fibrillation when pharmaceutic therapy is not effective. During the ablation procedure, multiple catheters (e.g., coronary sinus catheter, circumferential mapping catheter, and ablation catheter as shown in Fig. 8.4) are inserted into the heart to facilitate the intervention. The intervention is guided under real time fluoroscopy . However, fluoroscopy is only good at visualizing bony and metal structures, while the heart tissues are hardly visible.
A 3D heart model extracted from 3D imaging modalities such as Computed Tomography (CT) and Magnetic Resonance Imaging (MRI), is often overlaid onto fluoroscopy for visual guidance. A static overlay only provides limited help since the operating scene is subject to cardiac and respiratory motion. When attached to a cardiac structure (e.g., coronary sinus ), a catheter has a similar motion pattern as the heart; therefore, real time tracking of the catheter can be used to generate a dynamic overlay of the 3D heart model onto fluoroscopy for better visual guidance (similar to the pigtail catheter based motion compensation presented in Sect. 8.2.3).
Wu et al. [62] presented a robust system to track the tip and electrodes of a catheter. The initial position of the tip and electrodes is specified on the first frame and the motion is tracked in a tracking-by-detection framework in the following frames. Since the size of a catheter is less important, the tip and electrodes are detected as oriented points (x, y, θ). MSL is exploited to detect them in two steps, position estimation followed by position-orientation estimation. The MSL based oriented point detectors generate multiple candidates for the catheter tip and electrodes, which can be fused with other imaging cues to build a robust tracking system. Figure 8.4 shows tracking results of several catheters. The tracking speed is further increased using Graphics Processing Units (GPU) [63].
Publications
Wu, W., Chen, T., Barbu, A., Wang, P., Strobel, N., Zhou, S.K., Comaniciu, D.: Learning-based hypothesis fusion for robust catheter tracking in 2D X-ray fluoroscopy. In: Proc. IEEE Conf. Computer Vision and Pattern Recognition, pp. 1097–1104 (2011)
Wu, W., Chen, T., Strobel, N., Comaniciu, D.: Fast tracking of catheters in 2D fluoroscopic images using an integrated CPU-GPU framework. In: Proc. IEEE Int’l Sym. Biomedical Imaging, pp. 1184–1187 (2012)
8.2.5 Landmark Detection and Scan Range Delimitation in Topogram
A topogram is an X-ray image acquired in a CT scanner to define a precise scan range of a target anatomical structure for the following 3D scanning and image reconstruction. Traditionally, the scan range is manually determined by a clinician. Automatic detection of the scan range can reduce the scan time, therefore increasing the patient throughput. Furthermore, it can reduce the inter-user variability. Figure 8.5 shows five scan ranges for different body regions: abdomen, heart, pelvis, liver, and thorax. However, automatic scan range detection is challenging because of (1) overlap of anatomical structures on a 2D projection image, (2) variations in patients’ age, obesity, and pathology, (3) missing body part (up to half of the target body region may be out of the field of view), and (4) low signal-to-noise ratio (since a topogram is acquired with a low radiation dose).
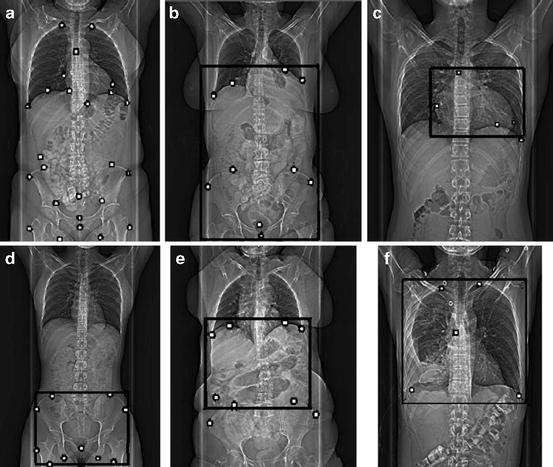

Fig. 8.5
Topogram images with predefined (a) anatomical landmarks (black dots) and five scan ranges for different body regions (black boxes): (b) abdomen, (c) heart, (d) pelvis, (e) liver, and (f) thorax. Image courtesy of Wei Zhang. ©2010 SPIE. Reprinted, with permission, from Zhang, W., Mantlic, F., Zhou, S.K.: Automatic landmark detection and scan range delimitation for topogram images using hierarchical network. In: Proc. of SPIE Medical Imaging, vol. 7623, pp. 1–8 (2010)
Zhang et al. [68] proposed an automatic and efficient method to detect scan ranges using a hierarchical network with a combination of body region detection and landmark detection. Each body region is defined as an axially-aligned box with four pose parameters (two for position and two for scales). The MSL is exploited to detect the body region box in two steps: position estimation followed by position-scale estimation. Each body region detector generates multiple box candidates and a body region network is built and optimized to select the best candidate for each body region using the context information in the network. The body region detection is robust if more than 90 % of the region is inside the field of view.
However, the algorithm is demanded to tolerate up to 50 % missing part. As a result, the solution has to exploit the local image context through which an anatomical landmark can be detected more robustly under occlusion. A set of landmarks are predefined (as shown in Fig. 8.5a) and associated with different body regions (as shown in Fig. 8.5b–f). The initial landmark position is inferred from the estimated body region and then refined under its own detector. Even though only the position of a landmark is needed, a landmark is detected as a box to exploit the embedded scale information in a local image patch, which is similar to the Left Ventricle (LV) landmark detection in [80]. Again, MSL is used to train the landmark detectors. Similar to the body region network, the landmarks associated with the same region also form a local network, which is then optimized to search for the optimal configuration of the landmarks. The proposed method is efficient, taking about four seconds to detect five body regions. Its robustness has been demonstrated with quantitative evaluation on about 1,000 topogram images.
Publication
Zhang, W., Mantlic, F., Zhou, S.K.: Automatic landmark detection and scan range delimitation for topogram images using hierarchical network. In: Proc. of SPIE Medical Imaging, vol. 7623, pp. 1–8 (2010)
8.2.6 Left and Right Ventricle Detection in 2D MRI
The 2D Magnetic Resonance Imaging (MRI) technology is often used for Left Ventricle (LV) quantification. Detection of the LV in an MRI image is a prerequisite for functional measurement (e.g., measuring the LV volume and ejection fraction ). However, due to the large variations in the orientation, size, shape, and image intensity of the LV, automatic detection of the LV on a long-axis MRI image is challenging. We adapted the MSL to detect the LV on a long-axis MRI image, by modeling it as an oriented bounding box (Fig. 8.6) [37, 79, 80]. This was the first application of the MSL on 2D object detection. The work was later on extended to detect Right Ventricle (RV) landmarks (e.g, the RV insertion points and RV lateral point) on short-axis MRI images [36].
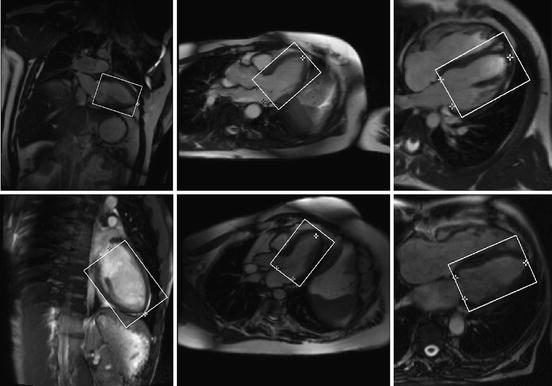

Fig. 8.6
Detection results of the left ventricle (the oriented bounding boxes) and its landmarks (white stars for the apex and dark stars for two annulus points on the mitral valve) on 2D MRI images
The LV bounding box detector alone is not robust enough to accommodate variations in the 2D plane rotation around the LV axis, which translate into large variability of the LV appearance and shape, and variability in the surrounding tissue. Additionally, we also needed to detect several LV landmarks, such as the LV apex and two mitral valve annulus points . If we combine the detected candidates from the LV bounding box detector and landmark detectors, it is possible to further improve the system robustness. Initially, we proposed a simple voting based approach [79] , which could improve the overall robustness, compared to a single LV detector. Later on, we developed a ranking-based strategy , more systematic and theoretically founded [80]. Experiments show that the ranking-based aggregation approach can significantly reduce the detection outliers.
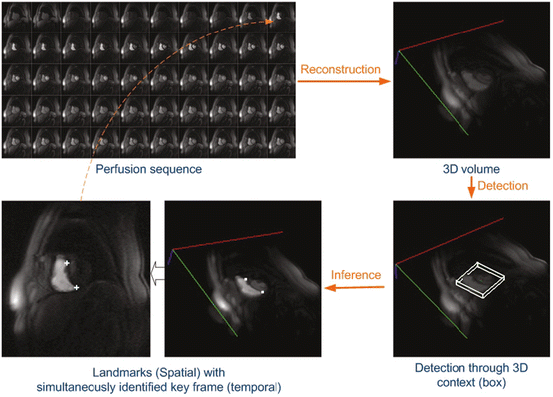
Fig. 8.7
Joint landmark detection and key-frame identification. RV insertion landmarks are used as an example. Image courtesy of Xiaoguang Lu. ©2011 SPIE. Reprinted, with permission, from Lu, X., Xue, H., Jolly, M.P., Guetter, C., Kellman, P., Hsu, L.Y., Arai, A., Zuehlsdorff, S., Littmann, A., Georgescu, B., Guehring, J.: Simultaneous detection of landmarks and key-frame in cardiac perfusion MRI using a joint spatial-temporal context model. In: Proc. of SPIE Medical Imaging, pp. 1–7 (2011)
Perfusion MRI is an important imaging modality for the diagnosis and quantification of myocardium infarction. In a typical perfusion protocol, a sequence of 2D short-axis images of the LV and RV are scanned to monitor the perfusion of the contrast agent . The short-axis images correspond to the same cardiac phase; therefore, the sequence is free of or with minimal cardiac motion . Automatic detection of the landmarks (e.g., the LV blood pool center and two RV insertion points) in a perfusion scan is challenging due to the variation of contrast. In addition, we also need to select two key frames that have the optimal amount of contrast to delineate the LV and RV, respectively. Lu et al. [41] proposed a method for joint spatio-temporal detection of key frames and landmarks. The 2D short-axis sequence is first stacked together to form a 3D volume (different to a normal 3D volume since the z-axis denotes the temporal dimension in this spatio-temporal volume). A 3D context box is defined, containing three position parameters (X, Y, Z), one rotation (θ), and three scales (S x , S y , S z ). Here, Z is the position of the key frame in the sequence and (X, Y ) is the position of the landmarks on the key frame. The MSL is used to detect the 3D context box. Using joint spatio-temporal detection, the key frame and landmarks are detected simultaneously. The solution is more robust than independent landmark detection on each 2D images since the temporal information is also incorporated into the detection. Figure 8.7 shows the detection workflow.
Publications
Zheng, Y., Lu, X., Georgescu, B., Littmann, A., Mueller, E., Comaniciu, D.: Automatic left ventricle detection in MRI images using marginal space learning and component-based voting. In: Proc. of SPIE Medical Imaging, vol. 7259, pp. 1–12 (2009)
Zheng, Y., Lu, X., Georgescu, B., Littmann, A., Mueller, E., Comaniciu, D.: Robust object detection using marginal space learning and ranking-based multi-detector aggregation: Application to automatic left ventricle detection in 2D MRI images. In: Proc. IEEE Conf. Computer Vision and Pattern Recognition, pp. 1343–1350 (2009)
Lu, X., Georgescu, B., Jolly, M.P., Guehring, J., Young, A., Cowan, B., Littmann, A., Comaniciu, D.: Cardiac anchoring in MRI through context modeling. In: Proc. Int’l Conf. Medical Image Computing and Computer Assisted Intervention, vol. 1, pp. 383–390 (2010)
Lu, X., Xue, H., Jolly, M.P., Guetter, C., Kellman, P., Hsu, L.Y., Arai, A., Zuehlsdorff, S., Littmann, A., Georgescu, B., Guehring, J.: Simultaneous detection of landmarks and key-frame in cardiac perfusion MRI using a joint spatial-temporal context model. In: Proc. of SPIE Medical Imaging, pp. 1–7 (2011)
8.2.7 Cardiac Measurements from 2D Ultrasound
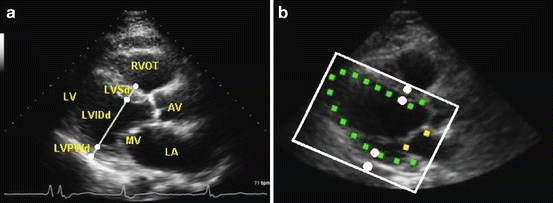
Fig. 8.8
Automatic cardiac measurements in a 2D ultrasound of a parasternal long-axis view of the Left Ventricle (LV). (a) Illustration of the cardiac measurements at the End-Diastolic (ED) phase, including LV septum thickness at ED (LVSd), LV internal dimension at ED (LVIDd), and LV posterior wall thickness at ED (LVPWd). All three measurements are calculated on a line defined by four landmarks (white circles). The meanings of the text labels on the image are as follows: LV for the left ventricle, LA for the left atrium, AV for the aortic valve, MV for the mitral valve, and RVOT for the right ventricular outflow tract, respectively. (b) Landmark detection (white circles) constrained by the detected LV box (white) and segmented endocardium (small filled rectangles). Image courtesy of JinHyeong Park. ©2012 SPIE. Reprinted, with permission, from Park, J., Feng, S., Zhou, K.S.: Automatic computation of 2D cardiac measurements from B-mode echocardiography. In: Proc. of SPIE Medical Imaging, vol. 8315, pp. 1–11 (2012)
Ultrasound is one of the main modalities to assess heart function since it is widely available, cost effective, real-time and free of radiation. Park et al. [43] presented a system to automatically calculate cardiac measurements of the Left Ventricle (LV) , including LV septum thickness (LVS), LV internal dimension (LVID), and LV posterior wall thickness (LVPW), on a dynamic B-mode ultrasound sequence. Each measurement can be calculated separately on the End-Diastolic (ED) and End-Systolic (ES) phases, resulting in a total of six measurements. All are measured on a line defined by four landmarks, as shown in Fig. 8.8a. However, it is difficult to detect those four landmark points by only observing the local region around the points because an ultrasound image is subject to noise and signal dropout. A hierarchical framework is presented to detect the landmarks by first examining a global context and then focusing on a local context. An oriented LV box is first detected using the MSL and then the LV endocardium is segmented using shape inference, as shown in Fig. 8.8b. The position of each landmark is estimated and refined, and the final landmark position is validated in a pseudo anatomic M-mode image generated by accumulating the same line image in a dynamic B-mode sequence to incorporate the temporal information.
Publication
Park, J., Feng, S., Zhou, K.S.: Automatic computation of 2D cardiac measurements from B-mode echocardiography. In: Proc. of SPIE Medical Imaging, vol. 8315, pp. 1–11 (2012)
8.2.8 Mid-Sagittal Plane Detection in 3D MRI
It is important to register the MRI datasets into a common coordinate system and establish correspondences between similar anatomical landmarks. This process of spatial normalization is required in neuro-science multi-subject studies or in oncology, for follow-up exams. Although the brain exhibits most of the time a regular structure, the presence of brain tumors and various deformations create a challenge for achieving a robust spatial normalization. Let us consider for example the Mid-Sagittal Plane (MSP) alignment. A maximum error of about 1∘ is often clinically required for MSP plane orientation estimation, which is quite restrictive.
In order to achieve such accuracy, we combine the pose estimation and refinement of the corresponding landmarks. In [45], we first use the MSL to roughly estimate the bounding box of five landmarks on the MSP plane, i.e., the Crista Galli (CG), the tip of the Occipital Bone (OB), the Anterior of the Corpus Callosum (ACC), the Posterior of the Corpus Callosum (PCC) and a landmark in the brain stem (STEM), as shown in Fig. 8.9a. The MSP box detection results in a plane orientation error a bit larger than 3. 0∘. We then estimate the rough position of each landmark from the bounding box and each landmark is further refined in a small neighborhood around its initial position, using a dedicated landmark detector . Finally, a plane is fitted to the five detected landmarks using the least-squares method, which significantly improves the MSP detection accuracy.
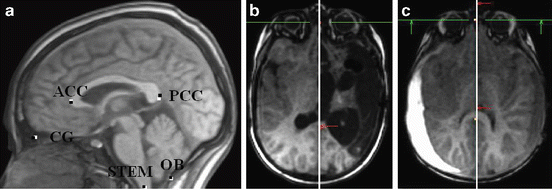

Fig. 8.9
Detection of the Mid-Sagittal Plane (MSP) and five plane landmarks in 3D MRI volumes. (a) Five landmarks on the MSP. The automatic detection and ground truth are shown in white and black dots, respectively. (b) and (c) Automatically detected MSP (white vertical lines) for two pathological cases. Image courtesy of Alexander Schwing
To validate this approach, an experiment is conducted on 509 volumes (of 200×200×150 voxels) coming from patients of different gender and ages with various neurological disorders. We achieve 1. 09∘ error in determining the plane orientation, at the same level of the inter-observer variability. The center of the mid-sagittal plane represented by the mass center of the five landmarks is detected with an error less than 2 mm.
Publication
Schwing, A. and Zheng, Y.: Reliable extraction of the mid-sagittal plane in 3D brain MRI via hierarchical landmark detection. In: Proc. IEEE Int’l Sym. Biomedical Imaging, pp. 1–4 (2014)
8.2.9 Intervertebral Disk Detection in 3D MRI/CT
There are a few applications for which we do need to detect a variable number of instances of the same anatomical structure, such as intervertebral disks, lymph nodes (see Sect. 8.2.11), or ovarian follicles (see Sect. 8.3.14). Kelm et al. [28, 29] presented an application of the MSL to detect the intervertebral disks in a 3D MRI or CT volume. A healthy subject has 24 vertebrae that can be grouped into three segments, called the cervical, thoracic, and lumbar segments. The shape of vertebrae changes gradually along the spinal column and neighboring vertebrae are similar to each other. It is challenging to distinguish and label neighboring vertebrae without considering the entire global structure of the spine, which may not be completely available in a volume with a limited field of view as shown in Fig. 8.11c. Therefore, instead of training 24 vertebrae detectors with one dedicated to each vertebra, three detectors are trained with one for each spinal segment (i.e., cervical, thoracic, and lumbar segments). The cervical spine disk detector should be able to detect all instances of the cervical vertebrae. The same is true for the other two disk detectors.
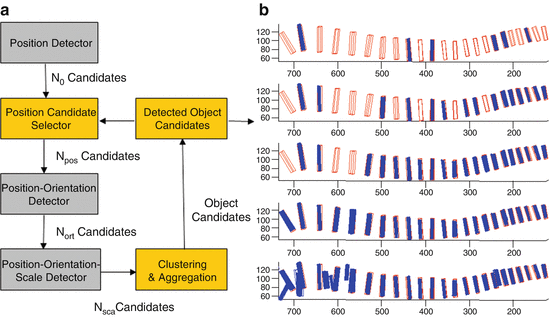
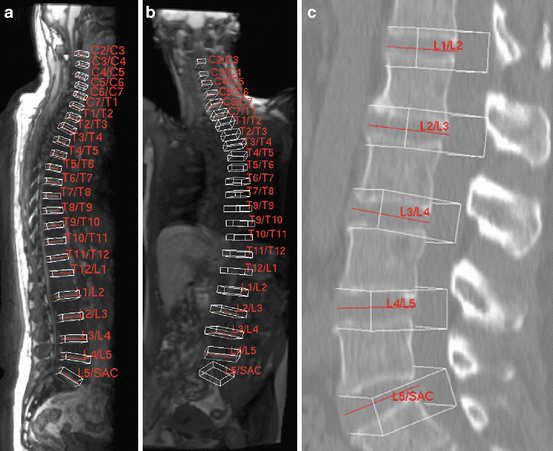

Fig. 8.10
Iterated marginal space learning for intervertebral disk detection. (a) Workflow. (b) Detected disks after each iteration. The ground truth is labeled as empty boxes and the detection is labeled as filled boxes. Image courtesy of Michael Kelm

Fig. 8.11
Detected and labeled intervertebral disks. (a) MRI volume of a healthy subject. (b) MRI volume of a subject with a twisted spine. (c) CT volume of a lumbar spine. Image courtesy of Michael Kelm
The MSL is subject to the sample concentration problem when applied for detecting multiple disk instances, the estimated candidates being concentrated to a few salient disks. Figure 8.10a shows the workflow of iterated MSL [28, 29], which elegantly solves the sample concentration problem. After position detection, we keep N 0 candidates and only the top N pos < N 0 candidates are propagated to the following MSL detection pipeline to detect some object instances. The detected instances are then used to prune the remaining N 0 − N pos position candidates by removing those candidates close to the already detected instances. The top N pos remaining position candidates are then propagated to detect more object instances. The process is iterated until there are no more position candidates. Iterated MSL overcomes the sample concentration issue of the original MSL and maintains its efficiency at the same time. As shown in Fig. 8.10b, more and more object instances are detected after each iteration.
Iterated MSL detects almost all true disks with a few false detections. A graph model is further used to remove false detections and assign a label to each disk by considering the anatomical constraint of the spine. Figure 8.11 shows a few examples of detected and labeled intervertebral disks in both MRI and CT. Experimental results based on 42 MR volumes show that the resulting system achieves superior accuracy, being also the fastest system of its kind in the literature. On average, the disks of a whole spine are detected in 11.5 s with 98.6 % sensitivity and 0.073 false positive detections per volume. An average position error of 2.4 mm and angular error of 3. 9∘ are achieved. On the CT data a comparable sensitivity of 98.0 % with 0.267 false positives per volume is achieved.
Alternatively, the sample concentration problem can be solved by cluster analysis on the position candidates, as demonstrated for the detection of lymph nodes (Sect. 8.2.11) and ovarian follicles (Sect. 8.3.14).
Publications
Kelm, B.M., Zhou, S.K., Suehling, M., Zheng, Y., Wels, M., Comaniciu, D.: Detection of 3D spinal geometry using iterated marginal space learning. In: Proc. MICCAI Workshop Medical Computer Vision — Recognition Techniques and Applications in Medical Imaging, pp. 96–105 (2010)
Kelm, B.M., Wels, M., Zhou, S.K., Seifert, S., Suehling, M., Zheng, Y., Comaniciu, D.: Spine detection in CT and MR using iterated marginal space learning. Medical Image Analysis 17(8), 1283–1292 (2013)
8.2.10 Osteolytic Spinal Bone Lesion Detection in CT
Wels et al. [59] presented an adapted MSL method for the detection of osteolytic spinal bone lesions in 3D CT. CT is an important imaging modality to detect and analyze spinal bone lesions, helping to quantify metastasis progression or response to therapy over time. However, manual identification of spinal bone lesions from 3D CT data is a challenging and labor-intensive task even for experienced radiologists. The reading process is subject to intra- and inter-user variability. A computer aided detection system can improve sensitivity and reduce reading variability.
To reduce the false positive rate, the vertebral body is detected first to constrain the search for osteolytic spinal bone lesions. Furthermore, each vertebral body is normalized to a standard orientation to reduce the variations of the extracted image features for the following lesion detection. The vertebral body bounding box can be detected efficiently using MSL, although for evaluation of the lesion detection performance, a manually annotated bounding box is used in [59]. The orientation of a lesion is less important than the center and extension of the lesion; therefore, the adapted MSL detection pipeline has only two stages: position (center) estimation and position-scale estimation. Due to the large variations of a lesion in appearance and shape, the lesion center detector is further composed of three sequential classifiers trained with more and more descriptive (and also more computationally expensive) image features.
A mean detection sensitivity of 75 % at a false positive rate of 3.0 per volume is achieved, close to be clinically applicable for screening examinations. Figure 8.12 shows one exemplary detection result.
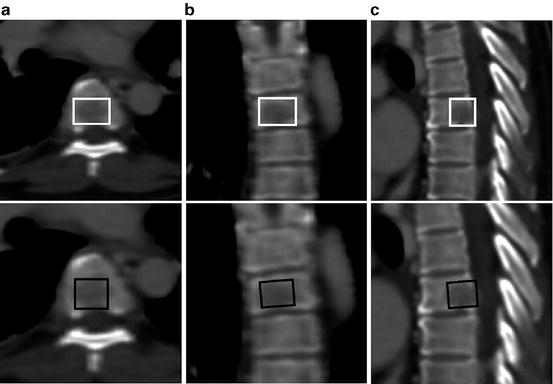

Fig. 8.12
Detection of an osteolytic spinal bone lesion in (a) axial, (b) coronal, and (c) sagittal views. The first row shows the ground-truth annotation in white. The second row shows the detection result in black. Image courtesy of Michael Wels. ©2012 SPIE. Reprinted, with permission, from Wels, M., Kelm, B.M., Tsymbal, A., Hammon, M., Soza, G., Suehling, M., Cavallero, A., Comaniciu, D.: Multi-stage osteolytic spinal bone lesion detection from CT data with internal sensitivity control. In: Proc. of SPIE Medical Imaging, vol. 8315, pp. 1–8 (2012)
Publication
Wels, M., Kelm, B.M., Tsymbal, A., Hammon, M., Soza, G., Suehling, M., Cavallero, A., Comaniciu, D.: Multi-stage osteolytic spinal bone lesion detection from CT data with internal sensitivity control. In: Proc. of SPIE Medical Imaging, vol. 8315, pp. 1–8 (2012)
8.2.11 Lymph Node Detection in CT
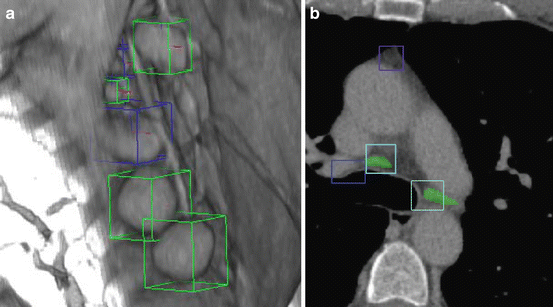
Fig. 8.13
Lymph node detection. (a) Axillary lymph nodes are marked with bounding boxes and labeled as solid (light boxes) and non-solid (dark boxes). Image courtesy of Adrian Barbu. (b) Detection results for mediastinal lymph nodes. Image courtesy of Johannes Feulner. ©2010 IEEE. Reprinted, with permission, from Feulner, J., Zhou, S.K., Huber, M., Hornegger, J., Comaniciu, D., Cavallaro, A.: Lymph node detection in 3-D chest CT using a spatial prior probability. In: Proc. IEEE Conf. Computer Vision and Pattern Recognition, pp. 2926–2932 (2010)
Lymph nodes play an important role in clinical practice. They routinely need to be considered during oncological examination, being related to multiple cancers, for instance lung cancer where metastases may settle in lymph nodes, but also lymphoma that is a cancer of the lymphatic system itself. However, lymph node detection is a challenging problem due to the similar intensity of the lymph nodes to the surrounding tissues and the large variation in shape and size of a lymph node. Feulner et al. [13, 16] presented an automatic lymph node detection method in the mediastinum . The bounding box of a lymph node was detected by using the MSL (Fig. 8.13). Since the orientation of a lymph node is of no interest and was ignored during detection, there were only two stages in the MSL pipeline, i.e., position detection and position-scale detection. Local and global spatial priors were integrated to prune the detected lymph nodes to further improve the detection accuracy.
Barbu et al. [1, 2] proposed a different method to detect the axillary lymph nodes . Similar to [16], the MSL was used to generate lymph node candidates. The region around a detected candidate was segmented and segmentation based features were extracted to enhance the detection. An extensive evaluation on 101 volumes containing 362 lymph nodes showed that this method obtained a 82.3 % detection rate at one false positive per volume, with a running time of 5–20 s per volume.
Publications
Feulner, J., Zhou, S.K., Huber, M., Hornegger, J., Comaniciu, D., Cavallaro, A.: Lymph node detection in 3-D chest CT using a spatial prior probability. In: Proc. IEEE Conf. Computer Vision and Pattern Recognition, pp. 2926–2932 (2010)
Feulner, J., Zhou, S.K., Hammon, M., Hornegger, J., Comaniciu, D.: Lymph node detection and segmentation in chest CT data using discriminative learning and a spatial prior. Medical Image Analysis 17(2), 254–270 (2013)
Barbu, A., Suehling, M., Xu, X., Liu, D., Zhou, S.K., Comaniciu, D.: Automatic detection and segmentation of axillary lymph nodes. In: Proc. Int’l Conf. Medical Image Computing and Computer Assisted Intervention, vol. 1, pp. 28–36 (2010)
Barbu, A., Shling, M., Xu, X., Liu, D., Zhou, S.K., Comaniciu, D.: Automatic detection and segmentation of lymph nodes from CT data. IEEE Trans. Medical Imaging 31(2), 240–250 (2012)
8.2.12 Ileocecal Valve Detection in CT

Fig. 8.14
Ileocecal valve detection results in three colonography CT volumes. Image courtesy of Le Lu
The ileocecal valve is a muscle situated at the junction of the small intestine (ileum) and the large intestine (colon). Its main functionality is to restrict the movement of content from the colon back to the ileum. Automatic colon polyp detection and categorization is a prerequisite for computer-aided colon cancer diagnosis . Detection of the ileocecal valve can reduce the false positive detections generated from the small intestine. Nevertheless, the automatic detection of the ileocecal valve is challenging due to the large variations in its internal shape and appearance and variability of the surrounding tissue (Fig. 8.14).
Lu et al. [34] presented a method for ileocecal valve detection using the MSL. They achieved a detection rate of 94.4 % on a large diverse dataset and the computation time ranged from 4–10 s per volume, which was significantly faster than other published results.
Publication
Lu, L., Barbu, A., Wolf, M., Liang, J., Bogoni, L., Salganicoff, M., Comaniciu, D.: Simultaneous detection and registration for ileo-cecal valve detection in 3D CT colonography. In: Proc. European Conf. Computer Vision, pp. 465–478 (2008)
8.2.13 Aortic Valve Landmark Detection in C-arm CT
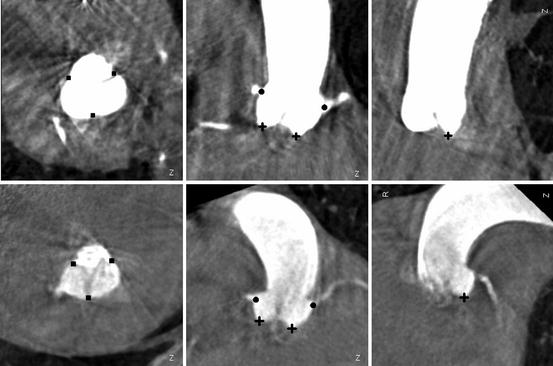
Fig. 8.15
Aortic valve landmark detection results on two example C-arm CT data with ‘filled square’ for the commissures, ‘plus’ for the hinges, and ‘filled circle’ for the left and right coronary ostia. Each row shows three orthogonal cuts of a volume
In [26, 77, 78], we presented an application of the MSL to aortic valve landmark detection and aorta segmentation in C-arm CT volumes to provide measurement and visual guidance for Transcatheter Aortic Valve Implantation (TAVI) . The aorta segmentation is discussed in Sect. 8.3.6. Here we summarize the detection of eight aortic valve landmarks: three aortic hinge points , three aortic commissure points , and left and right coronary ostia (Fig. 8.15). These landmarks provide valuable 3D measurements for surgical planning, for instance, the distance between the coronary ostia and aortic hinge planes [26]. In addition, the detected aortic hinge points can guide the selection of a proper angulation of the C-arm system. Overlaying the detected landmarks onto 2D real time fluoroscopic images also provides critical visual guidance during the intervention. For example, the coronary ostia are particularly important for the proper positioning of the prosthetic valve to avoid blocking the blood flow to the coronary arteries after valve deployment.
Stay updated, free articles. Join our Telegram channel

Full access? Get Clinical Tree


