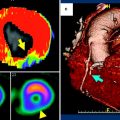
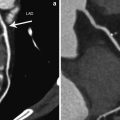
Fig. 1
67-year-old man with a history of MI. The unenhanced CT scan shows fatty metaplasia of the subendocardial myocardium of the septum and left ventricular apex (arrowheads). This finding is known to occur in up to 62 % of patients with a history of MI and may be used as an indicator for non-viable myocardium
Unlike fatty deposits in the right ventricle seen in arrhythmogenic right ventricular dysplasia (ARVD), the diagnostic value of fatty metaplasia of left ventricular myocardium has not yet been determined. In relation to viability imaging, however, one has to be aware of this entity as the presence of fat in areas of scarred myocardium may affect interpretation of late phase CT images. Since the attenuation values of fat are quite low, chronic MI may be visualized as a substantially lower attenuation area in comparison with ischemic myocardium as seen on cCTA or CT myocardial perfusion imaging (Nieman et al. 2006). Furthermore, fatty metaplasia of the left ventricular myocardium may indicate the benefit of an additional late phase CT scan in patients referred for coronary calcium scoring or cCTA.
4 End-Diastolic Wall Thickness
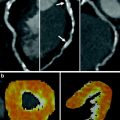
Parallel to resting MR imaging, CT measurement of end-diastolic wall thickness is a surrogate parameter of myocardial viability. Myocardial segments with an end-diastolic wall thickness less than 6 mm on CT are likely to represent scar tissue (Fig. 2a; Nieman et al. 2006). In these segments, regional function is unlikely to improve after revascularization. Extreme cases may evolve into ventricular aneurysms, which may also develop myocardial calcifications (Fig. 3).
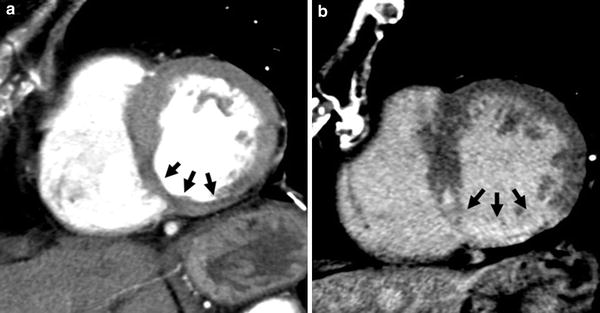
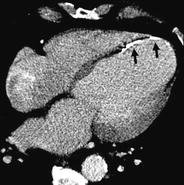
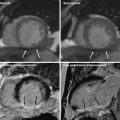
Fig. 2
72-year old female with chronic MI. Arterial phase CT shows wall thinning (<6 mm) of the infero-septal and inferior segments of the left ventricular myocardium (a, arrows). Corresponding to the distinct wall thinning, transmural delayed myocardial contrast enhancement is present, indicating the absence of viable myocardium (b, arrows)
Fig. 3
61-year-old man with a history of chronic MI. The left myocardium underwent severe remodeling and the patient developed an anterior wall aneurysm. In addition, the necrotic myocardium presents some calcifications (arrows)
While there are no studies on the predictive value of end-diastolic wall thickness as measured from cardiac CT for functional recovery after revascularization, it is reasonable to assume that data from resting MR imaging can be transferred for interpreting cardiac CT in this respect. Through MR imaging, it has been shown that a left ventricular wall thickness greater than 5.5 mm in the context of chronic MI predicts viability and subsequent functional recovery with a sensitivity of 92 % and a specificity of 56 % (Baer et al. 1995). In acute MI or subacute MI, before remodeling—wall thinning—is complete, the diagnostic value of end-diastolic wall thickness is limited. In these settings, the effects of edema and cellular infiltrates on wall thickness are thought to contribute to an almost normal wall thickness. Correspondingly, in subacute MI, no difference in end-diastolic wall thickness was seen between viable and non-viable myocardium at 3 weeks after the event (Sandstede et al. 1999).
5 Delayed Myocardial Contrast Enhancement
Unenhanced CT only indirectly indicates the presence of scar tissue, while arterial phase CT visualizes areas of reduced contrast enhancement, which may represent reduced perfusion, microvascular obstruction, myocardial necrosis, or a combination of these entities. To overcome this restriction, CT techniques specific to myocardial viability have been sought.
In the late 1970s, Carlsson et al. and Higgins et al. developed the concept of late phase CT for imaging scar tissue by delayed myocardial contrast enhancement (Higgins et al. 1978; Carlsson et al. 1977). Electron microscopy with energy dispersive X-ray analysis demonstrated a significant increase in the Na+/K+ ratio in regions with delayed contrast enhancement on late phase CT (Newell et al. 1982). This observation confirmed delayed contrast enhancement as a surrogate marker for myocardial necrosis as the increased Na+/K+ ratio indicates the loss of cellular membrane integrity, which is defined as the point of irreversible myocyte injury. These initial observations were followed by several studies on the use of delayed contrast-enhanced EBCT for the assessment of MI (Naito et al. 1990; Masuda et al. 1984). However, CT imaging of MI was superseded by MR imaging and became forgotten.
Over the past decade, a variety of animal and patient studies have shown the feasibility of scar imaging using late-phase CT (Fig. 2b; Buecker et al. 2005). These studies demonstrated delayed myocardial contrast enhancement in acute and chronic MI. In acute and subacute MI, delayed myocardial contrast enhancement is due to myocyte membrane dysfunction. Myocyte membrane, if damaged, becomes permeable to contrast material, resulting in a marked increase in distribution volume. In addition, there is a slower wash-in and wash-out infarcted myocardium, further reenforcing delayed myocardial contrast enhancement. In chronic MI, myocytes are replaced by scar tissue with an increased extracellular space between loosely distributed collagen fibers. Despite these different pathophysiological mechanisms, acute and chronic MI both show delayed myocardial contrast enhancement.
In the subendocardial center of MI, myocytes become necrotic due to the obstruction of the microvasculature, also known as “no-reflow phenomenon”. This is a multifactorial process including vasoconstriction, distal embolization, and interstitial edema. On late phase CT imaging, this region remains hypoattenuated and is surrounded by a hyperenhanced rim of infarcted myocardium.
Delayed myocardial contrast enhancement is typically assessed from a second CT scan obtained 5–15 min after a routine cCTA (Gerber et al. 2006; Baks et al. 2006). The latter basically represents a first-pass arterial phase providing morphological information on perfusion. Myocardium showing reduced contrast enhancement during arterial phase may represent hypoperfusion due to coronary stenosis or occlusion, MI, microvascular obstruction, lipomatous metaplasia, or any combination thereof. While the use and diagnostic value of arterial phase imaging is discussed elsewhere (see “CT imaging of myocardial viability: experimental and clinical evidence”), one has to be aware that it has to be interpreted together with late phase images, if available, as different combinations of early hypoenhancement and delayed hyperenhancement have different meanings and vary in prognostic relevance (Koyama et al. 2005).
As contrast kinetics in iodinated- and gadolinium-based extracellular contrast materials are almost identical, CT suffers the same limitations as MR imaging. Thus, delayed myocardial contrast enhancement on CT is not specific for MI. Recent studies demonstrated delayed myocardial contrast enhancement in other pathologies, such as dilated cardiomyopathy, myocarditis, and sarcoidosis (Kaminaga et al. 1994; Smedema et al. 2006; Dambrin et al. 2007).
5.1 How to Do Late Phase CT Imaging
One of the keys for successful late phase CT imaging for the assessment of delayed myocardial contrast enhancement is the contrast injection protocol. Both the total amount of iodine as well as its administration are critical factors. In order to achieve sufficient contrast enhancement, up to 1 g iodine/kg bodyweight has been administered in animal studies. In a 75 kg patient, this would equal 250 mL of contrast material with 300 mg iodine mL−1 (e.g., iopromide 300). In a 105 kg patient, 350 mL of the same contrast material would be needed. For several reasons, including the potential risk of acute kidney injury, less contrast material should be used. From our experience, approximately 0.5–0.6 mg iodine/kg bodyweight is sufficient to achieve adequate delayed myocardial contrast enhancement. This still results in a total volume of approximately 120–175 mL of contrast material. Considering scanner technology at the time of this writing, where coronary CT angiograms can be obtained with as little as 50 ml of contrast material, the acquisition of late phase CT images must be planned prior to contrast injection or different contrast injection strategies are needed to avoid unnecessary exposure of patients to contrast material.
Traditionally, the total amount of contrast material is administered in a single bolus injection after the proper delay time for coronary imaging has been determined by a test-bolus injection or by using the bolus tracking technique. A different approach is to administer a smaller bolus for coronary imaging, followed by low flow injection (0.1–0.3 mL s−1) for several minutes with or without a subsequent wash-out phase (Fig. 4). A wash-out phase will help to improve the contrast between blood pool and hyperenhancing myocardium, as it allows the contrast material to become eliminated from the blood pool. Without a wash-out phase, the relatively high concentration of contrast material in the blood pool may obscure small areas of subendocardial hyperenhancement. The use of a multiphasic injection protocol also permits for more sophisticated approaches toward viability imaging by means of CT as it allows for reacting on the findings from the arterial phase scan. Thus, in patients scheduled for cCTA, it would be feasible to add a late phase CT in the presence of segments presenting with hypoattenuation and/or reduced wall thickness. With a single bolus technique, these patients would need a second appointment for a dedicated work-up of pathologic CT findings in the myocardium.
Fig. 4
Different contrast injection protocols are discussed for coronary CT angiography with subsequent late phase imaging for assessing myocardial viability. Traditionally, the total amount of contrast material is injected in a single bolus injection and late phase images are obtained at 5–15 min after contrast injection (a). A different approach is to administer a smaller contrast bolus for coronary imaging, followed by slow flow injection (0.1–0.3 mL s−1) for several minutes (b). Adding an additional wash-out phase improves contrast between blood pool and areas of delayed myocardial contrast enhancement (c)
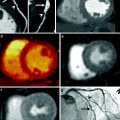
There are also some technical considerations regarding the late phase scan itself. While typical delays range from 5 to 15 min after contrast injection, there are some animal-research data indicating that approximately 6 min appears to be the optimal delay after a single bolus injection of a monomeric contrast agent (Mahnken et al. 2009). Dual phase injection techniques provide the best image quality about 5–10 min after start of contrast injection, with image quality depreciating at 15 min (Brodoefel et al. 2007). Given that iodine attenuation improves at lower tube voltage, the use of 80 or 100 kV scan protocols—depending on the patient’s body weight—is recommended; however, the tube current-time product should be increased accordingly to avoid photon starvation. In fact, 80 kV scans were shown to provide the best contrast-to-noise ratios with single energy CT (Fig. 5; Mahnken et al. 2007). Lowering tube voltage, even with adaptation of the tube current-time product, helps to reduce the radiation dose of the additional viability scan. A different approach is the use of dual energy CT for assessing delayed myocardial contrast enhancement. However, the potential of improved contrast visualization comes at the price of a higher radiation exposure when compared with single energy CT. Finally, prospective ECG-triggering should be used for all late phase CT scans in order to minimize radiation exposure (Wang et al. 2011). As motion artifacts affect the assessment of the myocardium markedly less than the coronaries, the use of prospective ECG-triggering appears to be justified even at higher heart rates.
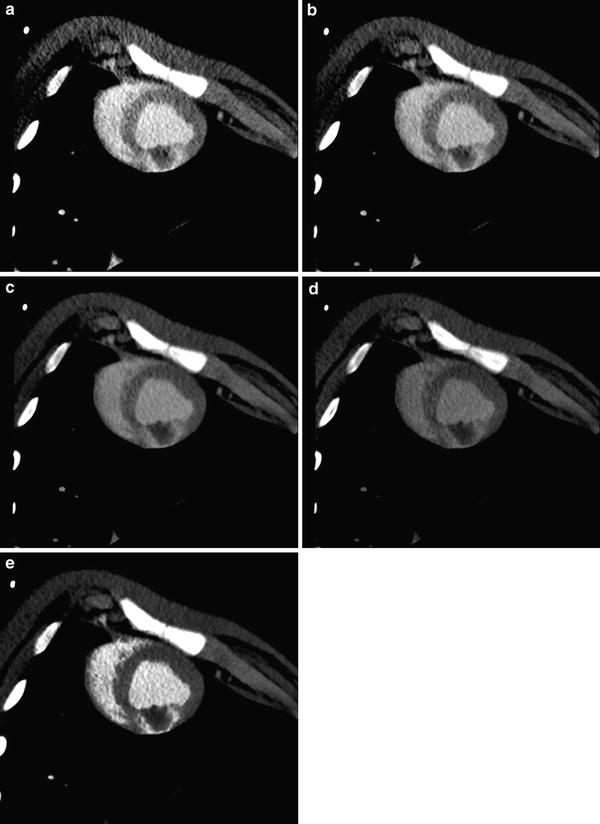
Fig. 5
Visualization of delayed myocardial contrast is strongly influenced by tube voltage with iodine attenuation improving at lower tube voltage. In this example of experimental myocardial infarction in pigs, the best contrast at single energy CT is seen at 80 kV (a) and 100 kV (b). Contrast-to-noise ratio decreases with 120 kV (c) and is poor at 140 kV (d). Contrast-to-noise ratio can be markedly improved using dual energy CT with nonlinear image blending (e). All images are shown with identical window settings (W250HU/C150HU). Of note, there is a large residual perfusion defect inside the area of myocardial hyperenhancement indicating microvascular obstruction
As late phase CT images typically come with a relatively poor contrast-to-noise ratio of the hyperenhancing myocardium, the proper post-processing will help to improve visualization of the delayed contrast enhancing myocardium. For reducing image noise, thick multiplanar reformats (5–10 mm section thickness) should be reconstructed along the short and long axes of the left ventricle using a smooth convolution kernel. For image reading, the use of narrow window settings following the so-called ‘half-contour principle’ is recommended (Thompson and Stanford 1994), where the window center roughly equals the HU values in the area of infarction with a window width of twice the value of the window center. In case dual energy CT is used, a nonlinear mixing technique appears to favorably improve visualization of infarcted myocardium (Fig. 5).
5.2 Assessment of Late Phase CT Images
Late phase CT data are best assessed using reformats along the standard short and long axes of the left ventricle (Cerqueira et al. 2002). The presence and transmurality of delayed myocardial contrast enhancement is assessed from these data. For clinical purposes, it appears to be sufficient to semi-quantitatively (e.g., ≤25 %, ≤50 %, ≥75 %) assess the transmural extent of delayed myocardial contrast enhancement (Fig. 6). From personal experience, the transmural extent appears to be somewhat overestimated by CT, in comparison with MR imaging. Technique and relevance for exact quantification of MI size is discussed in chapter (see“CT Assessment of Myocardial Viability-Quantitative Imaging”). For a quick clinical workup, the presence of residual perfusion defects in the infarct core need to be noted. Like the transmural extent of delayed myocardial contrast enhancement, these residual perfusion defects correlate with functional recovery. In fact, they were shown to be the strongest predictor of persistent myocardial dysfunction (Kim et al. 2012). However, it needs to be stressed that arterial phase (early perfusion defects) and late phase CT (residual perfusion defects and delayed myocardial contrast enhancement) need to be assessed side by side, as different enhancement patterns have different prognostic implications (Fig. 7; Koyama et al. 2005; Ko et al. 2007). Moreover, arterial phase imaging provides information on the coronary arteries and areas of delayed myocardial contrast enhancement can be correlated to coronary pathology using dedicated software for image fusion (Mahnken et al. 2010).
Fig. 6
Dysfunctional but viable myocardium may recover function after revascularization therapy. Recovery of global and regional function depends on the transmural extent of MI. In subendocardial MI with less than 25 % of the left ventricular wall thickness being necrotic, global improvement of left ventricular function can be expected (a). If delayed myocardial contrast enhancement comprises up to 50 % of the transmural extent, regional function is likely to improve (b). Segments with more than 75 % delayed myocardial contrast enhancement rarely show functional improvement (c). In segments with transmural hyperenhancement there will be no functional recovery after revascularization (d)
Fig. 7
Arterial (left) and late phase CT imaging (right) need to be assessed together, as ischemic injury presents with different contrast enhancement patterns. These patterns are related to functional recovery after myocardial infarction. Global left ventricular function and wall thickening is likely to improve if no early perfusion deficit, but delayed contrast enhancement (white region) is seen (a). Prognosis decreases if hypoattenuating areas (black regions) are seen during arterial phase with corresponding areas of delayed enhancement on late phase CT images (b). In patients with early and late phase perfusion deficits, corresponding to microvascular obstruction, poorest results are to be expected (c)
The presence of transmural perfusion defects on arterial phase CT was shown to be a better predictor of persistent myocardial dysfunction than transmural delayed myocardial contrast enhancement (Kim et al. 2012). These findings are in accordance with Lessick et al., who reported that persistent myocardial dysfunction is clearly related to the presence of both early perfusion defects and delayed myocardial contrast enhancement (Lessick et al. 2007). In an early study assessing the impact of different contrast patterns on functional recovery, Koyama et al. reported that global left ventricular function and wall thickness on follow-up examination in MI patients was best in a group with delayed myocardial contrast enhancement, but without early or residual perfusion defects (Koyama et al. 2005). In contrast, results were poorest in groups with early and residual perfusion defects and delayed myocardial contrast enhancement. Considering these findings, one may assume that normal arterial phase CT is a more promising predictor of a good prognosis, whereas pathologic late phase CT is a more powerful predictor of poor prognosis.
When interpreting the results of the different CT techniques for imaging of myocardial viability one has to be aware that there are distinct differences in the sensitivity and specificity for the prediction of functional recovery as well as for the estimated extent of the ischemic injury. The same is true when comparing different imaging techniques such as SPECT or dobutamine stress MR imaging with CT. These differences, however, do not indicate one method is better than another one, but simply indicate that each of these imaging techniques detects different aspects of viable myocardium, e.g., SPECT assesses regions with a reduced number of viable cells, while delayed contrast enhancement in late phase CT or MR imaging refers to an increased extracellular space.
Related posts:
 Time-Resolved CT Imaging of Myocardial Perfusion: Dual-Source CT
 Evaluation of the Myocardial Blood Supply: Single-Source, Single-Energy CT
 CT Angiography: State of the Art
 are We Interested in Viability?
 Myocardial Perfusion Imaging: Clinical Implementation
 Evaluation of the Myocardial Blood Supply: Dual-Source Dual-Energy CT
Stay updated, free articles. Join our Telegram channel

Full access? Get Clinical Tree


