Chapter 8
Susceptibility Artifact
Wells I. Mangrum, Elmar M. Merkle, and Allen W. Song
CASE 1

1. What in the shoulder is causing the artifact seen in the images?
2. What is the name of this artifact?
3. What are imaging characteristics of this artifact?
4. Is the artifact more apparent on spin echo or gradient-recalled echo sequences?
5. What would you do to receiver bandwidth and echo train length to reduce the artifact?
ANSWERS
CASE 1
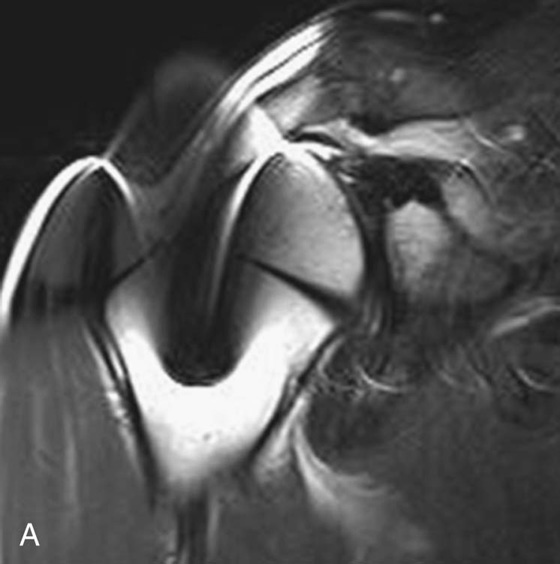
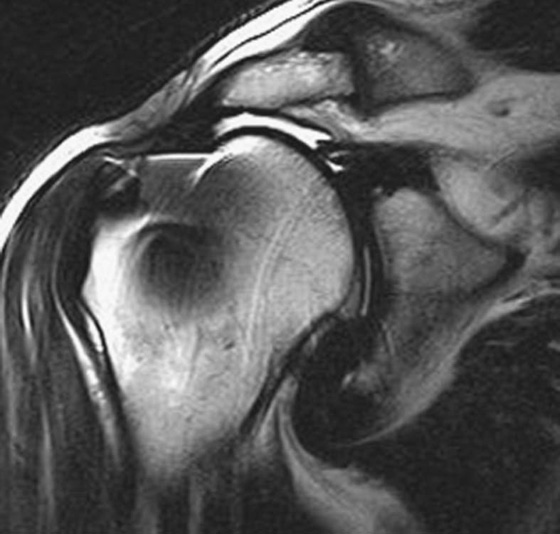
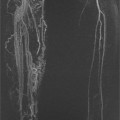
FIGURE 1A. Coronal T2-weighted fast spin echo (FSE) sequence of right shoulder. There is low signal centrally within the humeral head with surrounding high signal. Note that the image distortion is greater in the craniocaudal direction (frequency-encoding direction) than in the medial-lateral (phase-encoding) plane. The artifact limits evaluation of the rotator cuff.

FIGURE 1B. Modified coronal T2-weighted FSE sequence. In an effort to reduce the susceptibility effects, the echo train length was increased from 9 to 23 and the receiver bandwidth was increased from 130 to 435 kHz. Note the significant decrease in susceptibility artifact. The low-signal rotator cuff tendons end abruptly at the level of the acromioclavicular joint. T2 bright signal, consistent with fluid, is seen between the humeral head and acromion.
1. Metal in the proximal humerus causes the artifact.
2. Susceptibility artifact.
3. Susceptibility artifact results in geometric distortion in spin echo imaging and signal loss in gradient-recalled echo imaging.
4. Susceptibility artifacts are less pronounced in spin echo imaging, compared to gradient-recalled echo imaging, due to the 180° refocusing pulse used in spin echo imaging (see discussion below).
5. To reduce susceptibility artifact, one would increase both the receiver bandwidth and the echo train length (see discussion below).
Diagnosis:
Torn rotator cuff that is retracted to the level of the acromioclavicular joint with associated fluid in the subacromial/subdeltoid bursa.
Discussion
The magnetic susceptibility of a substance is defined by the effect that the substance has on the local magnetic field. If the material increases the local magnetic field, then the material has a positive magnetic susceptibility; if it decreases the local magnetic field, then it has a negative magnetic susceptibility. Substances that have positive magnetic susceptibilities are considered ferromagnetic or paramagnetic depending on how much they increase the local magnetic field. Iron is a ferromagnetic substance because it significantly increases the local magnetic field. Hemosiderin and deoxyhemoglobin are examples of paramagnetic substances that increase the local magnetic field, but not to the same degree as iron. Diamagnetic materials have a negative magnetic susceptibility and thus decrease the local magnetic field. Free water and most human soft tissue are predominantly diamagnetic. Cortical bone is even more diamagnetic than soft tissue.1
Susceptibility artifact occurs when two substances of different magnetic susceptibilities are within close proximity to one another. The substance with the higher magnetic susceptibility will increase the local magnetic field while the adjacent substance with the lower magnetic susceptibility decreases the local magnetic field. The net result is that the local magnetic field is heterogeneous, with high strength next to the paramagnetic/ferromagnetic substance and low strength next to the diamagnetic substance. The susceptibility artifact increases as the difference between the magnetic susceptibilities increases.
Susceptibility artifacts can cause both signal loss and geometric distortion. The signal loss caused by susceptibility artifact is best seen on T2*-weighted sequences (gradient-recalled echo [GRE] sequences). Recall that protons dephase in the transverse plane because of local magnetic field differences (see Chapter 2). When the local magnetic field is highly heterogeneous (such as when metal is in the field), this dephasing can result in significant signal loss. The longer the time to echo (TE), the longer the protons have to dephase and the greater will be the susceptibility-induced signal loss. This effect can be nullified by using the 180° refocusing pulse used in spin echo imaging. The refocusing pulse allows “rephasing” of the protons.
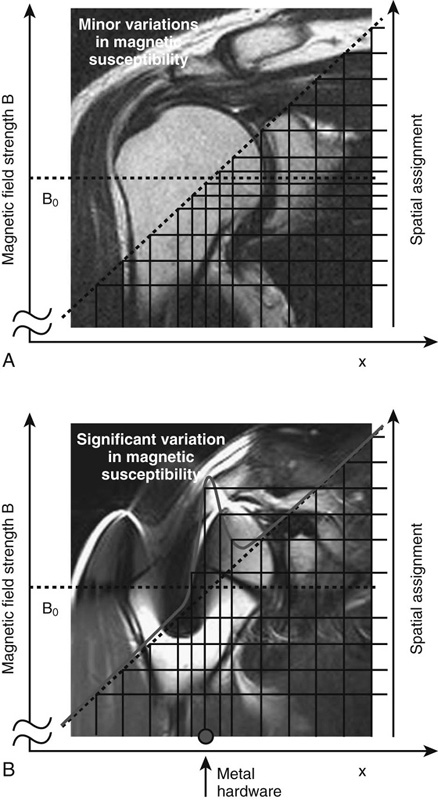
The second manifestation of susceptibility artifact is geometric distortion of the image. Geometric distortion is the dominant manifestation of susceptibility artifact in spin echo imaging. (Geometric distortion also occurs in GRE imaging, but its recognition is often masked by the dominant signal loss from proton dephasing.) In order to understand geometric image distortion, we must first recall that, in the ideal situation, the MRI scanner creates a relatively uniform main magnetic field and three sets of linear spatial gradient fields across our body. These fields are required for spatial encoding. Susceptibility effects cause local heterogeneity in these fields, resulting in deviations in the spatial-encoding gradients and distortions in the final image (Fig. 1). The size of the geometric distortion is inversely related to the receiver bandwidth.2,3 The direction of the geometric distortion is dependent on the imaging sequence. For most conventional imaging, where phase encoding is achieved in separate excitations, the geometric distortion occurs in the frequency-encoding direction. However, in most single-shot acquisitions (e.g., echo-planar imaging [EPI]), the distortion is predominant in the phase-encoding direction as the sampling rate (hence the received bandwidth) is much lower in this direction.
A strategy to reduce susceptibility-induced image distortion is to reduce the length of readout windows for individual spin echoes. This can be achieved by increasing the receiver bandwidth and/or echo train length (this is the strategy used to reduce the geometric distortion in Case 1).2,3 Alternatively, because geometric distortion occurs in the frequency-encoding direction, one can swap the phase- and frequency-encoding directions and cause the geometric distortion to occur in the orthogonal plane. To uproot the distortion problem altogether, one can measure the magnetic field using a dual-echo sequence, and apply the field correction in the reconstruction process to restore spatial fidelity.
CASES 2, 3, AND 4: COMPANION CASES
Case 2
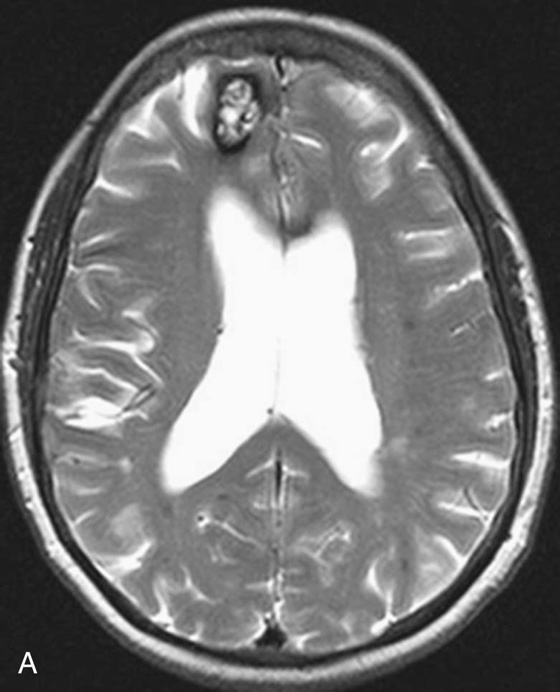
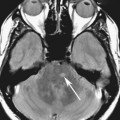
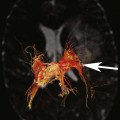
FIGURE 2A. Axial T2-weighted FSE image of the brain. A high-T2-signal lesion with a low-T2-signal rim is identified in the right frontal lobe. The other scattered punctuate foci of low T2 signal in the bilateral cerebral hemispheres are difficult to appreciate.
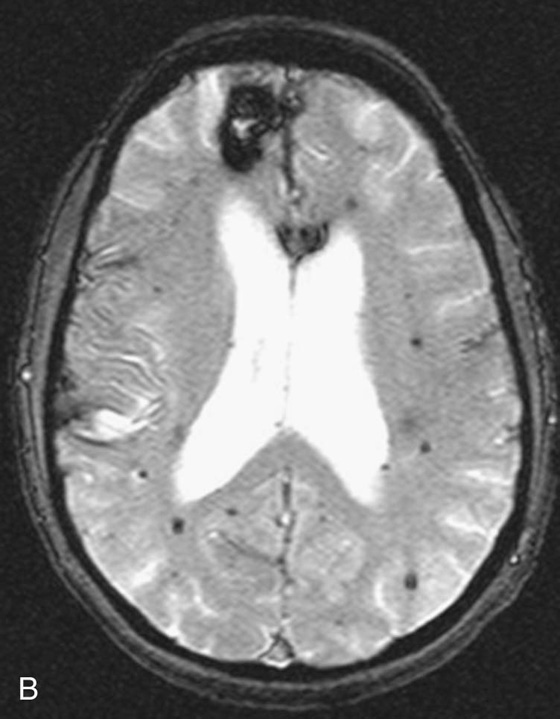
FIGURE 2B. Axial T2-weighted GRE sequence of the brain. The lesion in the right frontal lobe is again identified. The low-T2-signal rim of the lesion is more pronounced. Additionally, multiple punctuate low-T2-signal foci are distributed diffusely throughout the brain.
Diagnosis:
Multiple cavernomas.
Clinical Discussion
The T2 bright lesion with a low-T2-signal rim in the right frontal lobe is characteristic for a cavernoma. Cavernomas chronically bleed and as a result have a characteristic hemosiderin ring. As shown in this case, cavernomas are frequently multiple.4
Case 3
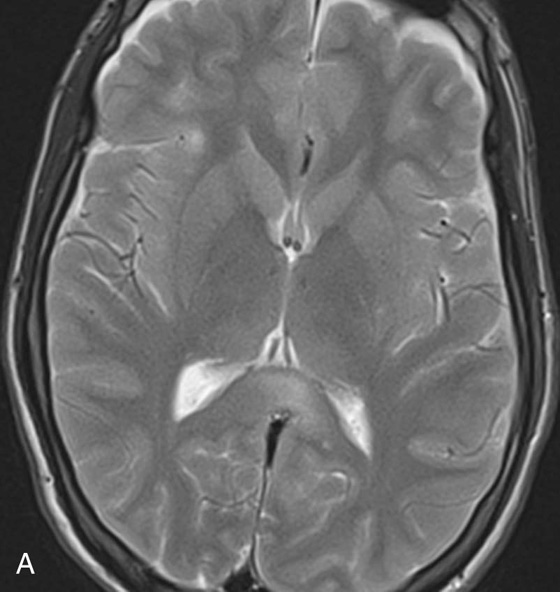
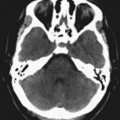
FIGURE 3A. T2-weighted FSE image. Subtle foci of increased signal noted at the gray-white junction of the bilateral frontal lobes and the splenium of the corpus callosum.
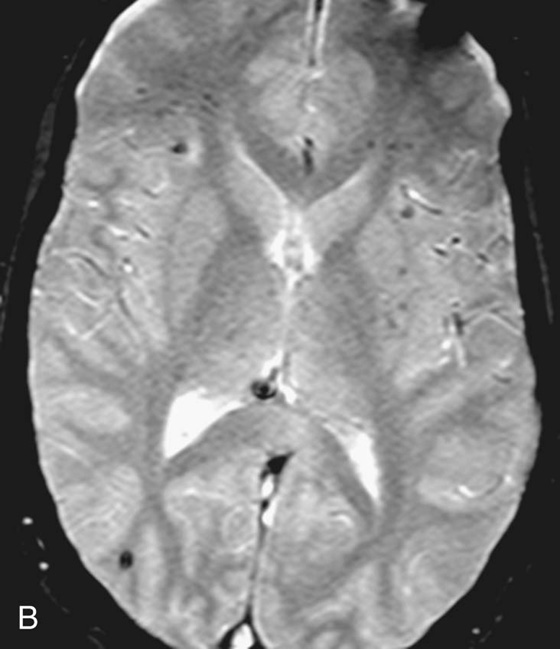
FIGURE 3B. T2-weighted GRE image. Multiple low-signal foci are identified in the frontal and parietal lobes bilaterally. These lesions are predominantly centered at the gray-white junction. These lesions are more conspicuous on the GRE sequence.
Diagnosis:
Diffuse axonal injury.
Clinical Discussion:
The history of trauma and the location of the lesions at the gray-white junction leads one to conclude that these are small foci of hemorrhage in a patient with diffuse axonal injury. Diffuse axonal injury most frequently occurs at the gray-white junction, corpus callosum, basal ganglia, dorsolateral brainstem, and cerebellum.5
Case 4
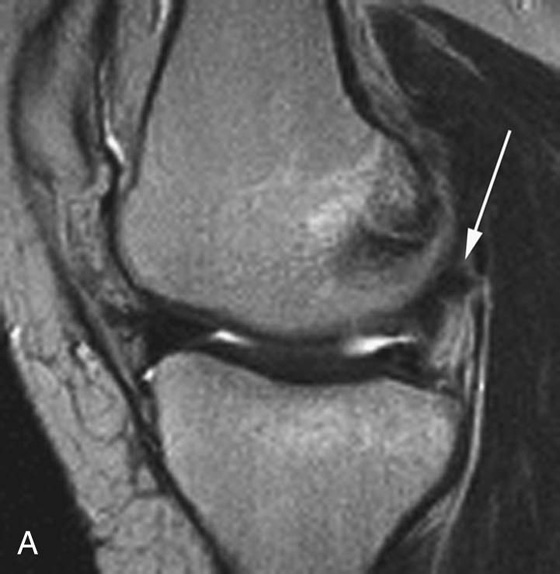
FIGURE 4A. Sagittal T2-weighted FSE image of the knee. A subtle low-T2-signal focus (arrow) is identified in the posterior knee joint.
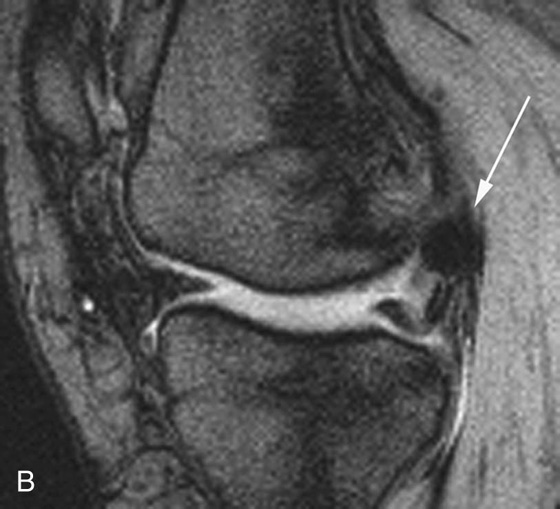
FIGURE
Related posts:
Stay updated, free articles. Join our Telegram channel

Full access? Get Clinical Tree


