Fig. 2.1
M-mode imaging at the mitral valve tips
M-mode imaging can be performed across the mitral valve from the apical approach with the addition of color Doppler (Fig. 2.2). The resultant trace enables the propagation velocity of blood to be calculated as it moves towards the apex. The M-mode cursor is placed in the center of the mitral valve, parallel to the transvalvular flow. Employment of a fast sweep speed (100–200 mm/s) and an aliasing velocity of 0.5–0.7 m/s will result in a vertical diastolic color pattern in the absence of mitral regurgitation. A line drawn along the initial early-diastolic slope of this color M-mode signal determines the propagation velocity. This measure of flow is reduced in the setting of elevated left ventricular pressure and is increased with constrictive physiology. In the setting of mitral regurgitation, a color M-mode signal will also be observed during systole. The density of this color jet is proportional to the degree of valvular incompetence.
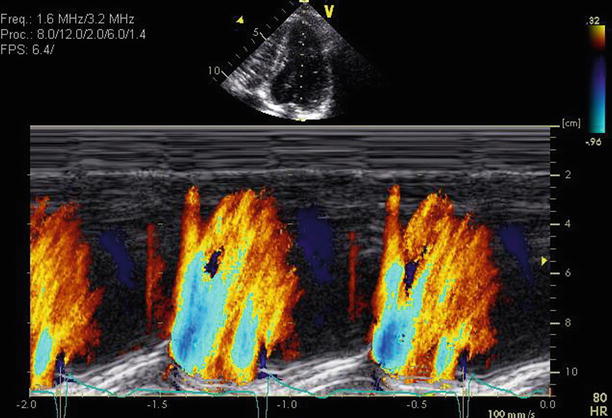
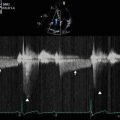
Fig. 2.2
Normal color M-mode through the mitral valve with transvalvular flow during diastole only
2.3 Spectral Doppler Imaging
Spectral Doppler imaging consists of both pulsed wave (PW) and continuous wave (CW) Doppler. Doppler interrogation of the mitral valve is optimized when flow is parallel to the ultrasound beam. Typically, this is best achieved on the apical four-chamber view. The PW sample volume is placed within the left ventricle at the level of the open mitral valve leaflet tips. Normally, antegrade blood flow through the mitral valve should occur during diastole (above the baseline), with no flow during systole (below the baseline) (Fig. 2.3). The E wave measures the velocity of rapid, passive transmitral flow during early diastole, whilst the A wave reflects active transmitral flow secondary to late diastolic atrial contraction. The mitral inflow profile therefore reflects left ventricular diastolic pressures and function. Increased antegrade velocity, seen by an elevation of the peak E wave, is also suggestive of increased transvalvular flow in the setting of mitral regurgitation. In mitral regurgitation, retrograde flow will also be noted (below the baseline) on CW imaging. The timing, wave profile, wave slope (dP/dt), peak velocity, and signal intensity of this spectral envelope can be used to help stratify the severity of the mitral regurgitation (Fig. 2.4).
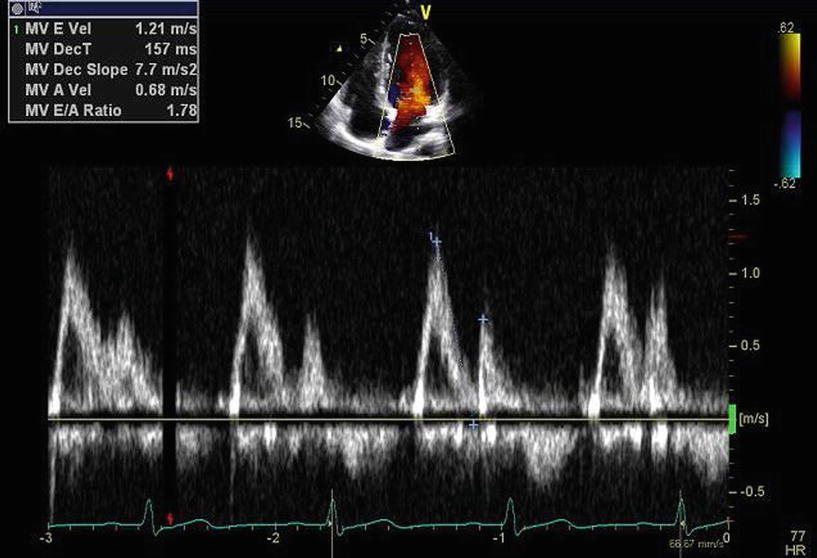
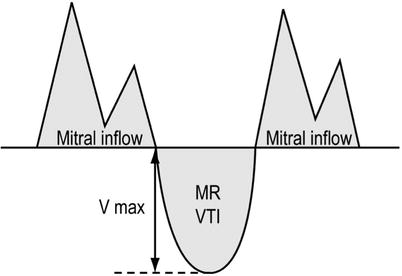
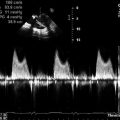
Fig. 2.3
Spectral Doppler image demonstrating inflow through the mitral valve during diastole
Fig. 2.4
The relationship and direction of diastolic mitral inflow and systolic mitral regurgitation
2.4 Color Doppler Imaging
This Doppler technique, which enables a color pattern of blood flow volume and direction within the heart to be superimposed on a 2D image, is particularly useful in the assessment of mitral regurgitation. The color Doppler jet pattern can be visually characterized with respect to the origin, direction, timing, and extent of reverse flow or turbulence of flow in different imaging planes. Quantitative assessment of the color Doppler jet can be employed for more formal classification of mitral regurgitation severity. Quantitative measures include jet width at the vena contracta, proximal isovelocity surface area (PISA), regurgitant volume (RVol), and regurgitant orifice area (ROA).
The PISA method uses the principle of conservation of mass by analyzing flow convergence of the regurgitant jet just proximal to the valve orifice on the left ventricular side of the mitral valve (Fig. 2.5). This radius can be used to calculate the severity of mitral regurgitation because acceleration of blood occurs further from the orifice in severe regurgitation than in mild regurgitation. A larger PISA corresponds to more severe mitral regurgitation. This method relies on a central circular valvular orifice for hemispheric measurements and is hence less accurate for eccentric or multiple jets. Adjustment of the aliasing velocity can be performed to optimize a hemispheric convergence zone. The PISA radius can then be used to estimate the regurgitant flow via the regurgitant flow (RF). In combination, the PISA radius and the peak velocity (Vmax) or velocity time integral (VTI) of the regurgitant jet on CW Doppler can be used to estimate the regurgitant volume (RVol) or the effective regurgitant orifice area (EROA) of the regurgitant jet, as shown in the following equations:
 where r = PISA, RF = instantaneous regurgitant flow, and V a = aliasing velocity.
 where V max = peak velocity of the regurgitant jet assessed by CW Doppler.
 where VTI = time-velocity integral of the regurgitant jet obtained by CW Doppler.
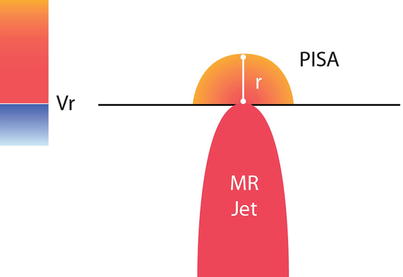
Fig. 2.5
Illustration of the PISA method
Table 2.1 shows the values for the PISA classification of mitral regurgitation.
Table 2.1
PISA classification of mitral regurgitation severity
Severity | ERO (mm2) | RVol (mL/beat) |
|---|---|---|
Mild | <20 | <30 |
Mild–moderate | 20–29 | 30–44 |
Moderate–severe | 30–39 | 45–59 |
Severe | ≥40 | ≥60 |
2.5 Classification of Mitral Regurgitation
Mitral regurgitation is typically stratified as mild, moderate, or severe using the spectral and color Doppler methods illustrated above. Further classification includes assessment for reversal of pulmonary venous flow (via PW Doppler at the ostium of a pulmonary vein as it enters the left atrium) and assessment of LV size, ejection fraction, and contractile reserve.
Once severity is determined, classification of the cause of valve dysfunction is then typically performed visually from 2D images according to a standardized format. The most commonly employed classification system was described by Carpentier, as shown in Table 2.2.
Table 2.2
Carpentier classification of mitral regurgitation
Dysfunction | Lesions | Etiology |
|---|---|---|
Type I: | Annular dilatation | Ischemic cardiomyopathy |
Normal leaflet motion | Annular deformation | Dilated cardiomyopathy |
Leaflet perforation | Endocarditis | |
Type II: | Chordal elongation | Degenerative mitral disease |
Increased leaflet motion (leaflet prolapse) | Chordal rupture | Fibroelastic deficiency |
Papillary muscle elongation | Barlow’s disease | |
Papillary muscle rupture | Marfan’s disease | |
Endocarditis | ||
Rheumatic disease | ||
Trauma | ||
Ischemic cardiomyopathy | ||
Type IIIA: | Leaflet thickening | Rheumatic disease
Related posts:Stay updated, free articles. Join our Telegram channel
Full access? Get Clinical Tree
 Get Clinical Tree app for offline access

|