Study
Experimental model
Single-energy arterial-phase imaging
Single-energy delayed-enhancement MDCT
Dual-energy delayed-enhancement MDCT
Time of MI
Hoffmann et al. (2004)
Porcine model (n = 7)
+
–
–
Acute MI
Lardo et al. (2006)
Canine (n = 10) and porcine (n = 7) model
–
+
–
Actue (90 min) chronic (8 weeks)
Buecker et al. (2005)
Porcine model (n = 14)
–
+
–
Acute MI
Baks et al. (2006)
Porcine model (n = 10)
–
+
–
Acute MI (5–7) days
Mahnken et al. (2007)
Porcine model (n = 7)
–
+
–
Acute (day 7), subactute (day 28) and chronic (day 90) MI
Ruzsics et al. (2008)
Porcine model (n = 5)
–
+
–
Acute MI (6–7 days)
Varga-Szemes et al. (2012)
Porcine model (n = 6)
–
(ex vivo Gd DTPA)
–
Acute MI
Deseive et al. (2011)
Porcine model (n = 8)
–
–
+
Chronic (61 ± 4 days)
Table 2
Human experimental studies for quantification of MI
Study | Study Population | Single-energy Arterial-phase imaging | Single-energy Delayed-Enhancement MDCT | Dual-energy Delayed-Enhancement MDCT | Time of DE-MDCT acquisition |
|---|---|---|---|---|---|
Gerbe et al. (2006) | Acute MI (n = 16) | + | + | – | 10 min |
Chronic MI (n = 21) | |||||
Nieman et al. (2008) | Acute MI (n = 21) | + | + | – | 7 min |
Jacquier et al. (2008) | Acute MI (n = 19) | + | + | – | 5 and 10 min |
Boussel et al. (2008) | Acute MI (n = 19) | – | + | – | 10 min |
Choe et al. (2008) | Acute MI (n = 40) | + | + | – | 10 min |
Chronic MI (n = 40) | |||||
Mahnken et al. (2005) | Acute MI (n = 28) | – | + | – | 15 min |
Kang et al. (2010) | Chronic MI (n = 26) | – | – | + | 6 min |
2.3 Reconstruction and Evaluation Parameters
According to a report by Blankstein et al. (2009), in general, delayed-enhancement CT studies are best viewed as thick (5 or 10 mm) multiplanar reformations with a narrow window width and level (e.g., a width of 200 HU and a level of 100 HU) or as maximum intensity projections.
2.4 Quantification Parameters
Percent-infarct per slice (PIS) is calculated for MDCT (PISMDCT) or MRI (PISMRI) as follows:
PISMDCT or PISMRI = (∑Iv)/nslice (Kim et al. 2000) (summation of infarcted voxels over all myocardial voxels v in the slice)
where nslice is the number of myocardial voxels in the slice.
Infarction fraction (IF) for MDCT (IFMDCT) or MRI (IFMRI) is calculated as follows:
IF = (∑Iv)/(∑nslice) (Perazzolo Marra et al. 2011) (summation of infarcted voxels over all myocardial voxels v in the heart)
where (∑nslice) represents the total number of myocardial voxels obtained by summing the voxel counts from all slices.
Tissue mass is determined by taking into account the specific gravity of myocardium, 1.05 g/cm3. In the same manner, from IF, the total volume of infarcted tissue is determined.
3 Cardiac CT: Evidence of Quantification of Myocardial Viability
Several comparative studies have been published to establish the role of MDCT for quantification of nonviable myocardium. MDCT viability studies compared their result to delayed-enhancement CMR (DE-CMR) as the clinical reference gold-standard imaging modality for viability assessment (Gerber et al. 2006; Nieman et al. 2008; Choe et al. 2008; Jacquier et al. 2008; Habis et al. 2009; Boussel et al. 2008; Nikolaou et al. 2005; Mahnken et al. 2005). Most of these studies have proven that DE-MDCT can identify and quantify infarct size from acute to chronic phases of infarct injury as a result of iodinated contrast accumulation induced hyperattenuation.
Histopathological evidence shows that areas of infarct shrink during the evolution of scarring due to myocardial remodeling. A significant difference in the area of delayed enhancement is prominent on DE-MDCT and DE-CMR images from acute to chronic phases of MI. DE-MDCT has the ability to accurately monitor microscopic evolution of scarring, myocardial-infarct remodeling, and reduction of infarct size (Mahnken et al. 2007). Interestingly, a recent study showed that peri-infarct edema in large acute MIs can be assessed on unenhanced CT (Mahnken et al. 2009).
No-reflow phenomenon can be well recognized as a central area of hypoattenuation within a hyperattenuated region in DE-MDCT images. In fact, a hypoattenuated core as seen on CT may be the finding that is most predictive of a residual perfusion defect 6 weeks after successful reperfusion of acute MI (Paul et al. 2005).
3.1 Single Energy for Quantifying MI
3.1.1 Arterial-Phase Imaging: Quantification of Area of Hypoattenuation
ECG-synchronized first-pass cCTA allows us to not just visualize the coronary artery tree and, consequently, grade coronary stenosis but also to characterize areas of decreased myocardial blood flow. Decreased perfusion, shown as hypoattenuated areas on CT images, may be secondary to a critical coronary artery stenosis or occlusion, microvascular obstruction, or myocardial scar. Thus, while a differential diagnosis is difficult to make, the diagnostic value of delineating the areas with deteriorated blood flow (hypoattenuation) is undeniable (Kramer et al. 1984; Gray et al. 1978; Doherty et al. 1981; Georgiou et al. 1992) Fig. 1.
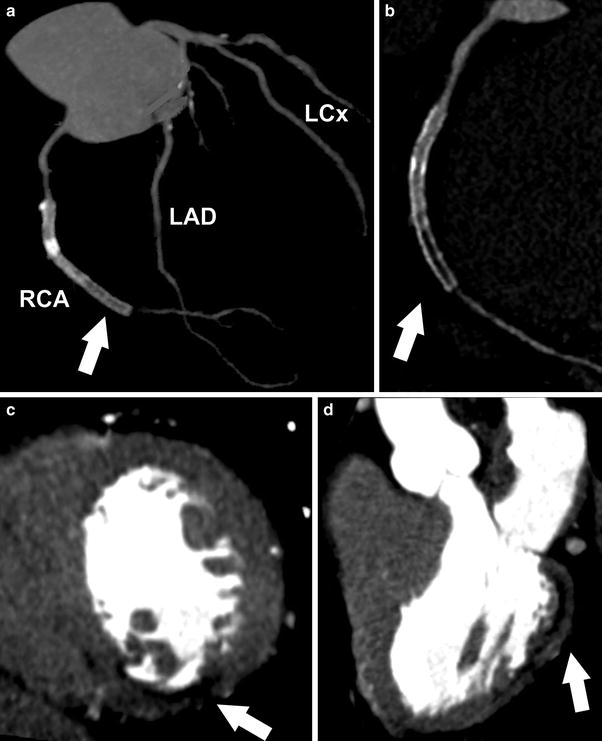
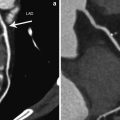
Fig. 1
Contrast enhanced, retrospectively ECG-gated dual-source CT study of a 61-year-old patient with prior history of acute coronary syndrome and myocardial infarct. (a) Coronary artery tree is shown with presence of RCA stent (arrow) (LAD: Left Anterior Descending, LCx: Left Circumflex, RCA: Right Coronary Artery). (b) Coronary artery disease of RCA is displayed revealing significant in-stent restenosis (arrow). c and d delineate MI as area of hypoattenuation (arrow) on early arterial-phase images with (c) dedicated short and (d) long axis view after first-pass contrast injection
With contrast-enhanced cCTA, chronic MI can ordinarily be recognized as a hypoattenuated region (>50 % HU decrease compared with surrounding myocardium) (Nikolaou et al. 2004) in a subendocardial or transmural distribution that persists in systole and diastole and is concordant with a coronary territory (Rubinshtein et al. 2009).
It is well established in CMR studies that the transmural extent of nonviable myocardium determines the success of functional recovery after revascularization. Thus, accurate and precise quantification of nonviable myocardium is critical for planning a revascularization strategy and for helping the physician assess the risks and benefits of the PCI procedure and/or coronary artery bypass graft surgery (Kim et al. 2000; Choi et al. 2001). In 2004, animal experiments provided evidence of not just delineation but also quantification of hypoattenuated area within acutely infarcted myocardium. Areas of low attenuation within porcine heart showed good correlation with myocardial blood flow reduction and absolute MI size (Hoffmann et al. 2004).
Nikolaou et al. reported clinical correlation in 30 patients. First-pass CT angiography was able to detect all but one (10 out of 11) MI when compared to DE-CMR. Assuming MI size through blood flow defect quantification results in a significant underestimation (19 %) compared to true infarct size determined by DE-CMR.
Differentiation between ischemia and MI is not possible using first-pass cCTA acquisition alone (Nikolaou et al. 2005). Shapiro et al. (2010) investigated prognostic value of the extent of hypodense areas in patients with MI. It was found that the prognostic relevance of hypoperfused areas, as determined from arterial-phase CT, is unclear and remains such, because decreased myocardial attenuation on arterial-phase CT imaging is not necessarily indicative and, more importantly, not specific for MI. However, patients with MI often show hypoattenuation after first-pass iodinated contrast injection in the infarcted area.
Mahnken et al. (2005) showed the importance of arterial-phase detection but the area of hypoattenuation significantly underestimated the true infarct size compared with cardiac MRI. PISMRI versus PISMDCT were calculated and compared in each patient. Mean infarct size on MRI (PIS) was 31.2 ± 22.5 % per slice compared with 24.5 ± 18.3 % per slice for first-pass arterial-phase acquisition on MDCT. Actual MI on MDCT size was reportedly underestimated by 25 % compared with DE-CMR (k = 0.635). Reported underestimation and discrepancy in infarct size could be explained by the observation that parts of the reperfused necrotic area display normal enhancement on first-pass perfusion but are hyperenhanced on delayed imaging. Thus, in patients with MI, early hypoattenuated regions represent only a fraction of MI.
In 42 subjects, Sanz et al. reported that quantified MI size in arterial-phase CT angiography imaging and DE-CMR were strongly correlated (r = 0.87, p < 0.0001). MI volume by MDCT was again proven to be underestimated in comparison with DE-CMR (2.7 ± 2.5 vs. 25.9 ± 19.9 mL, p < 0.0001) (Sanz et al. 2006).
In summary, first-pass iodinated contrast media MDCT hypoattenuation is not specific and, more importantly, not an accurate tool for securely diagnosing or quantifying myocardial infarct. Clinical correlation can help establishing the etiology (e.g., perfusion, MI, microvascular obstruction) of hypoattenuation on arterial-phase MDCT images. Quantification of areas with low attenuation significantly underestimates true MI size.
3.1.2 Delayed-Enhancement CT Imaging: Quantification of Area of Hyperattenuation
The delayed-hyperenhancement phenomenon of CMR is a well-established and widely-acceptable clinical tool for detecting and quantifying infarcted, nonviable myocardium. Contrast-enhanced CMR uses a GdDTPA contrast agent that has myocardial tissue kinetics that is similar to those of iodinated contrast agents. In acute MI, myocyte necrosis results in interstitial edema and membrane rupture, which allows iodinated contrast agents and gadolinium chelates to diffuse into the intracellular space (Jennings et al. 1985; 1990). Thus, just as GdDTPA of CMR, iodinated contrast material accumulates in the infarcted cardiac segments with a similar late-enhancement phenomenon visualized by delayed cardiac CT. Late DE-MDCT acquisition after iodinated contrast agent administration is capable of delineating MI as an area of hyperattenuation, i.e., myocardial region with high Hounsfield unit values. Usually, late-scan acquisition is considered to be 5–15 min after the administration of contrast agent.
GdDTPA and iodinated contrast agent accumulation is observed in both acute and chronic myocardial infarcts. In acute settings, necrosis is identified; in chronic infarcts, a dense collagen-rich scar is identified. Both histopathological entities show expanded extracellular space that delays washout of contrast media (Gerber et al. 2006).
Transmural extent of MI as detected and quantified with DE-MDCT predicts the recovery of regional systolic LV function after revascularization for acute STEMI (ST-elevation myocardial infarct, as observed on ECG) (Shapiro et al. 2010).
3.1.2.1 Animal Experiments
Several animal experiments have shown that the area of delayed enhancement could be not only just visualized but also quantified on late-MDCT images. Equally importantly, animal studies have the definite advantage over human studies through the use of a histological 2,3,5-Triphenyltetrazolium-Chloride (TTC) staining, the ultimate comparative ex vivo hystopathological reference standard (Gerber et al. 2006; Lardo et al. 2006) (Table 1, Fig. 2).
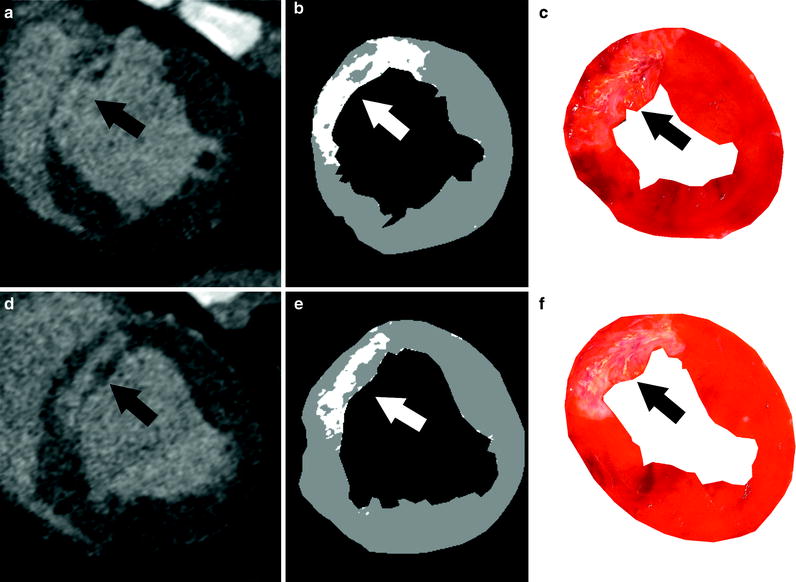
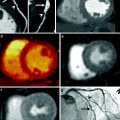
Fig. 2
Semiautomated method for visualizing and quantifying animal myocardial infarct. a and d display cardiac CT images in short axis after delayed MDCT acquisition. Accumulated iodine contrast in infarcted porcine heart is visible in LAD territory, i.e., anterior cardiac segments (arrow). b and e show corresponding threshold CT images with +2 S.D. threshold. Myocardial infarct is delineated as bright pixels on threshold images (arrow). Within the infarcted area, gray pixels represent microvascular obstruction (b). e and f show corresponding histopathological standard, post-mortem TTC images delineating in good agreement with myocardial-infarct location and size (arrow)
The role of MDCT in quantifying nonviable myocardium was reported in both acute and chronic animal MI. The transmural extent and volume of infarct by MDCT compared well with TTC staining (acute infarcts, PISMDCT: 21.1 ± 7.2 %, compared with PISTTC: 20.4 ± 7.4 %, mean difference of 0.7 %; chronic infarcts, 4.15 ± 1.93 % (PISMDCT) compared with 4.92 ± 2.06 % (PISTTC), mean difference of 20.76 %). Peak CT attenuation values were visualized 5 min after contrast agent administration. No-reflow zones at the center of MIs have also been identified accurately in acute studies and correlate well with reduced blood flow determined by microsphere distribution (Lardo et al. 2006).
Buecker et al. (2005) also quantified MI in porcine model (n = 14). Spatial extent of infarct was well correlated between TTC, DE-CMR, and DE-MDCT at 5 min post-contrast injection, with DE-MDCT slightly overestimating the infarct size.
Baks et al. (2006) have demonstrated an excellent correlation of both MRI and MDCT with TTC for quantification of subacute infarct in porcine model. Consequently, DE-CMR and DE-MDCT demonstrated a strong correlation in determining infarct size.
Mahnken et al. (2007) used a porcine model and performed sequential DE-CMR and DE-MDCT imaging in reperfused acute, subacute, and chronic MI (day 0, 7, 28 and 90). No significant differences were observed in infarct size between DE-MDCT and DE-CMR at all investigated timepoints. Bland–Altman plots showed good agreement (−3.4–1.9 %) for infarct size between DE-MDCT and TTC staining on day 90.
Related posts:
 Time-Resolved CT Imaging of Myocardial Perfusion: Dual-Source CT
 Evaluation of the Myocardial Blood Supply: Single-Source, Single-Energy CT
 CT Angiography: State of the Art
 are We Interested in Viability?
 Myocardial Perfusion Imaging: Clinical Implementation
 Evaluation of the Myocardial Blood Supply: Dual-Source Dual-Energy CT
Stay updated, free articles. Join our Telegram channel

Full access? Get Clinical Tree


