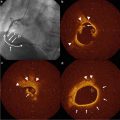
Fig. 7.1
Intravascular ultrasound signal is obtained from the vessel wall (a). Grayscale intravascular ultrasound imaging is formed by the envelope (amplitude) (b) of the radiofrequency signal (c). By grayscale, atherosclerotic plaque can be classified into four categories: soft, fibrotic, calcified, and mixed plaques. (d) shows a cross-sectional view of a grayscale image. The blue lines limit the actual atheroma. The frequency and power of the signal commonly differ between tissues, regardless of similarities in the amplitude. From the backscatter radiofrequency data different types of information can be retrieved: virtual histology (e), palpography (f), integrated backscattered intravascular ultrasound (g), and iMAP (h). Virtual histology is able to detect four tissue types: necrotic core, fibrous, fibrofatty, and dense calcium. Plaque deformability at palpography is reported in strain values, which are subsequently categorized into four grades according to the Rotterdam Classification (ROC). The tissues characterized by integrated backscattered intravascular ultrasound are lipidic, fibrous, and calcified; iMAP detects fibrotic, lipidic, necrotic, and calcified (Reprinted from Garcia-Garcia HM, Costa MA, Serruys PW. Imaging of coronary atherosclerosis: intravascular ultrasound. Eur Heart J 2010;31:2456-69. With permission from Oxford University Press)
Grayscale IVUS provides a limited insight into atheroma composition. Soft (echolucent) plaques have been related either to high lipid content [31, 32] or the presence of smooth muscle cells [11]. While fibrous plaques usually have an intermediate echogenicity, but sometimes very dense fibrous plaques can also appear as calcified lesions [6]. Traditionally, acoustic shadowing has been considered as a sign of calcification, but necrotic tissue can also cause shadowing [11]. In addition, the interobserver variability in the plaque type assessment by grayscale IVUS reported in the literature varies considerably, with percentages of concordance between observers ranging from 88 % to only 47 % [13, 33, 34].
Tissue Characterization Using Virtual Histology IVUS or iMAP-IVUS
Two softwares for ultrasound backscattering tissue characterization are currently available in clinical practice (Fig. 7.2). The first commercial available radiofrequency (RF) signal-based tissue composition analysis tool was the so-called virtual histology (VH-IVUS, Volcano Therapeutics, Rancho Cordova, CA, USA) software [12, 35, 36]. It uses in-depth analysis of the backscattered RF signal in order to provide a more detailed description of the atheromatous plaque composition and is performed with either a 20 MHz, 2.9 Fr phased array transducer catheter (Eagle Eye™ Gold, Volcano Therapeutics) or 45 MHz 3.2 Fr rotational catheter (Revolution, Volcano Therapeutics) that acquires IVUS data electrocardiogram gated [36]. The main principle of this technique is that it uses not only the envelope amplitude of the reflected RF signals (as grayscale IVUS does), but also the underlying frequency content to analyze the tissue components present in coronary plaques. This combined information is processed using autoregressive models and thereafter in a classification tree that determines four basic color-coded plaque tissue components [1, 35]: fibrous tissue (dark green) [2], fibrofatty tissue (light green) [3], necrotic core (red), and [4] dense calcium (white). The current software version assumes the presence of a media layer, which is artificially added, positioned just at the inside of the outer vessel contour. This technique has been compared in several studies against histology in humans and other species [12, 35, 37].
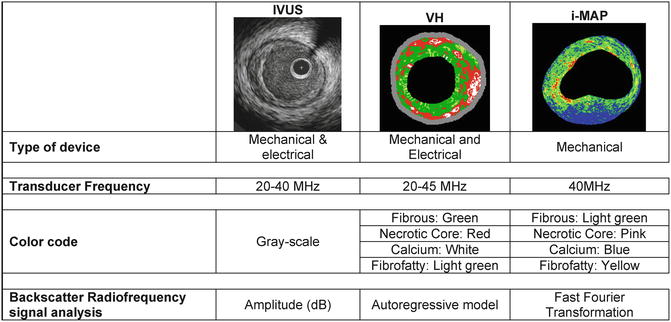

Fig. 7.2
Similarities and differences of IVUS and IVUS-based imaging modalities
Recently, another RF-based processing method has become commercially available for coronary plaque tissue characterization and it is called iMAP-IVUS (Boston Scientific, Santa Clara, CA, USA) [38, 39]. In principle this software is comparable, from methodological point of view, to the IVUS-VH. However, by design, these two IVUS catheters have different capabilities for tissue characterization. Unlike VH, iMap uses a 40 MHz single rotational transducer on a drive shaft and can acquire radiofrequency data continuously, while VH uses similar catheter and additionally is also available in the electronic catheter (20 MHz). iMap and VH (40 MHz vs. 45/20 MHz) have relative advantages and disadvantages in displaying grayscale images. iMap has higher resolution, but displays specific artifacts such as nonuniform rotational distortion, because it is a rotational catheter. In addition, far-field imaging can be more problematic with high frequency catheters due to amplified attenuation and enhanced blood backscatter. Whereas VH feeds the spectra that are obtained from the radiofrequency data using autoregressive models into a classification tree that has reported diagnostic accuracies of over 90 % each plaque components as compared to histology [12], iMap uses a pattern recognition algorithm on the spectra that were obtained from a fast Fourier transformation and a histology-derived database [38]. The color code for tissue types is also different: iMap depicts fibrotic (light green), lipidic (yellow), necrotic (pink), and calcified tissue (blue), while VH depicts fibrous (green), fibrofatty (yellow green), necrotic core (red), and dense calcium (white), respectively. Taken together, it is possible that these distinctive features may lead to differences in the tissue characteristics of the images of coronary plaque obtained.
Shin et al. compared in vivo findings of this two IVUS-based tissue characterization system, showing a significant and systematic variability in plaque composition estimates [39]. iMap classified plaque as necrotic tissue in poor signal areas, such as guidewire artifact or acoustic shadowing, while VH displays fibrofatty. VH showed EEM as a gray medial stripe, while iMap always provided plaque composition results even for very thin plaques. VH tends to overestimate metallic stent struts, and iMap shows thinner stent thickness than VH. Also, in the VH there is peri-stent dense calcium with necrotic core halo, not seen in the iMap (Fig. 7.3).
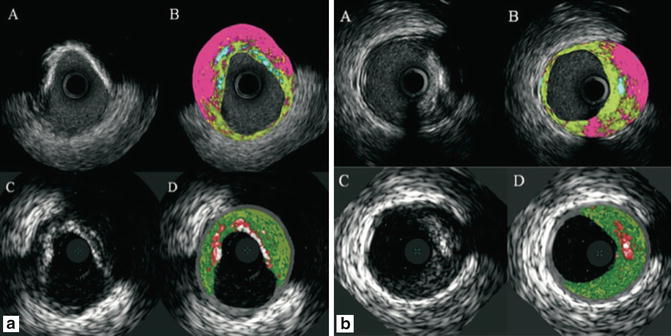

Fig. 7.3
Corresponding cross-section of iMap (top) and VH images (bottom). iMap shows large amounts of necrotic tissue behind calcium, while with VH the same area is reported as fibrous or fibrofatty tissue. In panel B, iMAP shows necrotic tissue because also of the wire artifact (Reprinted from EuroIntervention 6 [7] Shin E, García-García HM, Ligthart J, et al. In vivo findings of tissue characteristics using iMap™ IVUS and Virtual Histology™ IVUS. EuroIntervention:1017-1019; ©2011. With permission from Europa Digital and Publishing)
Plaque Type Characterization by IVUS-VH
Using IVUS-VH, the various stages of atherosclerosis can be defined (Fig. 7.4). The definition of an IVUS-derived TCFA, for example, is a lesion fulfilling the following criteria in at least three consecutive frames [1]: plaque burden ≥40 % [2]; confluent necrotic core ≥10 % in direct contact with the lumen (i.e., no visible overlying tissue) [40]. Using this definition of IVUS-derived TCFA, in patients with ACS who underwent IVUS of all three epicardial coronaries there were, on average, two IVUS-derived TCFAs per patient with half of them showing outward remodeling [40]. The potential value of these IVUS-VH-derived plaque types in the prediction of adverse coronary events was evaluated in an international multicentre prospective study, the Providing Regional Observations to Study Predictors of Events in the Coronary Tree study (PROSPECT study) [41]. The PROSPECT trial was a multicenter, natural history study of acute coronary syndrome patients: all patients underwent PCI in their culprit lesion at baseline, followed by an angiogram and IVUS virtual histology analyses of the three major coronary arteries. The longitudinal distribution of atherosclerotic plaque burden, virtual histology- IVUS characterized necrotic core content, and VH-TCFA was as follows: there was a gradient in plaque burden from the proximal (42.4 %) to mid (37.6 %) to distal (32.6 %) 30-mm-long segments (p < 0.0001). Overall, 67.4 % of proximal, 41.0 % of mid, and 29.7 % of distal 30-mm-long segments contained at least 1 lesion (plaque burden >40 %). Proportion of NC, however, was similar in the proximal and mid 30-mm-long segments of all arteries (10.3 % [interquartile range (IQR): 4.8–16.7 %] vs. 10.6 % [IQR: 5.0–18.1 %], p = 0.25), but less in the distal 30-mm-long segment (9.1 % [IQR: 3.7–17.8 %], p = 0.03 compared with the proximal segment and p = 0.003 compared with the mid segment). Overall, 17.3 % of proximal, 11.5 % of mid, and 9.1 % of distal 30-mm-long segments had at least one lesion that was classified as VH-TCFA (p < 0.0001). Comparing the LMCA with the combined cohort of proximal left anterior descending, left circumflex, and right coronary artery 30-mm-long segments: (1) plaque burden was less (35.4 % [IQR: 28.8–43.5 %] vs. 40.9 % [IQR: 33.3–48.0 %], p < 0.0001); (2) fewer LMCAs contained at least 1 lesion (17.5 %, p < 0.0001); (3) there was less NC (6.5 % [IQR: 2.9–12.2 %] vs. 9.3 % [IQR: 4.3–15.9 %], p < 0.0001); and (4) LMCAs rarely contained a VH-TCFA (1.8 %, p < 0.0001). Authors concluded that lesions that are responsible for acute coronary events (large, plaque burden-rich in NC) are somewhat more likely to be present in the proximal than the distal coronary tree, except for the LMCA [42].
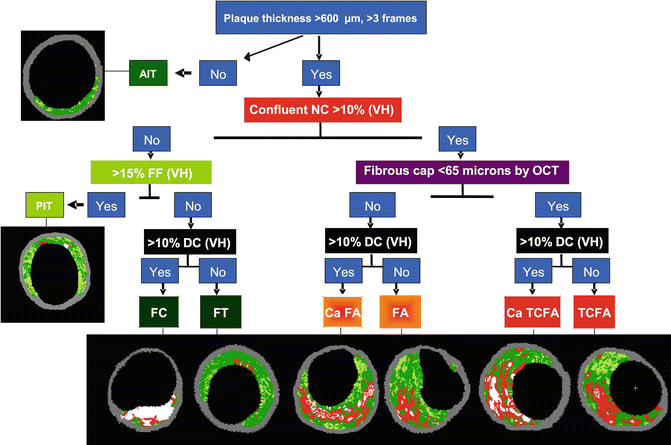

Fig. 7.4
Flow chart for VH classification of coronary plaque. AIT adaptive intima thickness, PIT pathological intima thickness, FC fibrocalcific plaque, FT fibrotic plaque, CaFa calcified fibroatheroma, FA fibroatheroma, CaTCFA calcified thin-cap fibroatheroma, TCFA thin-cap fibroatheroma, NC necrotic core, FF fibrofatty, DC dense calcium, OCT optical coherence tomography
A TCFA with a minimum lumen area of ≤4 mm2 and a large plaque burden (≥70 %) had a 17.2 % likelihood of causing an event within 3 years. Interestingly, the anticipated high frequency of acute thrombotic cardiovascular events did not occur, with only a 1 % rate of myocardial infarction and no deaths directly attributable to non-culprit vessels over 3 years of follow-up. These results suggest that non-culprit, yet obstructive coronary plaques are most likely to be associated with increasing symptoms rather than thrombotic acute events, with 8.5 % of patients presenting with worsening angina and 3.3 % with unstable angina. The PROSPECT findings were recently confirmed by the VIVA study [43].
Although plaque characteristics (i.e., tissue characterization) do not yet influence current therapeutic guidelines, the available IVUS-based tissue characterization techniques have the ability to identify some of the pathological atheroma features described above and could help us to advance further our understanding on atherosclerosis.
Assessment of Drug Effect on Atherosclerosis by IVUS-VH
IVUS-VH has been so far used in various studies in order to show serial changes of plaque composition in patients treated with various statin treatments (Table 7.1).
Table 7.1
IVUS-based tissue characterization studies
Yokoyama [63] | RCT | 2005 | Atorvastatin | 25 | 6 months | Overall plaque size and tissue characterization by IB IVUS | Atorvastatin reduced plaque size and changed plaque composition |
Control | 25 | ||||||
Kawasaki [64] | RCT | 2005 | Pravastatin, | 17 | 6 months | Overall tissue characterization by IB IVUS | Statins reduced lipid without changes in plaque size |
Atorvastatin | 18 | ||||||
Diet | 17 | ||||||
IBIS 2 [46] | RCT | 2008 | Darapladib | 175 | 12 months | Necrotic core volume by IVUS-VH | Darapladib significantly reduced necrotic core |
Placebo | 155 | ||||||
Nasu [44] | Observational | 2009 | Fluvastatin | 40 | 12 months | Overall tissue characterization by IVUS-VH | Fluvastatin reduced plaque and fibrofatty volume |
Control | 40 | ||||||
Hong [45] | RCT | 2009 | Simvastatin | 50 | 12 months | Overall tissue characterization by IVUS-VH | Both reduced necrotic core and increased fibrofatty volume |
Rosuvastatin | 50 | ||||||
Toi [65] | RCT | 2009 | Atorvastatin | 80 | 2–3 weeks | Overall tissue characterization by IVUS-VH | Pitavastatin reduced plaque volume and fibrofatty |
Pivastatin | 80 | ||||||
Miyagi [66] | Observational | 2009 | Statin (pravastatin, pitavastatin, atorvastatin, fluvastatin, simvastatin) | 44 | 6 months | Overall tissue characterization by IB IVUS | Statins reduced lipid and increased fibrous |
Non statin | 56 |
In one of them, patients with stable angina pectoris (n = 80) treated with fluvastatin for 1 year had significant regression of the plaque volume, and changes in the atherosclerotic plaque composition with a significant reduction of the fibrofatty volume (p < 0.0001). These changes in the fibrofatty volume had a significant correlation with changes in the LDL-cholesterol level (r = 0.703, p < 0.0001) and in the hs-C reactive protein level (r = 0.357, p = 0.006) [44]. Of note, the necrotic core did not change significantly.
In a second study, Hong et al. randomized 100 patients with stable angina and ACS to either rosuvastatin 10 mg or simvastatin 20 mg for 1 year. The overall necrotic core volume significantly decreased (p = 0.010) and the fibrofatty plaque volume increased (p = 0.006) after statin treatments. Particularly, there was a significant decrease in the necrotic core volume (p = 0.015) in the rosuvastatin-treated subgroup. By multiple stepwise logistic regression analysis, they showed that the only independent clinical predictor of decrease in the necrotic core volume was the baseline HDL-cholesterol level (p = 0.040, OR: 1.044, 95 % CI 1.002–1089) [45].
The IBIS 2 study compared the effects of 12 months of treatment with darapladib (oral Lp-PLA2 inhibitor, 160 mg daily) or placebo in 330 patients [46]. Endpoints included changes in necrotic core size (IVUS-VH) and atheroma size (IVUS-grayscale). Background therapy was comparable between groups, with no difference in LDL-cholesterol at 12 months (placebo: 88 ± 34 and darapladib: 84 ± 31 mg/dL, p = 0.37). In the placebo-treated group, however, necrotic core volume increased significantly, whereas darapladib halted this increase, resulting in a significant treatment difference of −5.2 mm3 (p = 0.012). These intraplaque compositional changes occurred without a significant treatment difference in total atheroma volume. Indeed, in a detailed report on the predictors of change either in percentage of necrotic core (PNC) or percentage of atheroma volume (PAV) were the variables associated with a decrease in PNC from baseline were darapladib, ACS, and a large content of NC at baseline, while variables associated with an increase in PNC were previous stroke and percentage diameter stenosis at baseline. Those variables associated with a decrease in PAV from baseline were waist circumference, statin use, CD40L, and baseline PAV, while the only variable associated with an increase in PAV was baseline diastolic blood pressure [47].
Stay updated, free articles. Join our Telegram channel

Full access? Get Clinical Tree


