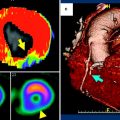
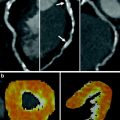
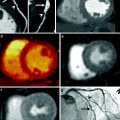
Fig. 1
Detection of myocardial perfusion defects by dual energy CT. 45-year-old man with LAD stenosis. Images a and c were acquired at rest, whereas images b and d were obtained during pharmacological stress. DECT (a, b) showed normal iodine concentrations of 3.4 mg/ml during rest. During stress imaging, quantitative iodine concentration decreased within the antero-septal myocardium (0.6 mg/ml) compared to healthy myocardium within the lateral wall (3.4 mg/ml–3.8 mg/ml). MRPI (c, d) confirms reversible ischemia in the mid-ventricular anteroseptal myocardium
6 Dynamic, Time-Resolved Quantitative Imaging
As the basis of dynamic, time-resolved CT imaging and its acquisition protocols are discussed at length in previous chapters, this section will lay its focus on the clinical implications of the semi-quantitative data generated.
Due to technical advances, including higher temporal resolution, broader detectors, and acquisition techniques that allowed for whole heart coverage, dynamic perfusion imaging has become feasible and the focus of ongoing investigations (Fig. 2). Preliminary animal studies in pigs were able to quantify MBF during rest and adenosine induced hyperemia using the “shuttle mode” at 2 alternating table positions. MBF was shown to be significantly reduced in pigs with an induced 80 % coronary stenosis underlining the potential of CT to assess functional parameters as well (Mahnken et al. 2010). In an initial clinical experience, Bamberg et al. (2010) demonstrated the feasibility of a model-based semi-quantitative determination of MBF using dynamic myocardial stress CTP imaging in a female patient with myocardial ischemia. These results were further strengthened by Bastarrika’s working group, who were able to recruit 10 patients and showed comparable results (Bastarrika et al. 2010). Larger, single-center cohorts followed and confirmed the prospect of using dynamic CTP to expand existing CT capabilities (Fig. 3). Dynamic CTP has been evaluated against FFR, and an MBF cut of point of 75 mL × 100 mL−1 min−1 has been supported as the best discriminatory value to detect a significant coronary lesion (Bamberg et al. 2011). A recent study by Wang et al. showed dynamic CTP in good correlation to SPECT and catheter angiography; this study also documented an improvement in diagnostic accuracy for identifying flow-obstructive coronary stenosis when compared to CTA alone (Wang et al. 2012). However, in this study, an MBF cut-off value of 90 mL × 100 mL−1 min−1 was introduced, underlining that caution is in order when solely relying on quantitative values. Larger clinical trials are warranted to observe the influence of factors such as gender, race, BMI, and severity of coronary disease. If scientifically supported properly, quantitative values hold a certain attractiveness. Given the ever-growing emphasis on evidence-based medicine, the clinical arena would surely appreciate quantitative values for guiding decision-making and therapy.
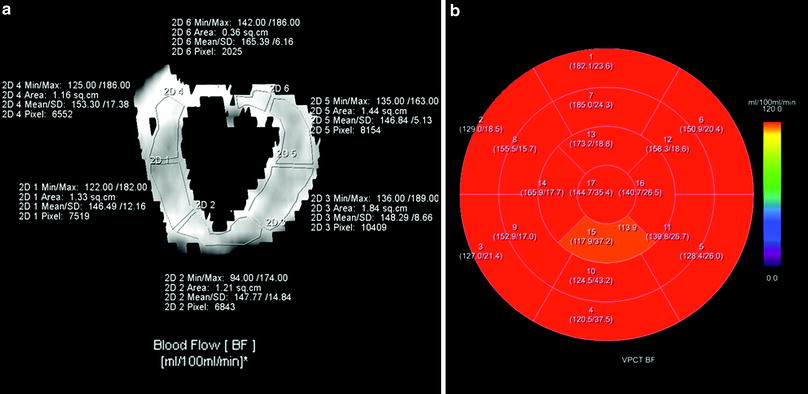
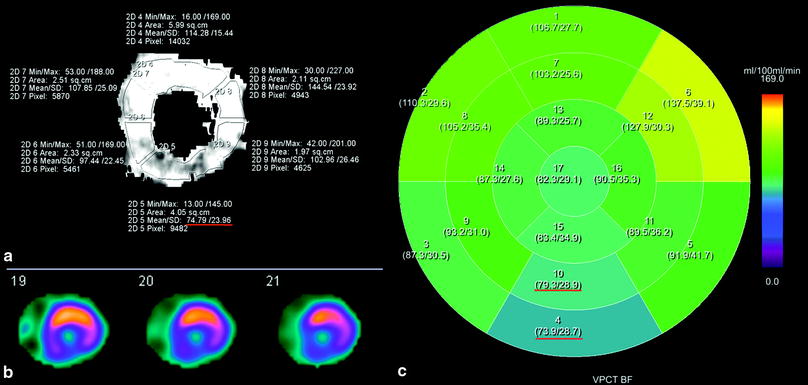
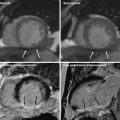
Fig. 2
Standard cardiac perfusion maps. Visualization of MBF on a short axis reformation at the mid-ventricular level (a) and 3D-visualization on 17- segment polar map using the prototype software (b). Note: incomplete volume coverage in segments 1 and 2 is seen on the manual 2D visualization (a)
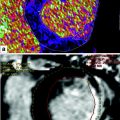
Fig. 3
Detection of myocardial perfusion defects by myocardial blood flow (MBF). Quantitative assessment of perfusion defects on 2D-perfusion map with decreased MBF (mean 74.79 mg/ml) at the low-to-mid cavity level (a) confirmed by SPECT imaging at stress (b); 3DVisualization: the 17-segmented polar map of MBF (c) shows correlating positive perfusion defects mainly in the inferior wall (segment 4: mean 79.3 mg/ml; and segment 10: mean 73.9 mg/ml)
A current draw-back of quantitative assessments is the time consuming post processing of myocardial perfusion data sets, which relies on two-dimensional region-of-interest measurements. This laborious evaluation regimen is hardly compatible with clinical work-flow. However, recently introduced semi-automated evaluation software shows a significant time saving potential when compared to manual assessments and could integrate quantitative measurements into clinical practice (Fig. 4).
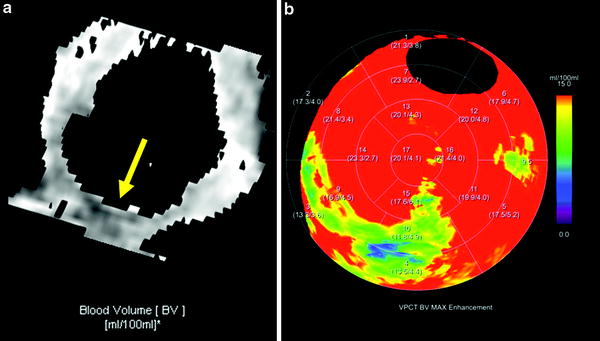
Fig. 4
Detection of myocardial perfusion defects by myocardial blood volume (MBV). Qualitative assessment of perfusion defects on 2D-perfusion map with hypoenhancement in the inferoseptal myocardium (a). 3D-Visualization: the 17-segmented polar map of MBV (b) shows correlating positive perfusion defects with 11.8 ml/ 100 ml–13.5 ml/ 100 ml. Note: insufficient volume coverage of anterobasal segments
References
Bamberg F, Klotz E, Flohr T, Becker A, Becker CR, Schmidt B, Wintersperger BJ, Reiser MF, Nikolaou K (2010) Dynamic myocardial stress perfusion imaging using fast dual-source CT with alternating table positions: initial experience. Eur Radiol 20(5):1168–1173. doi:10.1007/s00330-010-1715-9 PubMedCrossRef
Bamberg F, Becker A, Schwarz F, Marcus RP, Greif M, von Ziegler F, Blankstein R, Hoffmann U, Sommer WH, Hoffmann VS, Johnson TRC, Becker H-CR, Wintersperger BJ, Reiser MF, Nikolaou K (2011) Detection of hemodynamically significant coronary artery stenosis: incremental diagnostic value of dynamic CT-based myocardial perfusion imaging. Radiology 260(3):689–698. doi:10.1148/radiol.11110638 PubMedCrossRef
Bastarrika G, Ramos-Duran L, Rosenblum MA, Kang DK, Rowe GW, Schoepf UJ (2010) Adenosine-stress dynamic myocardial CT perfusion imaging: initial clinical experience. Invest Radiol 45(6):306–313. doi:10.1097/RLI.0b013e3181dfa2f2 PubMed
Related posts:
 Time-Resolved CT Imaging of Myocardial Perfusion: Dual-Source CT
 Evaluation of the Myocardial Blood Supply: Single-Source, Single-Energy CT
 are We Interested in Viability?
 Assessment of Myocardial Viability: Quantitive Imaging
 Myocardial Perfusion Imaging: Clinical Implementation
 Evaluation of the Myocardial Blood Supply: Dual-Source Dual-Energy CT
Stay updated, free articles. Join our Telegram channel

Full access? Get Clinical Tree


