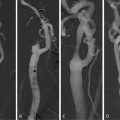
Fig. 7.1
A typical histological section of a vulnerable carotid plaque
It has been accepted that both plaque morphology and biomechanical environment of the plaques influence their vulnerability [57]. The biomechanical factors such as plaque wall tensile stress and wall shear stress are considered to be important factors in plaque rupture process and should be taken into account for plaque vulnerability assessment. In this chapter, plaque wall stress analysis will be reviewed from 2D to 3D, from idealized models to patient-specific plaques in terms of geometrical accuracy, and from structure analysis only to fluid–structure interaction (FSI) analysis, with computational examples from our group, while hemodynamic studies of atherosclerotic plaques will not be reviewed in the chapter.
2 Biomechanical Study of Plaque Vulnerability
The hypothesis behind this group of studies is that plaque rupture is a mechanical failure of thin fibrous cap. The tendency of a plaque to rupture is due in part to increases in mechanical stress in fibrous cap [7, 16, 27, 56]. Various studies [53] have revealed that plaque rupture often occurs in the shoulder regions of plaques, the high stress concentration region due to the significant difference in stiffness between fibrous cap and underlying lipid pool [7, 27]. The main hypotheses for plaque rupture suggested by biomechanical community are as follows:
1.
Local maximum stress: The local maximum stress in fibrous cap region, which is higher than the critical stress value which fibrous cap tissue can sustain, usually is considered to be the main reason of rupture in terms of biomechanics factors [7, 13, 15, 65, 66]. A critical value of 300 kPa has been proposed by Cheng et al. [7] for coronary arterial plaque, based on their 2D stress analysis with ruptured and stable atherosclerotic lesions.
2.
3.
4.
De-bonding effect by microcalcification: The hypothesis for vulnerable plaque rupture due to stress-induced de-bonding around cellular microcalcification in thin fibrous caps was proposed [74] based on the fact that cellular-level microcalcifications in a thin cap can cause local stress concentrations that lead to interfacial de-bonding. It should be mentioned that the “de-bonding effect” also can be categorized into the hypothesis of “local maximum stress” because of extremely high stress caused by microcalcifications.
Comparing with the others, the local maximum stress hypothesis is the most wildly accepted one. However the biomechanical factors related to rupture hypothesis have not been fully verified in vivo, due to the difficulties such as (1) there is no technique that can directly measure wall stress in the plaque in vivo, and (2) the geometry of a specific plaque at pre- and post-rupture status is practically unachievable. Nonetheless, to work on any stress-related hypothesis, obtaining accurate stress distribution on the specific plaque is essential. While there is no better way to accurately measure the stress in the plaque, numerical methods have been extensively applied to obtain the stress in the plaque region, especially finite element method (FEM). The realistic plaque geometry with multicomponents including lipid region, fibrous cap, etc., is generally used to construct a FEM model together with physiological mechanical loading to predict the mechanical stress distribution in a plaque.
Finite element models have been developed from 2D to 3D, from idealized models to patient-specific plaques in terms of geometrical accuracy, and from structure analysis only to FSI analysis in terms of physical phenomenon reality. There are normally five main tasks involved in building a plaque mechanical stress analysis model which include (a) to acquire plaque components; (b) to reconstruct plaque geometry; (c) to apply mechanical load and dynamic boundary conditions; (d) to define suitable material constitutive models; and (f) to perform FEM simulation and post-processing. Table 7.1 lists breakdowns of each task for different levels of complexity of simulations. The following sections provide a brief review of the simulation technique developments, in the order of 2D structure-only stress analysis, 3D structure-only stress analysis, 3D fluid-only models and results, and 2D/3D FSI results.
Table 7.1
Summary of research on biomechanical study of plaques
Papers | Models source | Results |
|---|---|---|
2D structure stress analysis | ||
[44] | Idealized models | Fibrous cap thickness is an critical factor affecting plaque stress |
[7] | Histology | Plaque ruptures at high stress location |
[11] | IVUS + Idealized model | The fibrous cap thickness can greatly affect the peak stress |
[4] | Histology | Proper material models with multicomponents in plaque stress analysis are of very importance |
[79] | Histology | Stress prediction showed low sensitivity to the chosen material models |
[36] | Histology | Significant correlation between MMP-1 and circumferential stress |
[26] | MRI + Histology | Macrophage locations correlated with peak plaque stress |
[22] | Histology | A limited relation found between inflammation and extreme stress |
[27] | Histology | Calcification may stabilize plaques |
[6] | OCT | Realistic plaque geometry and components are important |
MRI | Peak stress in symptomatic patients is much higher | |
[73] | MRI | Plaque stress related to plaque stability |
[84] | MRI + Histology | Vulnerability index was proposed based on stress analysis |
[68] | MRI | Local critical stress was suggested for plaque vulnerability assessment |
[54] | Histology | Residual stress/strain may greatly affect plaque stability |
[55] | Histology + US | Residual stress/strain may just have limited effects on the plaque stress |
[70] | MRI | Luminal curvature can affect plaque stress condition |
3D structure stress analysis | ||
[25] | Idealized 3D model | Calcification locations matter in plaque stability |
[30] | Idealized 3D model | Plaque shape, size, remodeling, etc., affect longitudinal plaque stress |
[23] | MRI | A nonlinear anisotropic multilayer material model was developed |
[17] | Image-based 3D model | Plaque fissuring/dissection could cause localized mechanical trauma |
[10] | MRI | Plaque rupture was simulated |
[53] | IVUS | Plaque ruptures at locations of high stress |
[80] | Cine angiographic images | Plaque structure/components are key issues in stress prediction |
Fluid structure interaction analysis | ||
[83] | MRI | Certain locations with high wall stress and low wall shear stress were identified in healthy carotid artery |
[82] | MRI | Biomechanical factors effects on atherogenesis |
MRI + Histology | Biomechanical factors were correlated with histological analysis | |
[40] | 2D idealized model | Low stenosis plaque with thin fibrous cap may have high rupture risk |
[41] | 3D idealized model | The effects of wall motion in plaque development and rupture |
[5] | 3D idealized model | Microcalcification in fibrous cap could increase plaque vulnerability |
[34] | MRI-based 2D model | Plaque stress can help in vulnerability assessment |
MRI | 3D FSI plaque stress with MRI has been developed and discussed | |
[81] | MRI | Comparison between structure-only and FSI model was conducted |
MRI | The determination of plaque shrinkage and stress-free state in plaque; intraplaque hemorrhage is associated with higher plaque stress | |
[8] | CT | Curvature difference in plaque region could be an important factor |
2.1 Two-Dimensional Structure-Only Stress Analysis
Since 1990s, 2D structure stress analysis has been extensively applied to plaque models for predicting stress distributions from idealized models to patient-specific models. The advantage of using idealized models is that they allow easy changing of geometrical parameters to investigate effects of individual plaque features. Loree et al. [44] studied the effects of plaque structure features including stenosis severity and fibrous cap thickness on stress distributions based on idealized plaque models. They found that decreasing the fibrous cap thickness considerably increased the peak circumferential stress, while increasing the stenosis severity decreased peak stress, suggesting that ruptured plaques may not associate with high stenosis degree. Cheng et al. [7] studied the relation between the locations of peak stress in ruptured plaques and rupture sites for the same plaque. The results showed that most plaque rupture sites occurred very close to regions of high stress; however, the peak stress did not always coincide with the rupture site. They also found that the maximum circumferential stress in plaques that ruptured was significantly higher than maximum stress in stable specimens; a critical stress value of 300 kPa has been proposed for predicting plaque rupture. Finet et al. [11] studied the effect of fibrous cap thickness to plaque stress with 2D idealized models. They found that irrespective of plaque geometry and composition, a fibrous cap thickness of less than 60 μm results stresses greater than 300 kPa.
By using heterogeneous material model for stress analysis in human atherosclerotic aortas, Beattie et al. [4] found that the distribution of stress and strain energy was strongly influenced by plaque structure and compositions, indicating that a proper material model with multicomponents in plaque stress analysis is of very importance. Williamson et al. [79] studied the sensitivity of wall stresses in diseased human coronary arteries to varied material properties. They showed that stresses in the artery have low sensitivities to variations in elastic modulus and comparable among isotropic nonlinear, isotropic nonlinear with residual strains, and transversely isotropic linear models. However, the stress in the stress concentration regions can vary up to 30% with different material models from the same work. Huang et al. [27] investigated the effect of calcification towards plaque stability in human atherosclerotic coronary arteries, suggesting that calcification does not decrease the stability of the plaque. However, Veress et al. [75] believed that the location of calcification could play an important role in plaque stability. Calcification deep in plaques could have little effect on stability, and may even stabilize the plaque from rupture, while calcification in the fibrous cap could contribute to the plaque rupture due to the great difference in stiffness, and increasing the stress in the fibrous cap, especially the interface between calcification and fibrous cap. Figure 7.2 presents a 2D plaque stress analysis from histology analysis of the carotid plaque corresponding to Fig. 7.1 from our group. The discretized carotid geometry is shown in Fig. 7.2a. Arterial wall was assumed to be linear in material properties with 1 MPa Young’s modulus, and 0.45 for Poisson ratio. A luminal pressure of 110 mmHg was applied. Figure 7.2b shows the corresponding Von-Mises stress distribution. The fibrous cap experiences much higher stress than other regions and the maximum stress region can be found in the shoulder of the plaque with maximum value of 253 kPa. Figure 7.2c shows the detailed stress distribution in a local stress concentration adjacent to lipid core, which experiences very low stress. This high plaque wall stress level inside fibrous cap has been believed to be related to plaque rupture.
Fig. 7.2
(a) Discretized plaque geometry from histology section; (b) stress distribution; (c) detailed stress distribution in fibrous cap
Stress analysis also has been combined with the findings from histological analysis to study the possible interaction between inflammatory activities and extreme stress environments in fibrous cap. Lee et al. [36] demonstrated that there are some correlations between high circumferential stress regions and MMP expression in human atherosclerotic coronary arteries, by considering that the degradation of the collagenous extracellular matrix at high stress regions will further weaken fibrous cap and promote plaque rupture. Howarth et al. [26] correlated the macrophage locations and plaque stress distributions by using ultrasmall superparamagnetic iron oxide contrast agent (USPIO)-enhanced MRI in a patient with symptomatic severe carotid stenosis. Their findings supported that macrophage locations correlated well with maximal predicted stresses in the plaque. Studies from Hallow et al. [22] by using a 2D heterogeneous finite element model and the corresponding distributions of selected inflammatory markers have identified the progression-dependent relationships between stress and both macrophage presence and MMP-1 expression, suggesting the role of mechanical stress in stimulating the inflammatory response, which will help explain how mechanical factors may regulate plaque remodeling.
However, many of those studies [4, 7, 27, 36] are based on the geometry from histology analysis of plaques for predicting stress distribution or on idealized plaque models. The distortion caused in the histological tissue processing procedure has not been considered in the models. Plaque geometry based on histological analysis may be totally different from in vivo state [47]. Figure 7.3a shows an ultrasound scanning slice of an ex vivo carotid plaque sample from our lab, and Fig. 7.3b shows the corresponding histological section; the great distortion in histological process can be found by comparing Figs. 7.3a and 7.3b. As the consequence, the predicted stress distribution based on the distorted/idealized geometry may not actually reflect the real stress distributions in plaques. Efforts have been made to use modern in/ex vivo medical imaging techniques for more realistic stress predictions. Ohayon et al. [52] used pre-angioplasty IVUS images of human atherosclerotic coronary arteries to predict plaque rupture locations. Chau et al. [6] performed stress and strain study by using optical coherence tomography images and compared those results with models from histological images. Though the stress distributions were comparable between those two models, the maximum stress was higher in the histological models. Tang et al. [62] used ex vivo MRI images for stress analysis and compared the results with histological models of human carotid plaques. The maximum and minimum stress values from histological models were 28 and 69% higher than those from MRI-based models. From high resolution of in vivo multi-spectral magnetic resonance imaging of five human carotid atherosclerotic plaques, Li et al. [39] built up multicomponents of 2D plaque models. Incompressible hyper-elastic material prosperities were used for the stress analysis. Results showed that the mean maximum stresses in ruptured plaques were much higher than those in unruptured plaques. In their following study [38], they compared the stress concentrations between symptomatic and asymptomatic patients by 2D structure analysis based on in vivo magnetic resonance imaging and found that maximal predicted plaque stresses in symptomatic patients were significantly higher, indicating the possibility that plaques with higher stresses may be more prone to be symptomatic and rupture in the near future. Similar results can be found in the study by Trivedi et al. [73]. A recent study from Teng et al. [70] showed that arterial luminal curvature and fibrous cap thickness should be considered together for better mechanical risk assessment of atherosclerotic plaques by using 2D FEM models with in vivo MRI images.
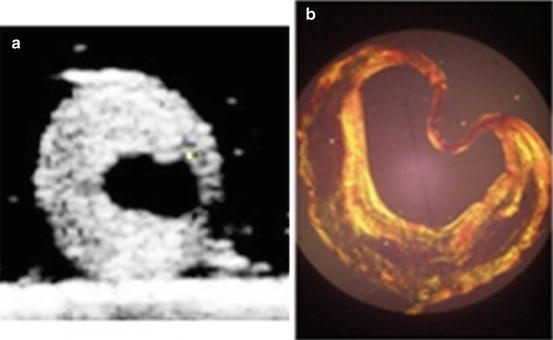
Fig. 7.3
(a) Ultrasound imaging of an ex vivo carotid plaque sample; (b) corresponding histological section of the ex vivo carotid plaque
Figure 7.4a presents one MRI slice from a carotid plaque, and by manual segmentation, the boundary points of the plaque geometry were inputted into ANSYS 11.0 to reconstruct plaque components. By applying the similar boundary condition and material properties as in Fig. 7.2, the static stress analysis was performed, shown in Fig. 7.4b. Still high stress region can be found in the fibrous cap and much lower stress level in lipid region as previous examples. Although MRI imaging can provide in vivo geometry, the classification of plaque components from MRI images still is a challenge, especially for a very thin fibrous cap.
Fig. 7.4
(a) One carotid plaque MRI slice; (b) the corresponding plaque stress analysis
Two-dimensional mechanical models of atherosclerotic plaques are abundant in the literature, and even though the results may be unrealistic, the findings could still shed some lights on the plaque rupture mechanics. The disadvantages of 2D models lie in (1) the assumptions of plane strain/stress; (2) simplified material model; and (3) distorted geometry compared to the in vivo state, which will lead to a possible overestimated plaque stress level. Therefore realistic 3D models are needed for accurate stress analysis in plaque region.
2.2 D Structure-Only Stress Analysis
3D structure-only stress analysis has been carried out based on idealized plaque models and patient-specific geometries.
Idealized 3D Plaque Models
By constructing an idealized 3D plaque model, Hoshino et al. [25] studied stress distributions around atherosclerotic calcifications and their effects on plaque vulnerability. Their findings suggested that the presence of a calcium deposit creates local increases in wall tensile stress, and it depends on the relative position of the deposit in the plaque region. Imoto et al. [30] studied the structure stress distributions in an idealized 3D plaque model in a cylindrical vessel model, and mapping the stress results with longitudinal IVUS plaque images, the effects of plaque size, shape, expansive remolding, calcification, and lipid core on the stress distributions were examined. Results showed that plaque shape, size and remodeling, as well as spatial configurations of plaque components have different effects on plaque stress.
Ex Vivo 3D Plaque Models
Holzapfel et al. [23] have performed a series of stress studies in diseased vessels by introducing a multilayer anisotropic 3D model incorporating the histological structure of arterial wall. In their studies, MR images were used to develop 3D finite element models to simulate balloon angioplasty in atherosclerotic iliac arteries. Mechanical test was performed to provide the required raw data for the formulation of nonlinear material models. They compared their 3D models with existing biomechanical models, characterized by isotropic material response, assumption of plain strain, etc. The results showed those assumptions may give a wide range of stress levels, indicating those simplifications need to be well justified when interpreting stress results with plaque rupture. By using similar nonlinear material model, Gasser and Holzapfel [17] modeled plaque fissuring and dissection during balloon angioplasty intervention in a human external iliac artery with type V lesion. Ferrara and Pandolfi [10] presented three-dimensional finite~element simulations of damaged arteries to investigate the influence of the geometry and tissue properties on plaque rupture. The cohesive elements were used to model the fracture surface induced by the mechanical action when the tensile strength of the material is reached.
In Vivo 3D Plaque Models
Ohayon et al. [53] calculated the stress in a single diseased human coronary artery from IVUS images to decide the possible relation between high stress concentrations and plaque rupture sites. The diseased arterial wall was modeled by components of adventitia, media, dense fibrosis, and cellular fibrosis with isotropic materials. A physiological mean blood pressure of 13.33 kPa was applied for the luminal loading. They found the peak stress locations from 3D model well coincided with plaque rupture location, but not in the corresponding 2D FE models, which may overestimate the stress levels. The stress and strain distributions using FEM and in vivo patient-specific dynamic 3D coronary arterial tree reconstruction from cine angiographic images have been done by Wu et al. [80], the local stresses were calculated in the diseased wall, and results showed that a smaller vessel diameter, greater percentage narrowing, and large lesion size may result in higher stress in the fibrous cap.
Compared to 2D stress analysis, 3D structure analysis could incorporate more information in FE models, such as the multilayers of arterial wall, anisotropic material model considering fiber directions, and no plain stress or strain assumptions as in 2D FE models, while there are still places left for improving in order to achieve a realistic plaque stress prediction. In a physiological situation, plaque is under pulsating blood pressure loading, with reduced pressure value in the stenosis throat due to the narrowing effect in the stenosis part. Therefore a uniform pressure loading applied on the luminal surface which is generally adopted in 3D FE structure-only models cannot simulate the realistic stress distributions. In real situation, the mechanical environment of plaques includes the blood flow dynamics and wall structure dynamics. In order to accurately predict the biomechanical environment, one must consider the hemodynamics surrounding the plaque region, and the corresponding wall dynamics under pulsating loading caused by blood flow. Therefore 3D blood flow simulation in the plaque region is required as part of plaque stress analysis.
2.3 D/3D FSI Results
In nature, blood flow in the arteries and arterial wall structure dynamics are interacted with each other. Blood flow provides the loading for arterial structure dynamics, such as pressure and the drag force in the wall. Arterial wall will deform under those loadings, and correspondingly change arterial geometry which will affect the blood flow. Therefore the FSI method simulates more accurate mechanical interaction phenomenon of artery and needs to be adopted for stress analysis in atherosclerotic plaques under physiological environment [13].
Zhao et al. [83] firstly introduced MRI-based FSI models to predict wall shear stress and wall stress patterns in healthy subjects, and tried to define regions of low wall shear stress and high wall stress. Their results demonstrated that there are certain regions with low wall shear stress and high mechanical stress, corresponding to the areas where atherosclerotic plaque develops. Younis et al. [82] used finite element simulations of fluid–solid interactions to investigate interindividual variations in flow dynamics and wall mechanics at carotid artery bifurcations from three healthy subjects. Subject-specific calculations were based on MR images of carotid artery geometries and ultrasound measured flow boundaries. Various biomechanics parameters such as wall shear stress, oscillatory shear index, and cyclic strain have been compared among subjects. Kaazempur-Morfrad et al. [31] proposed cyclic strain in describing the arterial wall dynamics under pulsatile blood pressure loading. They found that the regions of highest variations in cyclic strain are identified at frequent sites of atherosclerosis. In the study carried out by Kaazempur-Morfrad et al. [32], stress analysis was performed for four patients. In addition to the numerical study on the plaque models, the excised plaques were sectioned and stained for smooth muscle cells, macrophages, lipid, and collagen. Efforts have been given to correlate fluid dynamic parameters with histological markers of atherosclerosis.
Li et al. [40] used a 2D flow–plaque interaction model and tried to answer how critical is fibrous cap thickness to carotid plaque stability. They suggested that the presence of a moderate carotid stenosis (30–70%) but with a thin fibrous cap can also present a high risk for plaque rupture. Li et al. [41] constructed an idealized 3D plaque model with varying stenosis degrees of 30, 50, and 70%, to study the wall motion in plaque throat. The results suggested that severe stenosis may inhibit wall motion. The numerical study on the role of microcalcifications in plaque vulnerability in an eccentric stenosis model [5] showed that the vulnerable plaque with embedded calcification spots presented higher wall stress concentration region in the fibrous cap, providing the evidence for the hypothesis that microcalcifications could increase the plaque vulnerability. Kock et al. [34] developed a 2D FSI model based on in vivo MR images of two symptomatic atherosclerosis patients, and the longitudinal stress levels for each patient were calculated. They concluded that the longitudinal fibrous cap stresses may be useful in assessing plaque vulnerability.
Related posts:
 Relationship Between Plaque Echogenicity and Atherosclerosis Biomarkers
 Quantitative Computed Tomography Analysis in the Assessment of Coronary Artery Disease
 Quantitative MR Analysis for the Assessment of Carotid Atherosclerosis
 Carotid Angioplasty and Stenting
 Segmentation of Carotid Ultrasound Images
 Carotid Plaque Stress Analysis: Issues on Patient-Specific Modeling
Stay updated, free articles. Join our Telegram channel

Full access? Get Clinical Tree


