Study
Segmentation method
2D/3D
AIC
N
Ultrasound imaging
Zahalka et al. [5]
Deformable models
3D
No
69
Hamou et al. [6]
Canny edge detection
2D
No
–
Abdel-Dayen et al. [7]
Morphological based
2D
No
–
Mao et al. [8]
Discrete dynamic contour
2D
No
7
Abolmaesumi et al. [9]
Kalman filtering
2D
No
1
Gill et al. [10]
Balloon
3D
No
2
Delsanto et al. [11]
Deformable parametric model
2D
No
45
Loizou et al. [12]
Snakes
2D
Yes
80
Guerrero et al. [13]
Star–Kalman algorithm
2D
No
–
Golemati et al. [14]
Hough transforms
2D
No
56
Slabaugh et al. [15]
Region-based active contour
2D
No
–
IVUS imaging
Zhang [16]
Optimal graph searching
2D
No
20
Cardinal [17]
Fast-marching method
2D
No
200
Brusseau [18]
Statistical approach
2D
Yes
15
Olszewski [19]
Knowledge based
3D
No
21
Magnetic resonance imaging (MRI)
Xu [20]
Mean shift
2D
Yes
22
Adams [21]
Snakes, GVF
2D
No
20
Yang [22]
Dynamic programming
2D
Yes
62
Furthermore, a number of studies investigated the use of IVUS imaging of the carotid artery. Although, IVUS provides better quality images when compared with ultrasound images, it poses a certain risk to the patients due to the insertion of a catheter in the patient’s artery. A graph-searching approach to detect the wall and plaque borders from IVUS images of the carotid artery was documented in [16]. A~semiautomatic segmentation method for IVUS images based on gray-scale statistics of the image was proposed in [17], where the lumen, IMT, and the plaque were segmented in parallel by utilizing a fast marching method. In [18], an automated luminal contour segmentation method based on a statistical approach was introduced, whereas in [19] IVUS images were segmented using knowledge-based methods.
Several studies also investigated the automated segmentation in MRI of the carotid artery. Xu et al. [20] applied a mean shift density estimation algorithm to segment 22 multiple transversal MRI’s of the carotid artery. Adams et al. [21] attempted to segment the carotid plaque by using snakes based on the GVF method, in order to detect the artery, lumen, and plaque borders, where the initial contour was placed manually by the expert. The results showed a good accuracy of the segmentation algorithm. Yang et al. [22] proposed a dynamic programming approach to detect the plaque borders in each MRI frame where seed points were placed by the expert for estimating the initial plaque contour.
As shown in Table 19.1, different methods were investigated for the segmentation of the atherosclerotic carotid plaque, however, these studies were evaluated on a limited number of subjects for ultrasound imaging (although this is not the case for IVUS, see study [17]). Therefore, the need still exists for the development, implementation, and evaluation of an integrated system enabling the automated segmentation of ultrasound imaging carotid plaque. In this chapter, we propose and evaluate such a system based on normalization, speckle reduction filtering, and snakes segmentation. Four different snake methods were investigated, namely (1) the Williams and Shah [12, 24], (2) the Balloon [23], (3) the Lai and Chin [25], and (4) the GVF [26]. Preliminary results of this study were also published in [27].
2 Materials and Methods
2.1 Recording of Ultrasound Images
A total of 80 B-mode and blood flow longitudinal ultrasound images of the common carotid artery (CCA) bifurcation were selected at random representing different types of atherosclerotic plaque formation with irregular geometry typically found in this blood vessel. The images were acquired by the ATL HDI-3000 ultrasound scanner (Advanced Technology Laboratories, Seattle, USA) [28] and were recorded digitally on a magneto optical drive, with a resolution of 768 × 576 pixels with 256 gray levels. Digital images were resolution normalized at 16.66 pixels/mm (see Sect. 2.3). This was carried out due to the small variations in the number of pixels per mm of image depth (i.e., for deeply situated carotid arteries, image depth was increased and therefore digital image spatial resolution would have decreased) and in order to maintain uniformity in the digital image spatial resolution [28, 29]. The images were recorded at the Saint Mary’s Hospital, Imperial College of Medicine, Science and Technology, UK, from 32 female and 48 male symptomatic patients aged between 26 and 95 years old, with a mean age of 54 years. These subjects were at risk of atherosclerosis and have already developed clinical symptoms, such as a stroke or a transient ischemic attack (TIA).
2.2 Manual Plaque Segmentation and Classification
An expert manually delineated the plaque borders, between plaque and artery wall, and those borders between plaque and blood, on 80 longitudinal B-mode ultrasound images of the carotid artery, after image normalization and speckle reduction filtering (see Sects. 2.3 and 2.4), using MATLAB software developed by other researchers from our group. The procedure for carrying out the manual delineation process was established by a team of experts and was documented in the asymptomatic carotid stenosis and risk of stroke (ACSRS) project protocol [4]. The correctness of the work carried out by a single expert was monitored and verified by at least another expert. Usually the plaques are classified into type I–type V as documented in [4, 12]. In this study the plaques delineated were of type II, III, and IV because it is easier to make a manual delineation since the fibrous cap, which is the border between blood and plaque, is more easily identified. If the plaque is of type I, borders are not visible well. Plaques of type V produce acoustic shadowing and the plaque is also not visible well.
2.3 Image Normalization
Brightness adjustments of ultrasound images were carried out in this study based on the method introduced in [30]. It was shown that this method improves image compatibility by reducing the variability introduced by different gain settings, different operators, different equipment and facilitates ultrasound tissue comparability [30]. Algebraic (linear) scaling of the image was manually performed by linearly adjusting the image so that the median gray level value of the blood was 0–5, and the median gray level of the adventitia (artery wall) was 180–190 [30, 31]. The scale of the gray level of the images ranged from 0 to 255. Thus the brightness of all pixels in the image was readjusted according to the linear scale defined by selecting the two reference regions. It is noted that a key point to maintaining a high reproducibility was to ensure that the ultrasound beam was at right angles to the adventitia, adventitia was visible adjacent to the plaque and that for image normalization a standard sample consisting of the half of the width of the brightest area of adventitia was obtained.
2.4 Speckle Reduction Filtering
In this study, a linear scaling filter (DsFlsmv—Despeckle filter linear scaling mean variance) utilizing the mean and the variance of a pixel neighburhood was used. This filter was introduced in [32] and evaluated on ultrasound imaging of the carotid giving best results in [33]. The DsFlsmv filter may be described by a weighted average calculation using subregion statistics to estimate statistical measurements over 7 × 7 pixel windows applied for five iterations [31–33].
2.5 Plaque Contour Initialization
In most of the cases a plaque is visualized in a B-mode longitudinal ultrasound image and its size confirmed in transverse section using color blood flow imaging. However, uniformly echolucent plaques are not obvious on B-mode, and color flow imaging is needed. These echolucent plaques are seen as black filling defects. PW Doppler is used to measure velocity in order to grade the degree of stenosis and blood flow can be detected at a specific depth by selecting the time interval between the transmitted and received pulses.
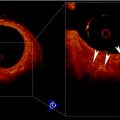
In this work the blood flow image was used, in order to extract the initial snake contour for the plaque borders in the carotid artery. The plaque snakes contour initialization procedure, carried out using both the blood flow and the B-mode images, may be described as follows (see also Fig. 19.1):
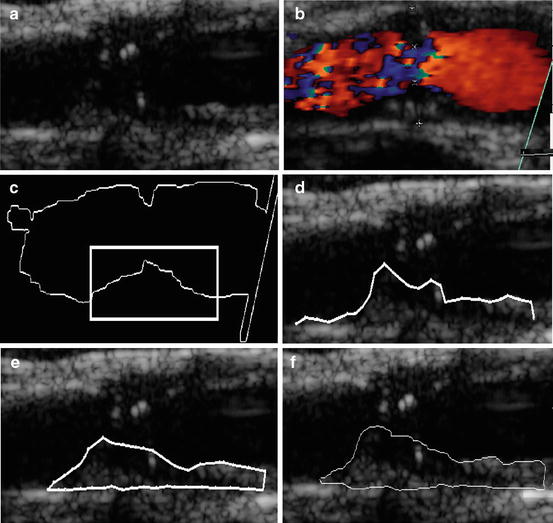
Fig. 19.1
Plaque initialization using the blood flow image: (a) original ultrasound B-mode image of a carotid artery with plaque at the far wall, (b) blood flow of the image in (a), (c) initial blood flow edge contour with the area for the initial contour selected by the user, (d) sampled initial snake contour, (e) Williams and Shah snakes segmentation of plaque, and (f) manual segmentation of plaque. Source [12], © IEEE, 2007
1.
The blood flow area is extracted from the blood flow image (Fig. 19.1bb) by searching to find all color pixels (i.e., if the red, green, and blue pixel values are different). Otherwise, pixels belong to a grayscale area. All color pixels are (set to zero) in the blood flow image. The resulting image is then cross-correlated with the B-mode image (Fig. 19.1aa) so that the blood flow edge is mapped on the B-mode image.
2.
Dilate the extracted blood flow edge image to eliminate small gaps and remove small-undesired regions.
3.
From the dilated edge blood flow image, detect the blood flow edge contour (see Fig. 19.1cc). Mark a region of interest on the edge contour (a task carried out by the user of the proposed system, illustrated by a rectangle in Fig. 19.1cc) where the lower or the upper boundary of plaque is covered. This is used as an initial snake contour.
4.
Sample the initial snake contour at 20–40 consecutive points to construct an interpolating B-spline.
5.
Connect the first and the last snake points on the initial contour to form a closed contour.
6.
8.
Deform the initial contour by the snake to accurately locate the plaque–blood borders (see Sect. 2.6).
2.6 Snake Segmentation
Four different snake segmentation methods were investigated in this study, namely (1) the Williams and Shah [12, 24], (2) the Balloon [23], (3) the Lai and Chin [25], and (4) the GVF [26]. Preliminary results of this study were also published in [27]. The parameter values for the four different snakes segmentation methods were the same in all experiments. For the Williams and Shah snake, the strength, tension, and stiffness parameters were equal to  ,
,  , and
, and  , respectively. For the Lai and Chin, the regularization parameter,
  , was varied as documented in [25]. For the GVF snake, the elasticity, rigidity, and the regularization parameters were,
  ,
,  , and
, and  , respectively [26].
, , and , respectively. For the Lai and Chin, the regularization parameter, , was varied as documented in [25]. For the GVF snake, the elasticity, rigidity, and the regularization parameters were, , , and , respectively [26].2.7 Evaluation of the Segmentation Methods
ROC analysis [34] was used to assess the specificity and sensitivity of the four segmentation methods by the true-positive fraction,  and false-positive fraction,
  [34]. The
  is calculated when the expert detects a plaque (when a plaque is present) and the computerized method identifies it as so, whereas the
  is calculated when the expert detects no plaque and the computerized method incorrectly detects that there is a plaque present. The
  fraction is calculated when the expert identifies no plaque and the computerized method identifies it as so (absent), whereas the
  is calculated when the expert identifies plaque presence and the computerized method incorrectly identifies plaque absence. Ratios of overlapping areas can also be assessed by applying the similarity kappa index,
  , [35] and the overlap index [36]. These indices were computed as follows:
 Relationship Between Plaque Echogenicity and Atherosclerosis Biomarkers
 Quantitative Magnetic Resonance Analysis in the Assessment of Cardiac Diseases
 Quantitative Computed Tomography Analysis in the Assessment of Coronary Artery Disease
 Visualization of Atherosclerotic Coronary Plaque by Using Optical Coherence Tomography
 Segmentation of Carotid Ultrasound Images
 Carotid Plaque Stress Analysis: Issues on Patient-Specific Modeling


and false-positive fraction, [34]. The is calculated when the expert detects a plaque (when a plaque is present) and the computerized method identifies it as so, whereas the is calculated when the expert detects no plaque and the computerized method incorrectly detects that there is a plaque present. The fraction is calculated when the expert identifies no plaque and the computerized method identifies it as so (absent), whereas the is calculated when the expert identifies plaque presence and the computerized method incorrectly identifies plaque absence. Ratios of overlapping areas can also be assessed by applying the similarity kappa index, , [35] and the overlap index [36]. These indices were computed as follows:Related posts:
Relationship Between Plaque Echogenicity and Atherosclerosis Biomarkers
Quantitative Magnetic Resonance Analysis in the Assessment of Cardiac Diseases
Quantitative Computed Tomography Analysis in the Assessment of Coronary Artery Disease
Visualization of Atherosclerotic Coronary Plaque by Using Optical Coherence Tomography
Segmentation of Carotid Ultrasound Images
Carotid Plaque Stress Analysis: Issues on Patient-Specific Modeling
Stay updated, free articles. Join our Telegram channel
Full access? Get Clinical Tree
