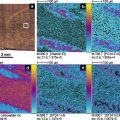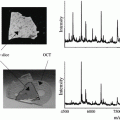
Fig. 1
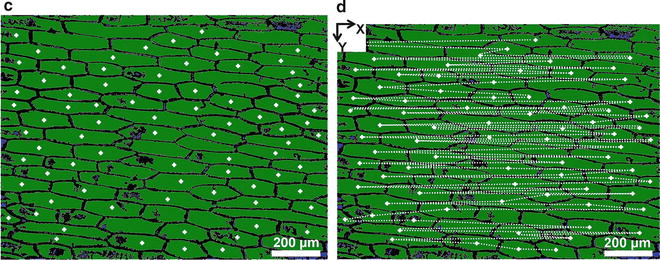
Coordinate acquisition for single-cell ablation in an optical microscope image of L. longiflorum leaf adaxial epidermis. (a) Microscope image of L. longiflorum leaf adaxial epidermis is taken. (b) Cell walls are accentuated by thresholding the grayscale levels. (c) The image is binarized and the cells are recognized as objects. Centroids of cells (marked by plus signs) are determined. (d) Scanning path for the translation-stage movement exposing cell after cell to the ablation fiber is shown by dashed line. Origin is at the top left corner of the image
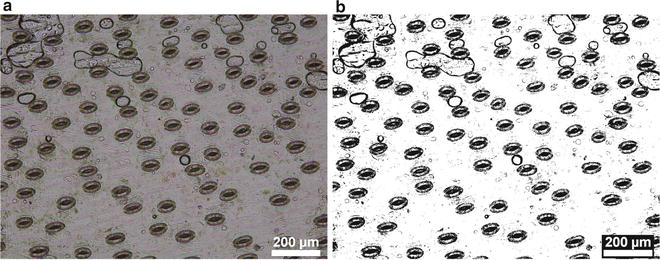
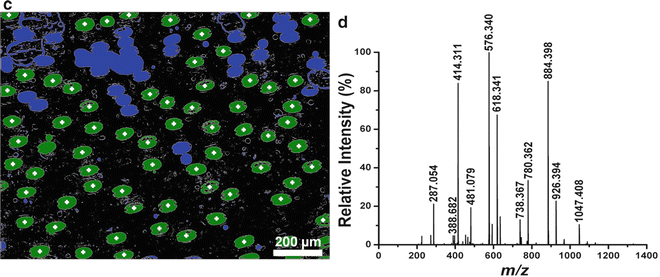
Fig. 2
(a) Microscope image of L. longiflorum leaf abaxial epidermis. (b) Thresholded image showing cell edge detection. (c) Centroids of guard cells with distinctive morphology are determined in the binarized image (marked by plus signs). (d) Mass spectrum of a pair of guard cells
3.3 Translation-Stage Automation
1.
The three-axis translation stage was configured and initialized through the stage controller.
2.
The home position in the x–y plane and the elevation of the fiber tip in the z direction were optimized according to the sample geometry. There were two specific values for the fiber tip elevation. The “operational height” was determined by optimizing the laser ablation efficiency. The “relocation height” was more elevated to ensure unobstructed stage movement from one cell to another during scanning.
3.
A set dwell time was determined based on the number of laser pulses needed to ablate a single cell.
3.4 LAESI-MS on Single Cells
1.
The microscope slide holding the cell layer (e.g., L. longiflorum leaf abaxial epidermis or A. cepa epidermis) was carefully moved from the upright microscope to the translation stage in front of the mass spectrometer (see Note 5 ).
2.
The top-view and side-view cameras were adjusted to allow clear observation of the selected tissue and the etched fiber tip.
3.
To accurately locate the origin of the coordinate system selected under the imaging microscope and position it under the fiber tip, the unique cell or feature in its environment was found through the top-view camera (see Note 6 ).
4.
The fiber tip was lowered to a distance of 30–15 μm above the sample surface (“operational height”) and adjusted in the x–y plane to be located above the origin of the coordinate system defined over the sample (see Note 7 ).
5.
The syringe pump operating at a flow rate of 300 nL/min supplied the electrospray solution to the tapered stainless steel emitter. Stable electrospray was generated by applying a high voltage (2,800–3,000 V) on the metal union of the electrospray system.
6.
The cell coordinates and scanning parameters were imported into the stage-control program.
7.
The mid-IR laser was initialized and the pulse energy and repetition rate were optimized to enable the highest signal-to-noise ratio in a single-cell mass spectrum without affecting neighboring cells or breaking the fiber tip.
8.
Acquisition parameters for the mass spectrometer (e.g., mass range: m/z 20–1,500, scan rate: 1 s/scan, positive ion acquisition mode) were selected.
9.
The acquisition of mass spectra was initiated.
10.
The pulses from mid-IR laser were fired at the first cell and simultaneously the stage-control program was started. The translation stage was directed to present the selected cells one by one to the tip of the ablation fiber. Figure 1d shows the path of movement on the L. longiflorum leaf adaxial epidermis.
11.
When the data acquisition process was completed, all instrument components, including sample scanning, mid-IR laser, and electrospray, were stopped.
3.5 Cell-by-Cell Images
1.


Mass spectra were analyzed to evaluate metabolites levels of individual cells. For example, in an experiment to study the molecular composition of cells with a particular morphology, the mass spectrum from a pair of guard cells of the L. longiflorum leaf abaxial epidermis was acquired (see Fig. 2d). Ions of interest, such as m/z 884.398 and 926.394, were identified as steroidal glycosides by separate tandem MS experiments and were consistent with previous studies [16, 17].
Stay updated, free articles. Join our Telegram channel

Full access? Get Clinical Tree


