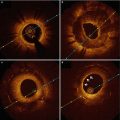
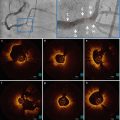
Fig. 4.1
Ruptured thin-capped fibroatheroma. Consecutive OCT frames in a 73-year-old male patient presenting with anterior STEMI (ST elevation myocardial infarction). After thrombus aspiration, adequate image quality could be obtained. At the culprit lesion site, a thin-capped fibroatheroma (TCFA) was identified. In most cases of ruptured vulnerable plaque causing acute coronary syndrome, there is a varying degree of thrombus accumulation involved. It is not always easy or even possible to discriminate between remnants of the ruptured plaque and thrombus. In panel a, a highly backscattering structure with strong attenuation properties is observed at 12 o’clock, compatible with a red thrombus (double dagger). In the adjacent frames, the exact site of TCFA rupture becomes evident (panel b, indicated by ‘£’ at 10 o’clock). In panel c, an image with mixed TCFA characteristics (4–11 o’clock) and possible red thrombus superposition can be observed. The asterisk is indicating the guide wire artifact
4.2 Systematic Approach to Image Acquisition and Interpretation
For the correct interpretation of individual OCT studies, we propose a systematic and step by step approach. Non-compliance with these basic principles will potentially lead to a waste of time and resources, associated with extra costs and loss of information and negatively reflect on operator performance and patient safety.
1.
Baseline characteristics- To fully exploit the huge amount of information from a set of OCT pullbacks, acquired during an interventional procedure, a clear understanding of the purpose of the examination is essential. These include demographic factors (age, sex…), the clinical presentation, and the information from the angiogram (such as haziness, relation of the segment of interest to angiographic landmarks etc…). It is important always to consider what the particular clinical or research question of the investigation is. For example, specific characteristics such as plaque erosion or spontaneous coronary artery rupture predominantly occur in young females [3, 14]. In the setting of stent thrombosis, the time elapsed since the initial implantation of the device is important for the interpretation of the burden of uncovered struts or adverse neointimal reactions, such as neoatherosclerosis [15].
2.
Pullback quality- Before starting the interpretation of an acquisition, it is advised to first perform an initial quality check (which can be done in only a couple of seconds) after which feedback can be given to the operator. In case of important and remediable shortcomings, there is always the possibility to perform a second and better OCT run. Key questions are: (a) is the whole segment of interest represented in the specific acquisition? (b) Was adequate blood clearance of the lumen achieved? (c) Was the imaging catheter adequately cleared from blood and air? (Fig. 4.2) (d) Has appropriate and precise calibration of the imaging catheter been performed for this pullback?
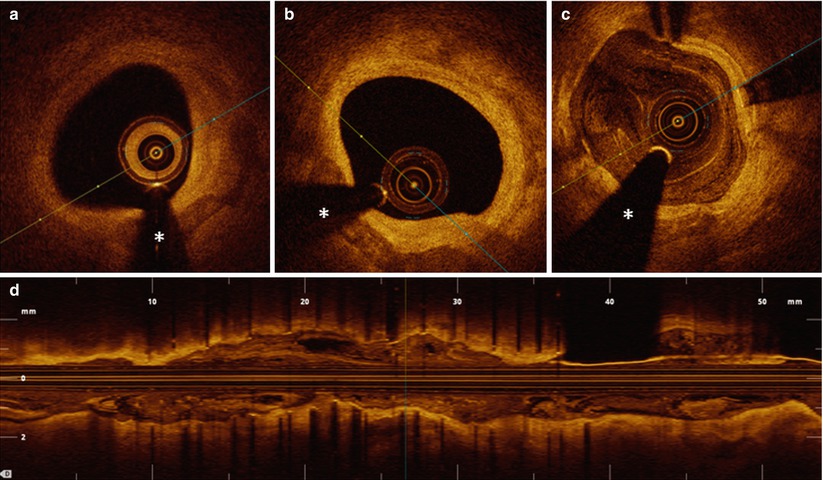
Fig. 4.2
Insufficient quality pullbacks. One of the most common sources of decreased image quality in OCT pullbacks, is the accumulation of blood between the different plastic layers of the imaging catheter, obscuring all emitted light from the laser source due to the strong attenuating capacity of the red blood cells. The imaging catheter should be flushed with a small volume of pure contrast after unpacking. Even after positioning the imaging catheter in the blood vessel for a short period of time, blood accumulation between the different layers of the catheter can occur. It is therefore strongly recommended to check for the presence of blood accumulation in the catheter before starting the pullback run. If blood is detected, it is necessary to flush the catheter again. This must be done without active stationary scanning of the laser lens, as such might lead to damage to the catheter in some instances. In panels a and b, images acquired at the same site in the coronary artery with bad vs. good catheter flush are depicted, respectively, illustrating the important loss in image quality if no adequate attention is paid to this aspect of image acquisition. Panel c (cross sectional view) and d (longitudinal view) show images of an OCT acquisition with insufficient clearance of the lumen from blood. In such cases, suboptimal positioning of the guiding catheter or inadequate contrast flush speed can be identified as the cause of insufficient clearance and can be corrected for. In some cases, such as large vessels with big diameter side branches, or in the setting of a tight lesion limiting adequate blood clearance in the distal vessel territory, it is –even with maximal operator effort- impossible to achieve optimal clearance of blood. The asterisk is indicating the guide wire artifact
3.
Longitudinal view- The next step is a general appreciation of the case, based on the longitudinal view of the segment of interest, with selection of an adequate longitudinal cutting plane. The longitudinal view of a pullback is frequently overlooked. However, it usually provides a wealth of information, such as sites of lumen encroachment and their importance, thrombus accumulation and general anatomical information on vessel size, tapering, location of side branches and longitudinal extent of diseased segments. In OCT examinations of stented segments, the longitudinal view can provide important insights on the presence of edge dissections, intramural hematomas and sites of underexpansion or malapposition (Fig. 4.3). Depending on the complexity of the case (such as in the case of a coronary segment with multiple and serial lesions), the longitudinal view of the pullback will be an important help in making a manual registration of the OCT and angiography acquisitions. Awaiting commercially available technology to co-register OCT and angiography pullbacks, the documentation of the position of the imaging catheter at the start of the pullback (or registration of the movement of the optical lens during the pullback) should be advised. Applications for co-registration of angiography and OCT acquisitions will, however, become available soon in software updates from vendors of the technology, which will help focusing on the region of interest and avoid potential mistakes. Furthermore, automatic 3D rendering is emerging and provides additional advantages over the two-dimensional L-view.
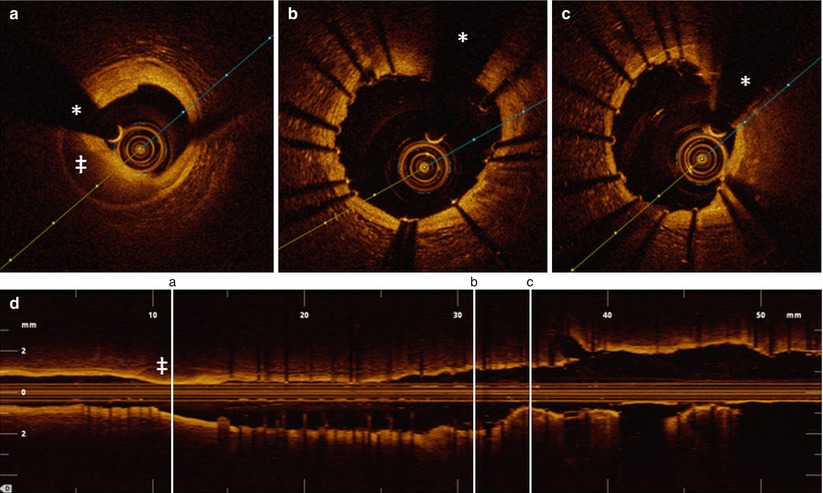
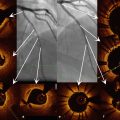
Fig. 4.3
Information obtained from the longitudinal view in OCT pullbacks. OCT acquisition immediately after implantation of two overlapping drug-eluting stents in the mid LAD in a 76-year old male presenting with stable angina. The figure illustrates that with selection of an adequate cutting plane in the longitudinal view, several important observations can already be made before starting a frame by frame analysis of the cross-sectional tomographic images. At the level of the distal stent edge, a zone with strong signal attenuation (indicated with ‡) can be observed. The corresponding cross-sectional image shows a medial dissection with blood accumulation in the vessel wall. In the same longitudinal view, a zone of relative underexpansion can be observed in cross section c, compared with better and more symmetrical expansion in panel b. Stent areas are 5.6 mm2 in panel b and 4.5 mm2 in panel c. In panel b, some malapposed struts can be observed around 2 o’clock, which (after careful inspection), can also be discovered in the longitudinal view. The upper panel figures a, b, and c correspond to a, b, and c with vertical lines on the longitudinal view (lower panel). The asterisk is indicating the guide wire artifact
4.
Images of interest- Finally, a detailed assessment of individual cross-sections of interest can be made. Apart from quality characteristics already discussed before, attention should be paid to the position of the catheter with respect to the specific frame of interest. Certain artifacts can be caused by an eccentric position of the imaging catheter. As it can lead to the mis- and overdiagnosis of thin-capped fibroatheroma (TCFA), the most important artifact to consider is tangential drop-out [16]. The main characteristic is that the tangential interaction of the light beam with the vessel wall leads to a loss of lateral resolution and the attenuation of the light beam traveling through the vessel wall almost parallel to the luminal border, creating an image closely resembling a thin-capped fibroatheroma (Fig. 4.4). We refer to Chap. 5 for a more detailed description.
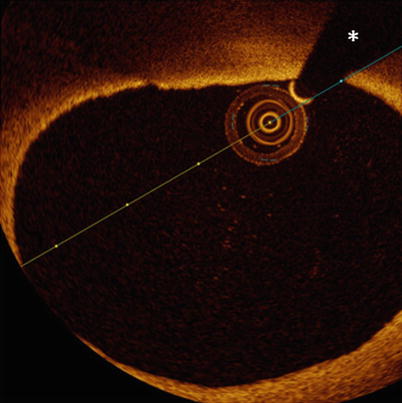
Fig. 4.4
Tangential drop out artifact. In this figure, the eccentric position of the imaging catheter creates an image resembling TCFA at 11–12 o’clock. Although the presence of a lipid pool cannot be excluded, the signal poor area under the thin layer of more intense signal tissue is probably caused by very tangential interrogation of this part of the vessel wall by the laser light. The asterisk is indicating the guide wire artifact
5.
Lumen morphology- The interpretation at the frame level starts with the appreciation of the lumen area and lumen contour. Is lumen area decreased compared to what would be expected from the reference area in a normal part of the vessel? Has the lumen contour a normal round shape or is there encroachment from the diseased vessel wall? Is the lumen contour regular or irregular? These irregularities most often are small intraluminal thrombi (to be differentiated from insufficient clearance of blood), but small indentations can be observed in lesions with important superficial calcification as well (Fig. 4.5).
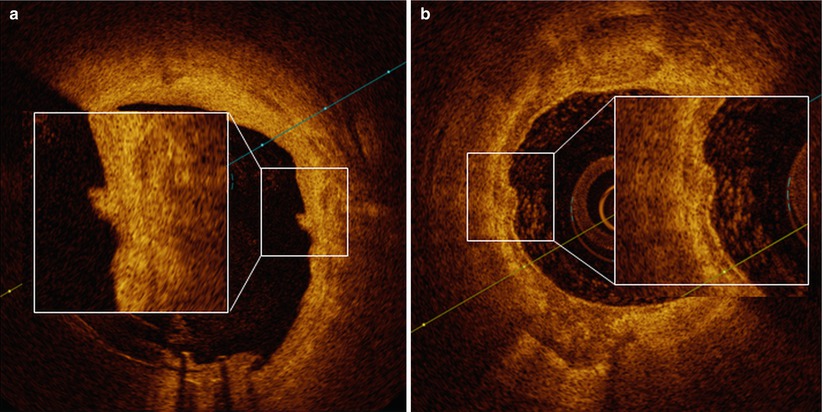
Fig. 4.5
Lumen irregularities. In panel a, a small lumen irregularity with low attenuating property is observed around 3 o’clock (magnified). In panel b, large and almost circumferential calcium accumulation is observed. Around 9 o’clock (magnified), there is a small protrusion of calcium into the lumen
Can the normal three-layered appearance (intima-media-adventitia) be recognized circumferentially in the frame? If not, it should be described in which sector this specific pattern is lost.
6.
Vessel wall- If any abnormal pattern in the lumen or the vessel wall is encountered, it is important to check the trajectory between this particular finding and the center of the imaging catheter. Any abnormality (such as blood or air bubbles in the catheter or thrombus around the imaging catheter or the coronary wire) can cast a shadow on the underlying vessel wall, which sometimes leads to misinterpretation (Fig. 4.6).
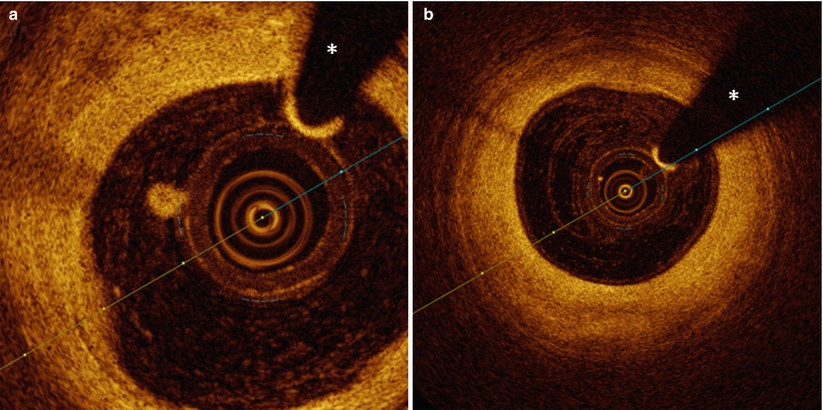
Fig. 4.6
Small luminal adhesions. In panel a, a small accumulation of fibrin or blood platelet-rich white thrombus adheres to the imaging catheter and casts a shadow on the underlying vessel wall between 9 and 10 o’clock. In panel b, equally around 10 o’clock, a small impurity in the outer plastic sheath of the catheter can be observed, casting a very fine shadow. The asterisk is indicating the guide wire artifact
In cases where the normal three-layered aspect of the vessel wall is lost, a systematic approach to describing various states of disease should be used. Key determinants are the intensity of the backscattered light signal, the demarcation between layers with different optical characteristics and the attenuation characteristics of the tissue. Careful attention to these characteristics can almost uniformly discriminate between fibrous, fibrocalcific, lipid plaques and all mixed forms. [13]
For the interpretation of specific structures, a profound knowledge of the optical characteristics, the pathophysiology of the coronary artery and particularities of different invasive treatment options is required.
Often, a single frame does not offer reliable insights into a problem at once. It is strongly advised to scroll between adjacent frames before making conclusions.
7.
Image quantification- Together with the interpretation of OCT images, measurement of the lumen or stent area and of specific structures is often required. Accuracy of all measurements relies on a careful calibration of the imaging catheter, a frequently overlooked issue [17]. Even small insufficiencies in correct calibration can lead to important deviations in measurements. It is important to mention that catheter calibration can be corrected off-line as well.
8.
Multiple frames- In some cases, particular findings can only be observed in a limited number of frames. It could be worthwhile to repeat the acquisition with slower pullback speed, in order to acquire a higher number of frames and enhance sampling in the longitudinal direction.
9.
Pullback information- The recording of the findings of the case (including vessel and segment studied, information whether thrombectomy or predilatation was performed) is strongly advised so that later interpretation is not hampered by a lack of crucial information.
Report Form
1.
Administrative data (age, sex)
2.
Clinical presentation
3.
Indication for the examination:
Diagnosis making, PCI optimization, stent failure (stent thrombosis, in stent restenosis)
4.
Pullback vessel-location, pullback length and speed, flush (manual vs. automatic), flush type of contrast (speed, volume)
5.
Quality
6.
Complications
7.
Particular findings (artifacts…)
8.
Main finding
9.
Impact (did OCT acquisition change practice in this particular patient)
4.3 OCT Characteristics of Coronary Artery Disease
For discriminating specific OCT characteristics of atherosclerotic disease, we offer a description that follows the classification as described in the first consensus document of the International Working Group for Intravascular Optical Coherence Tomography Standardization and Validation [13].
The normal coronary artery wall is recognized by a typical three-layered structure, where intima, media and adventitia can be clearly defined. The intima, the most inner layer of the vessel wall, is characterized as a signal-rich, highly backscattering layer of tissue. It can be very thin, as is usually the case in young individuals. However, with advancing age, the thickness of the intima gradually increases. Although arbitrarily chosen, a thickness of 300 μm is considered as the cut-off between normal intima and intimal thickening. The OCT appearance of such intimal thickening is usually characterized as a homogenous signal rich area. Small areas of lower signal intensity can sometimes be observed, compatible with small lipid accumulations. It is important to remember that intimal thickening is not considered as a state of atherosclerotic disease (Fig. 4.7).
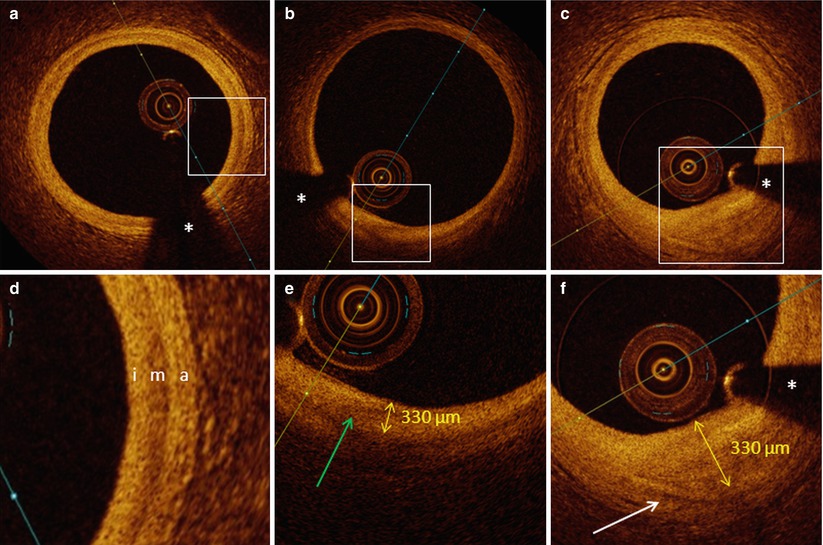
Fig. 4.7


Normal vessel wall, intimal thickening and fibrous plaque. In panel a (with magnification in panel d), the typical three-layered structure of the vessel wall is visualized, with a thin highly backscattering intima (i), a more signal poor media (m), which can present with slightly varying thickness and a highly backscattering adventitia (a). In panel b (magnification in panel e), a region with intimal thickening is described between 6 and 7 o’clock. The intimal thickness (measured from the luminal border to the beginning of the media) is 330 μm. The green arrow is indicating a zone with lower signal intensity within the region of intimal thickening, compatible with beginning lipid deposition. In panel c (magnification in panel f), a fibrous plaque is shown. Due to the poorly attenuating properties of the fibrous plaque, it is still possible to see the media bordering the fibrous plaque (white arrow) (distance from luminal border to media is 850 μm). The asterisk is indicating the guide wire artifact
Related posts:

Stay updated, free articles. Join our Telegram channel
Full access? Get Clinical Tree
