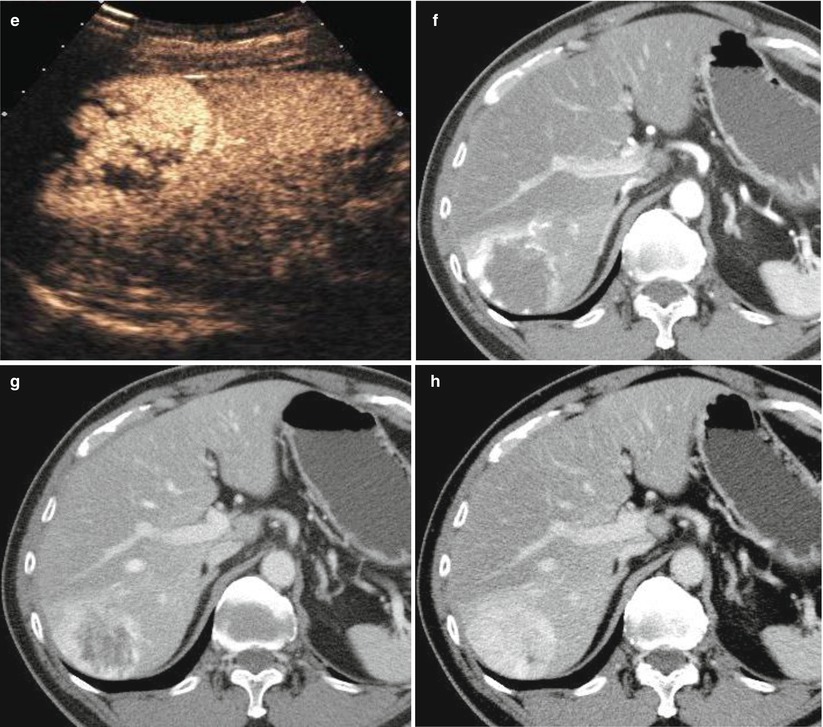
Fig. 3.1
Hemangioma in a 60-year-old man. Oblique ultrasound (US) image (a) shows a heterogeneous hypoechoic mass in the liver which shows internal and marginal vascularity on power Doppler ultrasound (b). The mass demonstrate peripheral, nodular, and discontinuous enhancement on contrast-enhanced ultrasound (CEUS) in the arterial phase (AP) (c) and progressive centripetal enhancement in the portal venous phase (PVP) (d) and the delayed phase (DP) (e). Contrast-enhanced CT images in the AP (f), PVP (g), and DP (h) demonstrate contrast enhancement pattern similar to contrast-enhanced ultrasound
3.10.2 Typical Hemangioma on MR Imaging
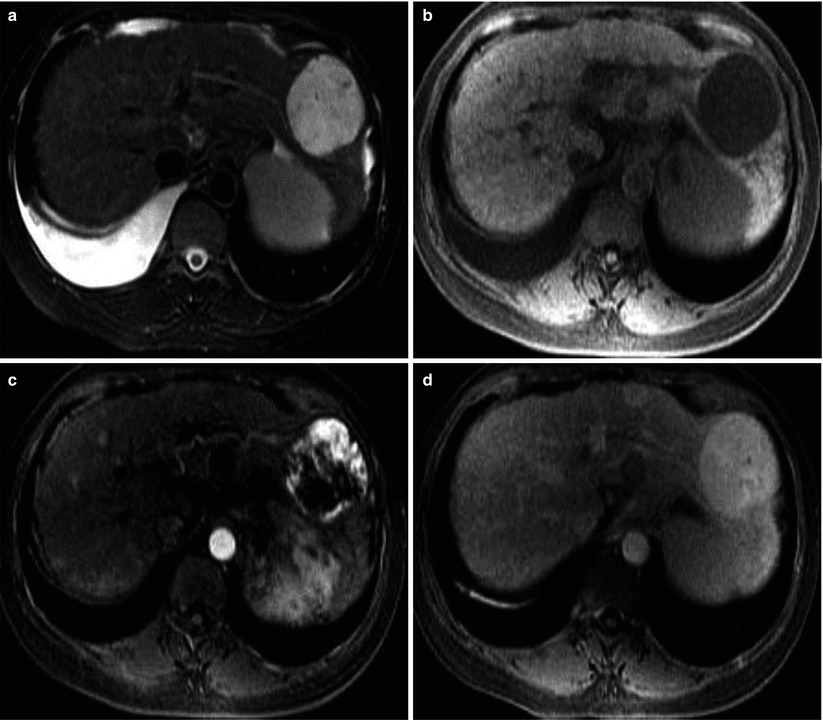
Fig. 3.2
Hemangioma in 54-year-old woman. T2-weighted MRI (a) shows a markedly hyperintense mass in the left lobe. The mass is hypointense on T1-weighted image (b). Contrast-enhanced T1-weighted images in the AP (c) and DP (d) demonstrates peripheral nodular enhancement and subsequent central fill-in
3.10.3 Rapid-Filling Hemangioma with Arterioportal Shunt
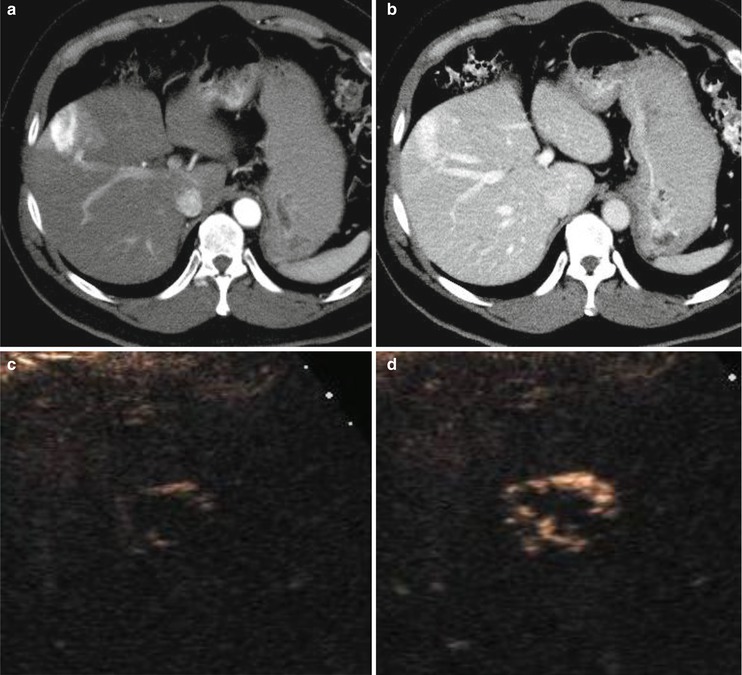
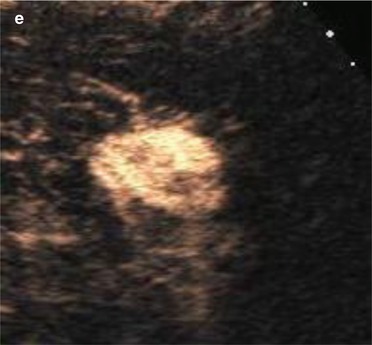
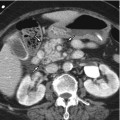
Fig. 3.3
Rapid-filling hemangioma in a 55-year-old man. AP (a) and PVP (b) contrast-enhanced CT images show a hepatic mass with strong homogeneous enhancement without typical peripheral nodular enhancement pattern of hemangioma due to rapid enhancement. There is a wedge-shaped hyperenhancement in surrounding liver parenchyma, consistent with associated arterioportal shunting. CEUS images at 10 (c), 11 (d) and 15 s (e) after contrast injection demonstrate a peripheral nodular enhancement with rapid central fill-in, utilizing the capability of real-time evaluation of contrast enhancement
3.10.4 Slow-Filling Hemangioma
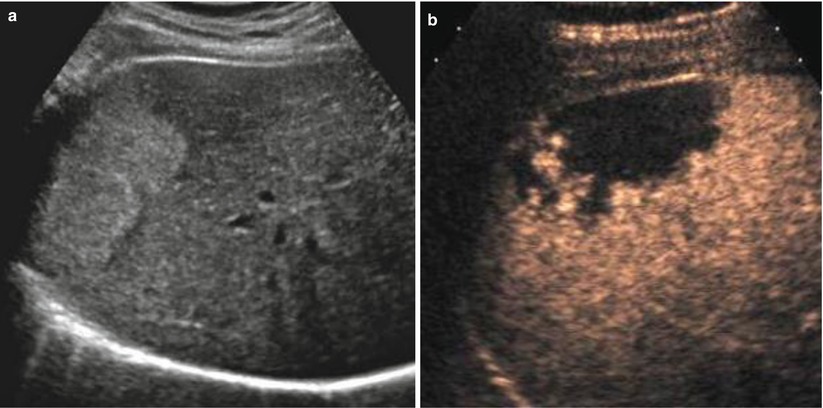
Fig. 3.4
Slow-filling hemangioma in a 49-year-old woman. Transverse US scan (a) shows a homogeneous echogenic mass in the liver. CEUS at 3 min after contrast injection (b) shows small peripheral nodular areas with enhancement and a large central non-enhancing area
3.10.5 Hemangioma in Liver Cirrhosis
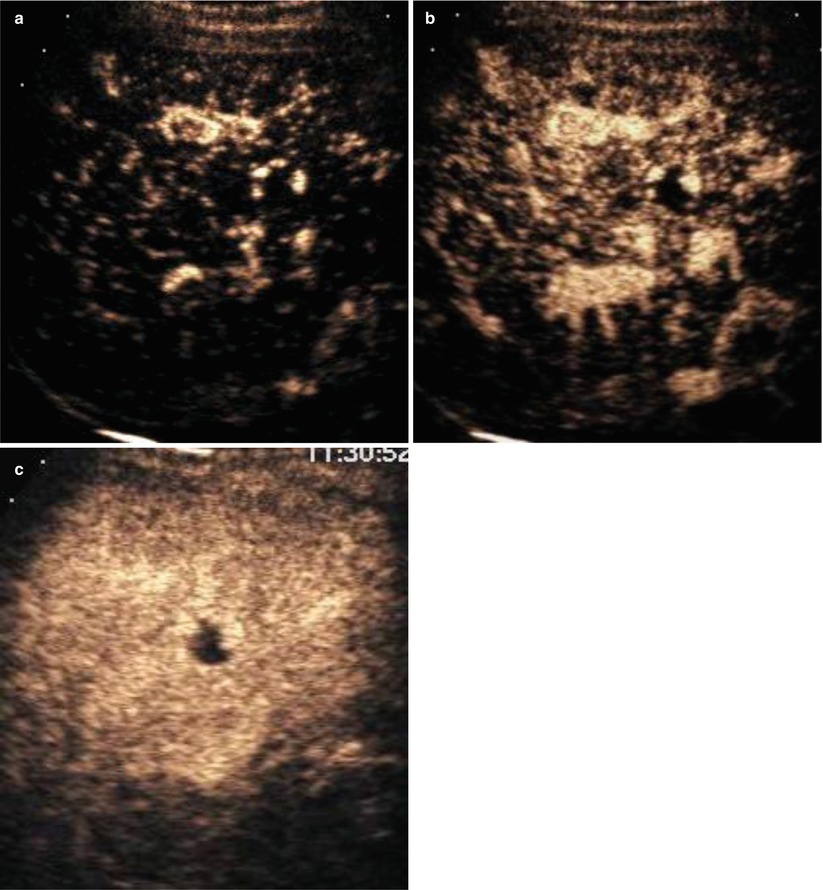
Fig. 3.5
Hemangioma in a 50-year-old man with hepatitis B cirrhosis. CEUS images at 15 (a), 20 (b) and 45 s (c) after contrast injection demonstrate a peripheral nodular enhancement with central fill-in, providing an immediate benign diagnosis of hemangioma which prevent further imaging studies in a high-risk patient for hepatocellular carcinoma
3.10.6 Slow-Filling Hemangioma in Fatty Liver
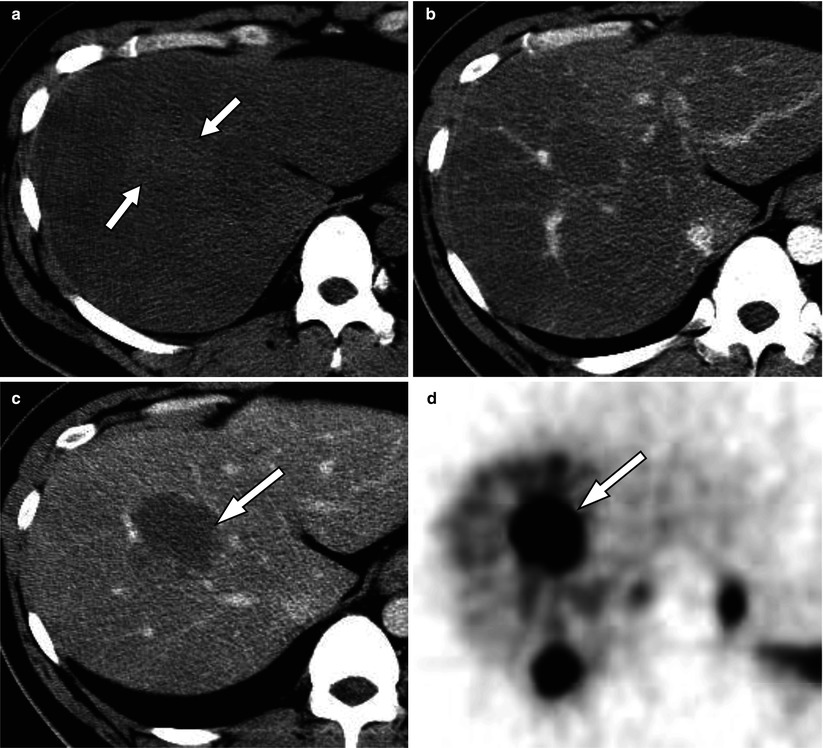
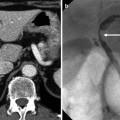
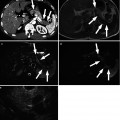
Fig. 3.6
Slow-filling hemangioma in a 65-year-old man with severe fatty liver. Unenhanced CT (a) shows severe fatty liver infiltration with a faintly hyperattenuating mass (arrows). Following contrast administration the mass is hypoattenuating to the adjacent liver parenchyma in the AP (b) and PVP (c) with a faint nodular peripheral enhancement in the PVP (arrow). The mass (arrow) shows intense uptake on Technetium-99 m red blood cell scan (d)
3.10.7 Hemangioma with Interval Growth
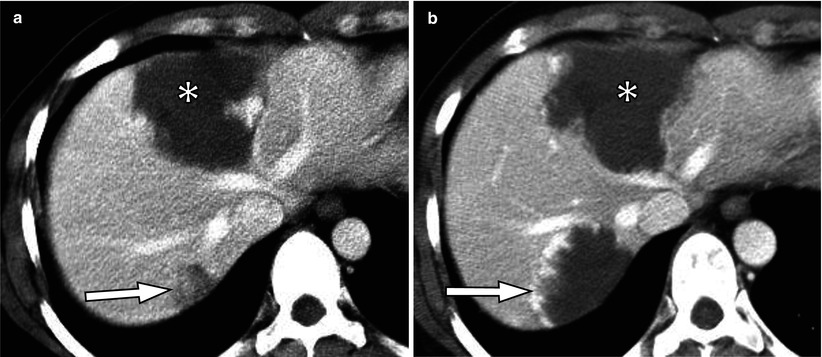
Fig. 3.7
Hemangioma with interval growth in a 77-year-old woman. PVP CT scan (a) shows small hypoattenuating mass (arrow) and a large mass with peripheral nodular enhancement (asterisk). Follow-up CT scan 4 years later (b) shows a typical hemangioma (arrow) which has markedly enlarged compared to the previous scan. Another typical hemangioma is stable (asterisk)
3.10.8 Hemangioma with Interval Regression
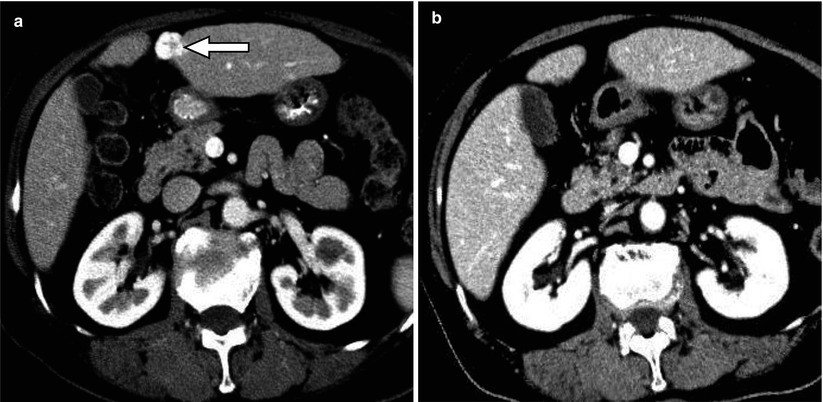
Fig. 3.8
Hemangioma with interval regression in a 56-year-old man with liver cirrhosis. Contrast-enhanced CT (a) shows a small hemangioma in the left hepatic lobe (arrow). The mass is not seen on contrast-enhance CT 4 years later (b) due to interval regression, probably related to progressive liver cirrhosis
3.10.9 Sclerosed Hemangioma
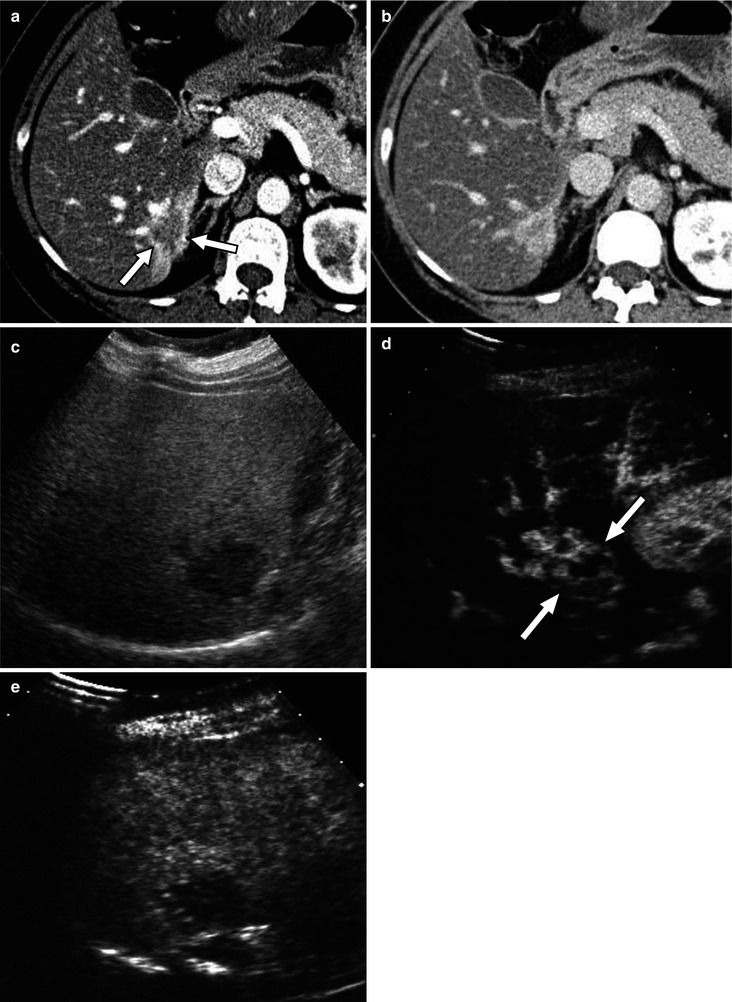
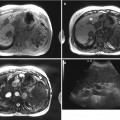
Fig. 3.9
Sclerosed hemangioma in a 49-year-old woman. Contrast-enhanced CT in the AP (a) shows an ill-defined mass with geographic margin and faint peripheral and nodular enhancement (arrows) with adjacent enhancement suggestive of transient hepatic attenuation difference. In the PVP (b), the mass is homogeneously hyperattenuating. On US scan (c), the mass is hypoechoic compared with adjacent fatty liver parenchyma. CEUS at 7 s (d) shows heterogeneous enhancement of the mass (arrows) followed by washout at 4 min (e)
3.10.10 Typical FNH on Ultrasound and CT
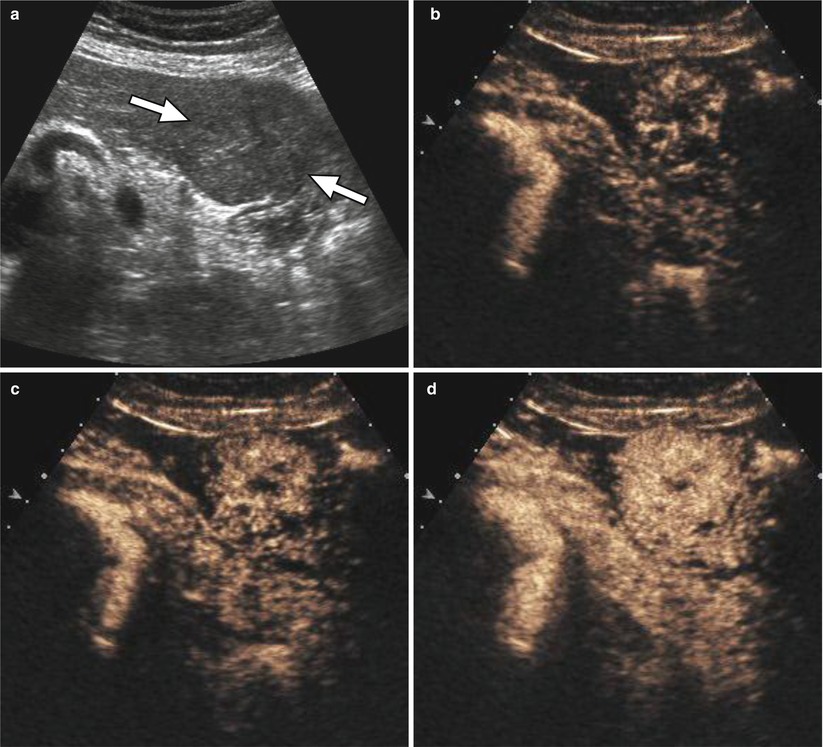
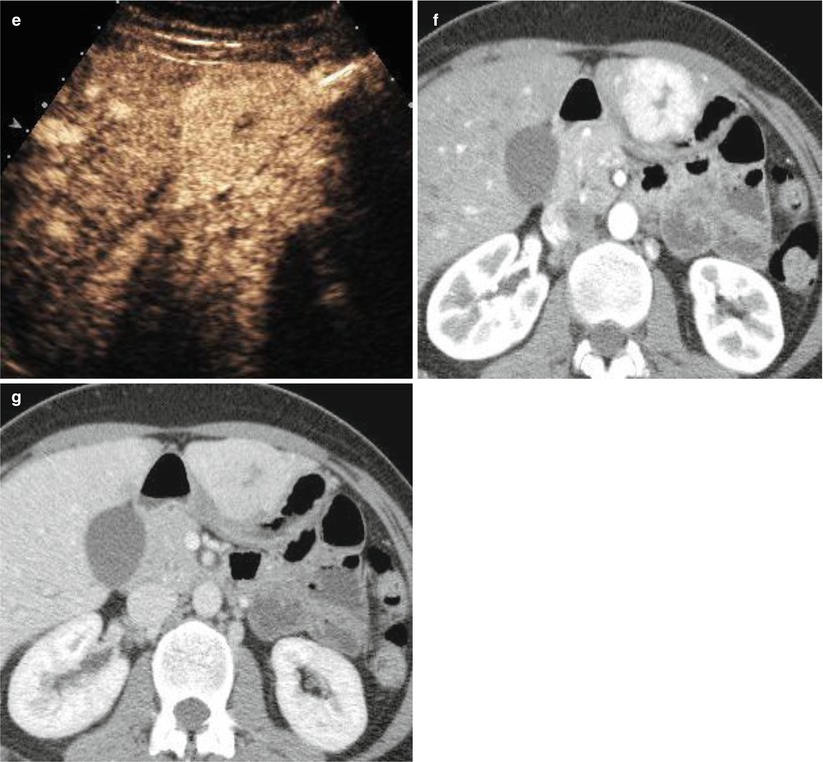
Fig. 3.10
Typical FNH in a 46-year-old woman. US scan (a) shows an exophytic, isoechoic mass (arrows) in the left hepatic lobe. The mass shows hypervascularity in the arterial phase. The enhancement begins from the center with stellate shape and progresses to the periphery (centrifugal pattern) on CEUS obtained at 18 (b), 19 (c), 23 (d), and 30 s (e) after contrast injection. The corresponding lesion shows strong, homogeneous enhancement on CT in the AP (f) and becomes isoattenuating in the PVP (g) with a central scar which is hypoattenuating in both AP and PVP
3.10.11 Typical FNH on MR Imaging with Liver-Specific Contrast
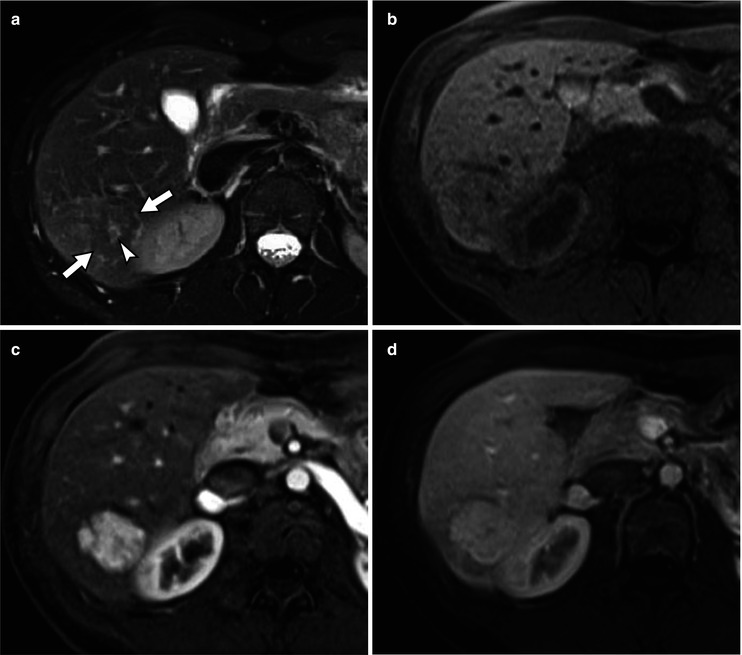
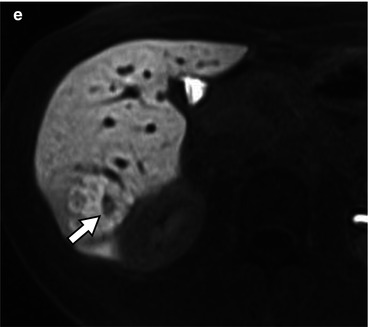
Fig. 3.11
Typical FNH in a 37-year-old woman. T2-weighted MRI (a) shows an isointense mass (arrows) with slightly hyperintense central scar (arrowhead). The mass is isointense on T1-weighted image (b) and demonstrates strong AP hypervascularity (c) and mild hyperintensity in the PVP (d) on Gd-EOB-DTPA enhanced T1-weighted images. The mass is hyperintense in the hepatobiliary phase (e) with a central non-enhancing scar (arrow)
3.10.12 FNH with Interval Growth
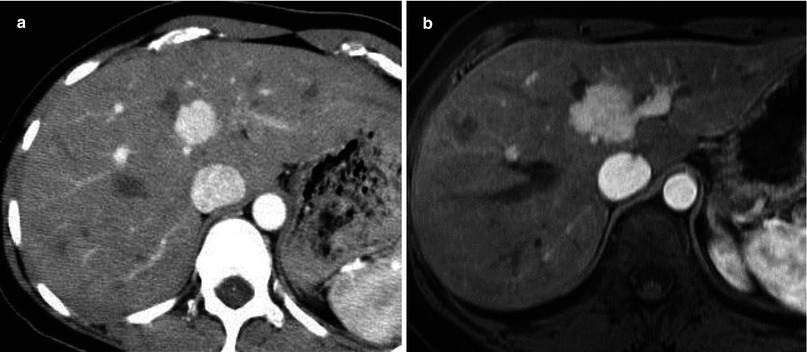
Fig. 3.12
FNH with interval growth in a 37-year-old woman. CT scan in the AP (a) shows a mass with strong, homogeneous hypervascularity. Contrast-enhanced MRI in the AP obtained 6 years later (b) shows interval increase in the size of the corresponding lesion
3.10.13 FNH with Interval Regression
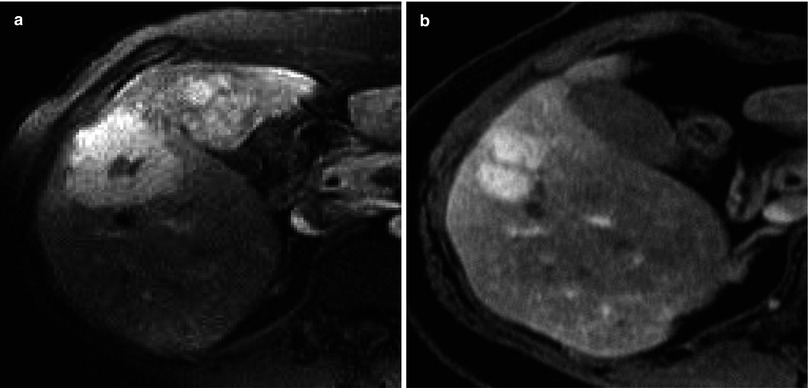
Fig. 3.13
FNH with interval regression in a 50-year-old woman. T1-weighted MRI in the AP (a) shows a hypervascular mass with a central scar, in keeping with FNH. There is marked reduction in the size of the mass in 6-year follow-up T1-weighted MRI in the AP (b)
3.10.14 Large Regenerative Nodules in Hereditary Hemorrhagic Telangiectasia
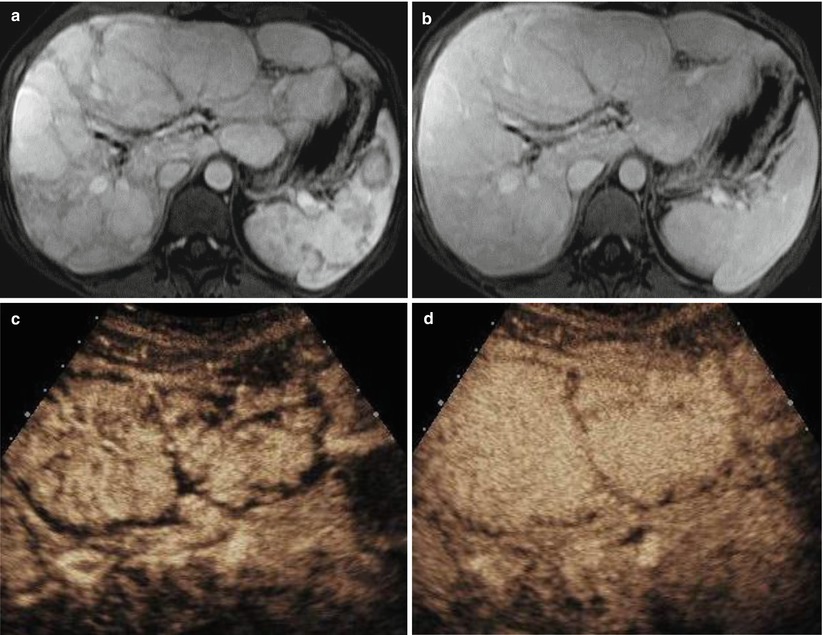
Fig. 3.14


Related posts:


Stay updated, free articles. Join our Telegram channel
Full access? Get Clinical Tree
