, Foster D. Lasley2, Indra J. Das2, Marc S. Mendonca2 and Joseph R. Dynlacht2
(1)
Department of Radiation Oncology, CHRISTUS St. Patrick Regional Cancer Center, Lake Charles, LA, USA
(2)
Department of Radiation Oncology, Indiana University School of Medicine, Indianapolis, IN, USA
Brachytherapy Definitions
Brachytherapy: Radiotherapy delivered using nuclides placed within or in contact with the target volume.
Sealed Source: Fully encapsulated.
Low Dose Rate (LDR): ≤2 Gy/h.
Temporary
Permanent
Medium Dose Rate (MDR): 2–12 Gy/h.
Almost never used for clinical treatment.
High Dose Rate (HDR): >12 Gy/h.
Pulse Dose Rate (PDR): HDR treatment for a few minutes every hour, such that the dose rate averaged over days is in the LDR range.
Unsealed Source: Brachytherapy using freely floating radionuclides (injected into a specific location, or administered systemically).
A Note on Brachytherapy
Biologically speaking, there are several major differences between brachytherapy and EBRT:
Dose Rate: EBRT (excluding TBI) is usually performed at high dose rate. Brachy may be HDR, LDR or PDR.
Dose Gradient: Most EBRT plans attempt to achieve a uniform dose within the target volume. Brachy always produces steep dose gradients.
Fractionation: Brachy is performed in far fewer fractions compared to EBRT.
LDR implants may be performed in a single procedure (especially permanent implants).
Brachytherapy: Dose Rate Effects
To a first approximation, the LDR survival curve is equal to the survival curve of many small fractions of EBRT/HDR.
This is the biological rationale for the use of PDR therapy.
Classic Dose-Rate Effect: LDR treatment results in decreased cell killing and no shoulder on the survival curve, compared to HDR/EBRT.
The magnitude of this effect directly correlates with the amount of sublethal damage repair (SLDR) in that cell type.
This is responsible for differential sparing of normal tissue with LDR, and is the biological rationale for the superiority of LDR.
Intrafraction repair goes from 0 to 100 % between dose rates of 1 Gy/min and 0.01 Gy/min (60 cGy/h) (Fig. 29.1).
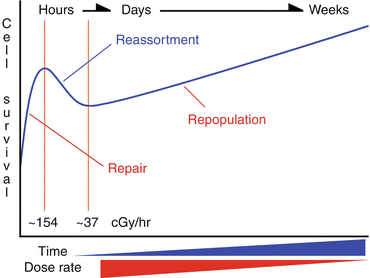
Fig. 29.1
Dose-rate to cell survival curve that illustrates the general improvement in cell kill with increasing dose rate with the exception of the region containing the inverse dose-rate effect.
Inverse Dose-Rate Effect:
Stay updated, free articles. Join our Telegram channel

Full access? Get Clinical Tree


