and Stefan Sunaert1
(1)
Department of Radiology, University Hospitals of the Catholic University of Leuven, Herestraat 49, Leuven, 3000, Belgium
Abstract
DTI and BOLD functional MRI techniques suffer from many different types of artifacts. These artifacts can have a technical origin like susceptibility artifacts in specific brain regions or vibration and eddy-current artifacts, but they can also be related to physiology. The draining vein activation observed in the neighborhood of functionally active regions or flow artifacts are such physiologically induced artifacts. In clinical fMRI, there are also several specific effects. These can be pathology-induced reduction or absence of brain activation in the vicinity of lesions, which can lead to false interpretation of the resulting fMRI maps. As patients are most of the time ill, the pharmaceuticals they are taking can influence the BOLD signal, and the same applies to a lack of cooperation during the scan and head motion which is also detrimental for DTI acquisition. The success rate in clinical fMRI/DTI protocols is clearly related to the clinician’s/technician’s ability to recognize and cope with these technical, physiological, and patient-induced artifacts.
1 Introduction
FMRI and DTI techniques suffer from many different types of artifacts (Zeffiro 1996; Le Bihan et al. 2006; Haller and Bartsch 2009; Jones and Cercignani 2010; Murphy et al. 2013; Davis and Poldrack 2013). Some of these artifacts are of purely technical origin (e.g., spikes in EPI images), others may be related to physiology (e.g., cardiac-related physiological brain motion), and, finally, there are also pathology-induced artifacts, which can lead to a false interpretation of the results. Clinical fMRI, which is nowadays mostly performed at a field strength of 3 T, is a rather insensitive technique since signal intensity changes induced by neuronal activity are typically in the order of a few percent, i.e., in the range of the magnitude of noise (Boxerman et al. 1995; Aguirre et al. 1998). Many artifacts will therefore be related to the weak signal-to-noise ratio of fMRI. DTI acquisition techniques are also very sensitive to hardware-related instabilities and eddy currents and also suffer from a very low signal-to-noise ratio (Koch and Norris 2000; Le Bihan et al. 2006).
The low signal-to-noise ratio and various possible artifacts limit the success rate of clinical fMRI and DTI. Claustrophobia and patient cooperation, especially in more difficult tasks such as cognitive or language tasks, hamper the use of active fMRI in severely ill patients. Nonetheless, the reported success rate of presurgical fMRI in the literature is about 80–85 % (Lee et al. 1999; Krings 2001a; Håberg et al. 2004). This reported rate is probably overestimated since most patients undergoing fMRI have already undergone a selection by the referring clinician and not all patients with brain pathologies are referred for presurgical fMRI. When a failure occurs, head movement artifacts are the most frequent cause, followed by a low contrast-to-noise ratio. In the case of the DTI scans and also in resting state fMRI where patient cooperation is less stringent (no task has to be performed), the overall success rate may be higher, and also noncooperative patients, pediatric patients and neonates (Heemskerk et al. 2013), and even comatose patients may still be scanned (Vanhaudenhuyse et al. 2010).
The success rate of advanced clinical neuroimaging is clearly related to the clinician’s/technician’s ability to recognize and cope with the technical, physiological, and patient-induced artifacts and limitations. But there are some tips and tricks of how to detect and minimize these artifacts and to distinguish real from false brain activation in fMRI, as well as real pathologic white matter structure changes from artifacts.
1.1 Artifacts Related to BOLD fMRI Signal in Both Active and Resting State fMRI
As discussed in chapter “Revealing brain activity and white matter structure using functional and diffusion-weighted magnetic resonance imaging” by Goebel, neurovascular coupling between brain activation and cerebrovascular physiology leads to three effects that can contribute to the fMRI signal: an increase in the regional blood flow velocity (rCBF), regional blood volume (rCBV), and local blood oxygenation level. According to the latter, the most widely used fMRI technique has been called “blood oxygenation level-dependent (BOLD) fMRI” (Ogawa and Lee 1990; Rao et al. 1993; Turner et al. 1993; Yang et al. 1997).
All imaging modalities that extrapolate task-driven or resting state alterations from hemodynamic changes in neuronal activity produce functional maps that have passed through “a vascular filter.” This means that the regional sensitivity of the imaging modality for detecting functional changes following neuronal activation depends on the vascular baseline state and the vascular density in and around the activated neuronal cluster. Due to the contrast mechanism of the BOLD technique exploiting changes in deoxyhemoglobin concentration, this also applies to fMRI experiments (Menon and Kim 1999; Mandeville et al. 2001; Logothetis 2002; Goense et al. 2012). Thus, the observed area of signal change in BOLD images is larger than and can be displaced relative to the actual activated zone. These intrinsic effects of the BOLD mechanism limit the temporal and spatial resolution of fMRI, independently of the acquisition protocol used (Engel et al. 1997; Menon et al. 1998; Kriegeskorte et al. 2010).
1.1.1 Artifacts in Localization of Brain Activity (Brain or Vein)
The spatial specificity of activated patches obtained from fMRI and the accuracy of the activation location in relation to the sites of neuronal (electrical) activity have been shown to depend on the acquisition technique (Kim et al. 2000; Logothetis 2000; Duong et al. 2004; Siero et al. 2013). Several authors have raised the concern that BOLD fMRI exams performed at lower field strengths may predominantly detect large draining veins, not necessarily in the direct neighborhood of the activated brain region (Frahm et al. 1994).
In order to recognize BOLD signals arising from veins draining the excess of blood from activated areas (Kansaku et al. 1998; Menon 2002; Nencka and Rowe 2007), the principles described in the following can be used:
The activated spots observed from a draining vein are mostly small, contiguous on several adjacent slices, and of tubular configuration following the (often intrasulcal) path of the vein through different slices, whereas the activated functional area tends to appear more area-measured inside the brain parenchyma (Gati et al. 1997; Krings 2001a).
By co-registering (overlay) fMRI activation maps or rsfMRI network maps with anatomical T1-weighted contrast-enhanced images – which visualize the larger contrast-filled draining veins – it is possible to check for the position and possible overlap of BOLD clusters with the draining vessels. The additional co-registration of a venous MR angiogram is also helpful to distinguish intravenous BOLD signal from parenchymal brain activation (Baudendistel et al. 1998).
In addition, when analyzing the signal time course, differences between signal from activated parenchyma and that from draining veins can be observed. Because the draining veins are fed by venules and arterioles of the activated brain area, the signal change can be expected to have a later onset as compared to that of the parenchyma (Kansaku et al. 1998; Hall et al. 2002), reflected by a later onset of contrast change in the time course of the MR signal of the draining vein. However, this difference in temporal offset between the microvasculature in the activated parenchyma and the microvasculature of the draining veins is not very large, i.e., in the order of 1–2 s which is the time necessary for the blood to pass the smaller veins and reach the larger vessels (Lee et al. 1995). Consequently, this effect is almost never observed in a standard clinical fMRI acquisition protocol with a typical temporal resolution of around 3 s. On the other hand, the relative signal change observed in the draining vein is considerably larger as compared to that of the parenchyma (typically twice as large at a 1.5 T scanner) in a gradient echo pulse sequence. This is the result of several different effects. The magnetic susceptibility effects and the resulting percentage of signal change are increased around large draining veins. As the microvessels occupy a considerable smaller volume in a voxel as compared to the large draining veins, the partial volume effect will also increase the percent signal change in the voxels containing the draining veins as compared to those containing the parenchymal venules/arterioles. Inflow effects are also less pronounced in the randomly oriented microvasculature as compared to the large tubular draining veins (Krings 2001a).
In general, the activated areas observed in functional BOLD imaging studies can be divided in two different types of appearance based on the high-resolution T2*-weighted and T1-weighted images. The “venous” type is highly spatially confined, tends to be located along the sulcus, is of tubular configuration, and accounts for a higher percentage of BOLD contrast changes upon stimulation. High-resolution anatomical images demonstrate that areas with the most intense stimulation-related signal intensity changes correlate with dark spots or lines on T2*-weighted images and contrast-filled superficial tubuli in contrast-enhanced T1-weighted images arising from macroscopic venous blood vessels. The latter observation is also consistent with the fact that the relatively large blood vessels are located on the sulcal cortical surface rather than within the brain tissue itself (Yamada et al. 1997). Besides these “venous hot spots” of activation, however, the parenchymal stimulation-/activation-related BOLD contrast changes spread more diffusely and are not at all associated with any visible large venous vessel on anatomical images. This “parenchymal” type accounts for most of the spatial extension of the BOLD activation.
1.1.1.1 How to Minimize the Contribution of Draining Veins?
The contribution to fMRI signals from large draining veins is especially present when single slices, large flip angles, and short TR gradient echo sequences are used (Duyn et al. 1994; Haacke et al. 1994), since these enhance the contribution of the increase in blood flow and blood volume (inflow effect). Gao et al. (1996) have demonstrated that fMRI images more sensitive to the microcirculation in the brain parenchyma may be obtained when the pulse sequence is designed toward minimizing inflow effects and maximizing the BOLD contribution. This can be achieved with multislice, heavily T2 *-weighted single-shot echo-planar images with a long TR (Gao et al. 1996). Therefore, when performing clinical fMRI, the implementation of these imaging parameters should be a prerequisite for maximizing the fMRI signal toward the site of neuronal activity. In doing so, several studies have shown a good correlation between the BOLD fMRI signal and intraoperative mapping, suggesting that the functional-anatomical specificity is adequate for presurgical mapping, provided an optimal acquisition technique is used (Nitschke et al. 1998; Tomczak et al. 2000; Krings 2001b; Stippich et al. 2003; Meier et al. 2013).
The use of higher magnetic field strengths will also decrease the effect of the draining veins (Gati et al. 1997; Moon et al. 2007). The decrease in draining vein influence by increasing field strengths is a result of the field dependence on the alteration in T2 * values due to susceptibility-induced gradients around blood vessels which in turn depend on diffusional averaging. Thus, the change in T2* is a function of the motion of protons in the brain tissue as well as of the magnitude of the field gradients encountered by the tissue protons. The latter depends on the size of the blood vessels and orientation of these vessels relative to the main magnetic field direction (Ogawa et al. 1993). In this study by Ogawa et al. (1993), it was predicted that the overall effect in susceptibility difference on a T2 *-sensitive imaging technique would be somewhere between linear and quadratic depending on the main magnetic field. In addition, it was reported that at high magnetic fields, the contribution of small vessels is more pronounced than at low magnetic fields (Ogawa et al. 1993; Menon et al. 1995). Thus, with respect to signal intensity changes induced by susceptibility alterations of the blood vessels secondary to neuronal activity, this effect will increase more than linearly with the magnetic field strength, with a larger contribution of the more desired small vessel effect and therefore resulting in advantages toward higher fields (Ugurbil et al. 1999) for distinguishing parenchymal from venous activation. However, higher fields are also more sensitive to other artifacts such as susceptibility-induced image deformations in EPI sequences (see Sect. 4.1), a larger influence of scanner instability (Cohen and DuBois 1999), and physiological effects (Weisskoff 1996) which will be discussed below.
BOLD functional activation maps can also be obtained by using the spin echo (SE)-based T2-weighted contrast rather than the gradient echo (GRE)-based T2 *-weighted contrast (Duong et al. 2004; Moon et al. 2007). However the observed BOLD effect is much smaller on the T2-relaxation parameter (SE technique) resulting in a much lower contrast-to-noise ratio (CNR) making this technique less sensitive. On the other hand, the use of the T2 effect can be preferable if one wants to avoid spurious activation in large veins (Lowe et al. 2000; Uludağ et al. 2009) since SE sequences have a high specificity for microvessels and are therefore less sensitive to susceptibility effects around larger blood vessels in optimized settings (Oja et al. 1999; Uludağ et al. 2009).
Another technique to maximize parenchymal activation compared to venous activation has been demonstrated by Cohen et al. (2004) where hypercapnic normalization of the BOLD activation maps with the aid of CO2 inhalation has been used to normalize the BOLD-activated areas making them independent of the resting state CBV in the voxels (Cohen et al. 2004). Maximizing the fMRI signal toward the site of neuronal activity can also be achieved by optimizing the mode of stimulation. A study by Rumeur et al. (2000) has shown that different types of sensory stimulation are capable of differentiating primary sensory cortex from the venous draining network (Rumeur et al. 2000). Discontinuous stimulation of a limited skin area elicited activity in the microvasculature of the sensory cortex only, whereas robust continuous stimulation of a larger skin area led to activation not only in functional sites but also in the venous network. The authors claimed that the discontinuous stimulation paradigm induced less effective summation of the hemodynamic response and thus less migration of BOLD contrast to the venous network. As a result resting state fMRI will also be less sensitive to the venous draining network due to the lower mode of activation in the resting state. Also, if the activated region has a rather small surface area (<100 mm2), the oxygenation state in the vein draining the respective area will spread within this vein without dilution only up to 4–5 mm beyond the edge of the activated region (Turner 2002), minimizing the influence of the draining vein signal on presurgical BOLD maps.
Practical tip: In preoperative fMRI, the impact of spurious venous signals is important in order to know which distance to keep between the lesion to be removed and the adjacent functionally active area clear of when removing a lesion. Despite the fact that functionally “safe” resection borders cannot be determined from fMRI studies due to the statistical nature of the activation maps, there are several studies that recommend distances of 1 cm or higher between resection border and functional area as reasonably safe regarding the risk for surgically induced postoperative neurological deficits (see chapters “Task-based presurgical functional MRI in patients with brain tumors” and “Presurgical functional localization possibilities, limitations and validity” for details). This does not apply to the draining venous vessels as they do not represent “real” activated regions, so that here it is merely required to keep clear of the vessels. Practically, it is advised to always acquire anatomical high-resolution images of the patient, preferably contrast enhanced, to depict large blood vessels and to co-register the fMRI activation images with these anatomical images in order to distinguish “activation” in anatomically visible vessels from “activation” within the brain parenchyma. When small very intensely activated patches are observed, it is also recommended to compare these time courses with those of the more diffusely activated parenchymal regions to distinguish both types of activation (see chapter “Task-based presurgical functional MRI in patients with brain tumors”).
1.1.2 The Influence of Brain Lesions on BOLD fMRI Signal
An important aspect of the validity of functional MRI for clinical purposes is the significance of absent, reduced, or artificial BOLD activation. Here, it is important to know whether absent or reduced BOLD signal also reflects absent or reduced neuronal activation and whether BOLD signals in hyperperfused tissue (e.g., nearby or in the boundaries of highly vascularized tumors and metastases) or in areas with altered hemodynamic properties (e.g., in AVMs) represent truly functional neuronal activation. Until now the knowledge on these issues and also on their prevalence is very limited. The different phenomena have been described anecdotally, but investigators using fMRI preoperatively should be aware of their existence (Lüdemann et al. 2006; Chen et al. 2008; Jiang et al. 2010). As pointed out in an editorial by (Bryant and Jackson 1998), these “negative results” still deserve further study (Bryant and Jackson 1998).
1.1.2.1 Absent or Reduced BOLD Signal
Different pathological conditions can attenuate the hemodynamic response which is the source of any fMRI signal. Brain tumor vessels typically lack cerebral autoregulation. Their vasculature is less responsive than that of the surrounding normal tissue. Intracranial space-occupying lesions can alter physiologic conditions; they may induce proliferation of pathologic vessels in the tissue adjacent to the lesion, thus altering the density, size, and topography of the vessels and consequently increase blood volume. The blood-brain barrier may break down within the tumor mass and partially extend into the tissue adjacent to the tumor. The mass effect of the lesion itself and the peritumoral vasogenic edema may change the apparent diffusion coefficient and therefore also cause mechanical vascular compression. If, however, the brain’s ability to autoregulate the flow of blood is completely lost in the brain tissue in the immediate vicinity to the tumor, which may still be functioning, this area may not respond to an increase in neural activity with corresponding increase in blood flow and subsequent BOLD signal (Lüdemann et al. 2006; Chen et al. 2008). The biochemical environment (adenosine 59-triphosphate, pH, glucose, lactate, etc.) and the cortical levels of neurotransmitters in and around gliomas might be altered. Specifically, the release of nitric oxide by reactive astrocytes and macrophages at the normal brain tissue-glioma interface may increase the “resting state” regional cerebral blood flow and thus alter the physiological hemodynamic response (Schreiber et al. 2000; Hund-Georgiadis et al. 2003; Fujiwara et al. 2004; Maravita and Iriki 2004). Similarly, therapeutic drugs administered to the patients may also interact with hemodynamic autoregulation (Seifritz et al. 2000; Braus and Brassen 2005). In regions more distant from the gliomas, where tumor vasculature is not encountered, the release of nitric oxide by reactive astrocytes and macrophages at the normal brain tissue-glioma interface may result in a luxury perfusion and reduced oxygen extraction fraction, resulting and leading to a reduced BOLD contrast enhancement (Schreiber et al. 2000).
1.1.2.2 Case of a Patient Showing an Inverted BOLD Signal Change
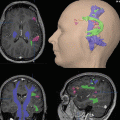
It is of utmost importance to realize that the absence of fMRI activity in a particular brain region does not mean that electrical activity within this area does not exist and it is thus safe to surgically remove this brain tissue. We will demonstrate this important point using the following case report: Fig. 1 illustrates fMRI activity during bilateral finger-tapping versus rest in a patient with a left Rolandic tumor (glioma WHO grade II in the postcentral gyrus extending through the central sulcus into the “hand knob” of the precentral gyrus). In the non-lesioned right hemisphere, fMRI activity is observed within the right sensorimotor cortex (SM1; pre- and postcentral gyri), the right premotor cortex (PM), and the right parietal cortex (PP). In contrast, in the lesioned left hemisphere, fMRI activation is only observed anteriorly to the tumor in the left premotor cortex (PM). While this fMRI activation map might be interpreted as an absence of electrical neuronal activity within the left SM1 and PP areas (e.g., due to plastic changes and a takeover of motor function by the ipsilateral non-lesioned hemisphere), the signal time courses clearly show that this is a false conclusion. In the left-sided, tumor-infiltrated SM1 hand representation, the BOLD signals decrease during performance of the motor task and increase during baseline condition (rest), i.e., an inverse BOLD MR signal change as compared to physiological activation. This finding may result from lesion-induced neurovascular uncoupling, where oxygen extraction (cause of the initial dip of the BOLD signal) occurs without an increase in regional cerebral blood flow and volume (rCBF and rCBV), resulting in a steady decrease of fMRI signal despite an increased electrical neuronal activity driving the actual movements. As pointed out in an editorial by Bryan and Kraut (1998), these “negative results” deserve further study (Bryan and Kraut 1998; Sunaert et al. 1998). One may speculate that – depending on the lesion-induced hemodynamic changes in different patients – there could be continuous alterations of BOLD signals from “normal” via “absent” to “inverse.” Possible BOLD alterations should be taken into account when functional lateralization is determined using fMRI as they may lead to an incorrect interpretation of clinical fMRI data.
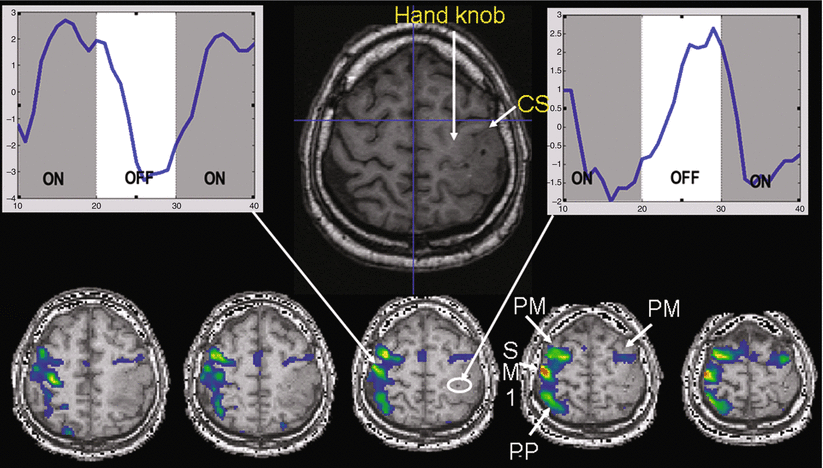

Fig. 1
Case study of a patient showing an inverted BOLD signal in the neighborhood of a lesion
1.1.2.3 BOLD Signal in Contrast-Enhancing Parts of Brain Malignancies
In some patients with low- or high-grade gliomas, BOLD signal changes can be observed in those gliomas, which in principle should not contain functional tissue. This issue has been investigated in several studies (Skirboll et al. 1996; Schiffbauer et al. 2001; Ganslandt et al. 2004). From these studies using magnetic source imaging methods (which is a combination of EEG and anatomical MRI), it can be concluded that real functional activity might be located within or at the margins of the tumor in a considerable percentage of patients (e.g., 25 % in the study of Schiffbauer et al. (2001), so that only partial resection is possible. The interpretation of this activity at the tumor margin remains ambiguous, either the cortex has been “displaced” by the growing tumor or is near the mark of being invaded by infiltrative tumor. Therefore, activated areas in tumor tissue are not always related to artifacts but could also be “real” functionally active tissue infiltrated by a tumor. If in doubt of the real or artificial nature of the activations, it is advised to combine different techniques (like MEG) to pinpoint the real nature of the BOLD signal change. More information about the combination of these different techniques can be found in chapter “Multimodality in functional neuroimaging”).
1.1.2.4 BOLD Signal in Patients with Brain AVMs
Arteriovenous malformations (AVMs) can produce widespread vascular steal effects beyond their nidus that preclude a normal hemodynamic response (for details see chapter “Presurgical functional localization possibilities, limitations and validity”). However, cerebral blood flow reductions do not necessarily cause cerebral dysfunction, as suggested in previous reports. Alterations of the microvascular architecture are prone to exist in the neighborhood of vascular malformations, and neovascularization is characteristic for malignant brain tumors and brain metastases of different pathologies, resulting in a change in the observed BOLD signal in the near neighborhood of the AVM. Also several studies have been published in different patient populations with AVMs reporting a shift of the functionally active regions in the neighborhood of the AVMs (Caramia et al. 2009). Vascular malformations are believed to form during gestation, and the development of these lesions and the associated brain damage due to hemorrhage or ischemia can lead to reorganization not only of the local anatomy but also of the functional cortex (Lehéricy et al. 2002). This can result in a cortical reorganization where the real functionally active region has been shifted into other previously defined functional regions (Maldjian et al. 1996; Fandino et al. 1999). More about brain plasticity has been explained in chapter “Brain plasticity in fMRI & DTI”.
1.1.3 The Effect of Different Pharmaceuticals on BOLD fMRI Signal
Chemicals and pharmaceuticals can have an effect on different aspects of brain physiology and/or hemodynamic coupling (Seifritz et al. 2000; Braus and Brassen 2005). The next paragraph introduces some known effects of substances on BOLD signal.
1.1.3.1 Caffeine
The effect of caffeine – a vasoconstrictor – on BOLD signals has been studied by several researchers (Parrish et al. 2001; Laurienti et al. 2002; Chen and Parrish 2009; Rack-Gomer et al. 2009) with different results. In an experiment determining the hemodynamic response function, volunteers were presented a short visual flash to activate primary visual areas and triggering a finger to thumb opposition. They were scanned in two consecutive sessions: before and after drinking three cups of coffee (~250 mg caffeine). The observed hemodynamic response function before and after administration of caffeine demonstrated a large increase (up to 50 %) in BOLD signal after caffeine intake as compared to the control session (Fig. 2a). The explanation for this effect may rely on the different properties of caffeine, i.e., its property to modulate neural activity and neurovascular tone. The influence on neurovascular tone decreases the resting state CBF (Rack-Gomer et al. 2009). As a result the increase in rCBF and respective BOLD signal change during stimulation is higher after intake of caffeine. Caffeine also has an excitatory action on neurons through the blockade of A1 adenosine receptors increasing neural activity following stimulation (Parrish et al. 2001; Laurienti et al. 2002). On the other hand, caffeine can have an influence on the observed resting state connectivity in the brain, which can be a real effect on brain activity or a result of the influence of caffeine on the baseline and reactive cerebral blood flow; therefore, one should be very careful while interpreting resting state fMRI data of patients (Rack-Gomer et al. 2009).
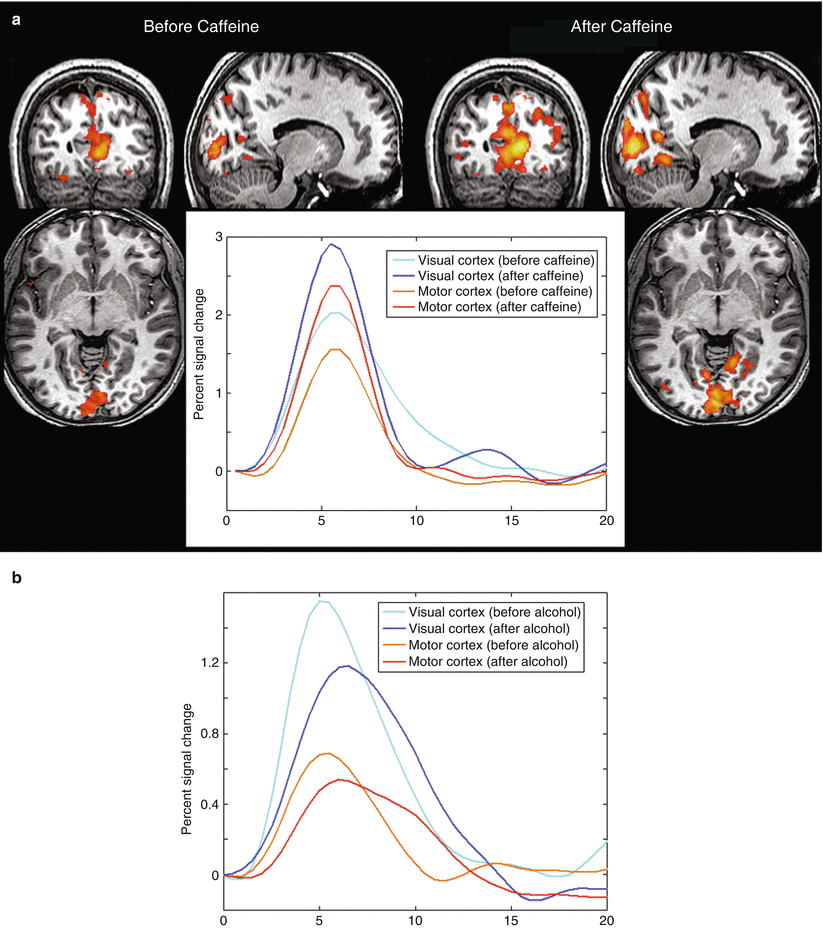

Fig. 2
(a) Activation maps and mean percent signal change of the hemodynamic response function, following a visual flash and a consequent finger-tap, before and after drinking three cups of coffee, in the visual and motor cortex, showing an increase in hemodynamic response function (HRF) after caffeine intake. (b) Mean signal change in the visual and motor cortex before and after drinking three glasses of beer as a result of the visual flash stimulation with a single finger-tap, demonstrating a decrease in BOLD signal change following alcohol intake
1.1.3.2 Alcohol
The effect of alcohol on BOLD signals is shown in Fig. 2b. A similar experiment as the one described above has been performed in volunteers before and after the consumption of three glasses of beer (~34 ml of alcohol). The graph demonstrates that alcohol has an adverse effect as compared to caffeine on the hemodynamic response. The effect of alcohol is twofold: First, alcohol is a vasodilator which increases the baseline CBF resulting in a smaller increase in rCBF and hence relative BOLD signal after stimulation (Levin et al. 1998; Seifritz et al. 2000). Second, alcohol also decreases the attention to the task the subjects have to perform and consequently neuronal activation of the stimulated brain areas (Luchtmann et al. 2010).
1.1.3.3 Other Chemicals
It is also important to note that various pharmacological agents may potentially alter the BOLD signal. Cocaine, e.g., influences neuronal connectivity (Li et al. 2000; Tomasi et al. 2010), neuronal activation, and cerebral blood flow in the resting state (Breiter et al. 1997; Lee et al. 2003; Lowen et al. 2009). However, the BOLD signal has been reported to remain unaffected after cocaine administration (Gollub et al. 1998). Theophylline has been shown to increase the BOLD signal in the rat primary motor cortex (Morton et al. 2002), a finding which has also been observed in patients with hyposmia where theophylline has been shown to increase odor-induced BOLD responses (Levy et al. 1998). The decrease in cerebral blood flow in the resting condition, due to a vasoconstrictor response, might possibly account for the increased BOLD response after theophylline administration. Furthermore, theophylline has also known neuroexcitatory effects, e.g., as an antagonist of the inhibitory neurotransmitter adenosine. This neuroexcitatory effect of theophylline could increase the number of neurons that are activated in response to a given stimulus, hereby increasing the observed BOLD response (Morton et al. 2002).
On the other hand, nicotine – a drug without effects on local brain hemodynamics as demonstrated in a simple visual task (Jacobsen et al. 2002) – has been demonstrated to increase attention to cognitive tasks both in patients with schizophrenia and in smokers (Kumari et al. 2003; Jacobsen et al. 2004) but also changing the resting state connectivity and possible subsequent stimulus-driven responses (Hahn et al. 2007). It is important to keep in mind that many other pharmacological agents, which have not yet been tested in this respect, may influence the BOLD response and that patients with brain tumors may receive such pharmaceutical products (D’Esposito et al. 2003).
1.1.3.4 CO2
Several studies report on the effect of CO2 on the resting state BOLD signal and on the BOLD response during activation while inhaling this mixture of gas. CO2 is a potent vasodilator increasing the BOLD signal. Breathing a mixture of air with 5 % CO2 increases the measured BOLD signal by 10 % (Kastrup et al. 1998). This effect can have consequences on patient studies as well. A change in the breathing rate during task performance, as a result of excitement and stress at the beginning of the experiment, can occur in some patients. This change in breathing rate alters the oxygen supply to the brain and the CO2 content in the blood affecting vasodilatation and thus the global BOLD signal in the brain. This can interfere with the task-related BOLD response. When a volunteer is asked to change his breathing rate from normal breathing to hyperventilation and vice versa, the time course of the BOLD signals clearly displays the large effect of hyperventilation on the resting state fMRI signal (Fig. 3). Therefore, in order to minimize effects of anxiousness and the change in breathing rate in clinical fMRI studies, it is very important to instruct and comfort the patients comprehensively and allow them to accommodate themselves to the scanner environment before initiation of the experiment. RsfMRI exams which are not driven by external stimuli (chapter “Presurgical resting state fMRI”) are even more susceptible to changes in breathing rate and cardiac cycle. Thus, careful instruction of the patients, and possibly also the monitoring of functions of the autonomic nervous system (ANS), could improve rsfMRI results (Murphy et al. 2011; Iacovella and Hasson 2011).
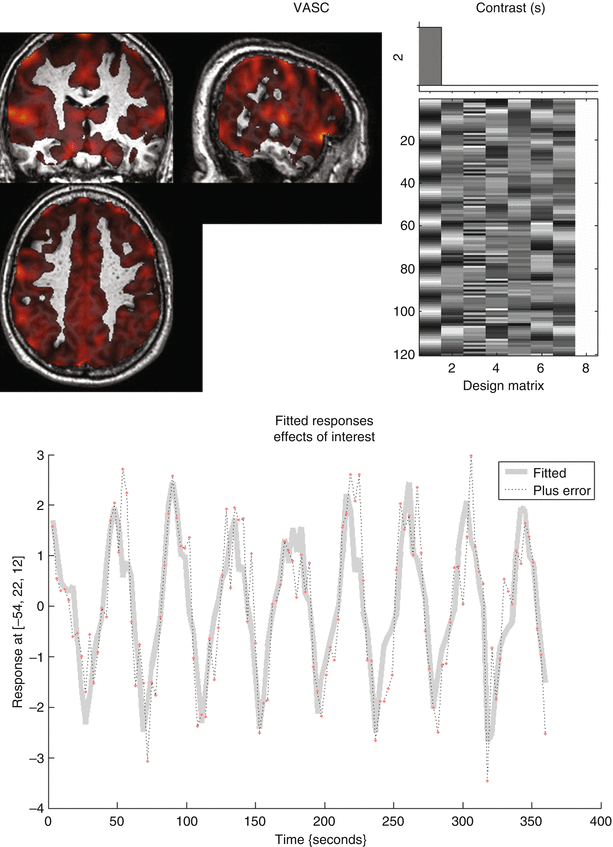

Fig. 3
Effect of hyperventilation on the BOLD resting state signal. During the scanning session the volunteer switched from hyperventilation periods to breath-hold periods of 24 s. The activation map shows MR signal change following the breath-hold/hyperventilation paradigm in the entire cortex of the volunteer. The MR signal time trace in the bottom of the figure clearly demonstrates the signal fluctuation for a random voxel in the cortex
1.2 The Influence of Brain Lesions on DTI Results
The lesion of the patient can also influence DTI images as well as the resulting FA maps and finally the fiber tracts. Degenerative diseases and demyelination disorders will reduce the measured FA values focally as observed, e.g., in amyotrophic lateral sclerosis (Sage et al. 2009), multiple sclerosis (Reich et al. 2008), and Alzheimer’s disease (Kantarci et al. 2010). More confined brain lesions can also influence the measured FA and diffusivity. Vasogenic edema reduces the local fiber density hereby lowering the measured FA, which in turn will influence the number of reconstructed fibers in the fiber-tracking algorithm around the respective lesion (Bizzi et al. 2012). Tumoral tissue can also destroy white matter fibers by reducing the number of intact axons (Sinha et al. 2002). On the other hand, in an abscess cavity the FA values are higher, which possibly reflects organized and oriented inflammatory cells (Toh et al. 2011).
The distorted anatomy resulting from the mass effect of a lesion hampers the positioning of the tracking ROIs at the correct position needed for a reliable and reproducible fiber tracking. One solution for this problem might be the use of fMRI activation regions as seed ROIs for fiber tractography, herewith using functional information for a better understanding of the structural status and its alterations (Kleiser et al. 2010).
1.3 Patient-Related Artifacts and Physiological Noise
1.3.1 Flow and Pulsation Artifacts
Flow artifacts result from the pulsating in- and outflow of the blood perpendicular to the imaging slices, hereby producing signal changes in different slices. At 1.5 T, these artifacts are especially observed in pathological flow conditions such as in AVMs. However, with the trend toward using higher magnetic field strengths (3 T and above), flow and pulsation artifacts become more prominent (Biswal et al. 1996; Srivastava et al. 2005). These artifacts manifest themselves as a slowly varying signal change with a sinusoidal rhythm, which is the result of an undersampling of the real underlying blood pulsation. In Fig. 4a. a pulsation artifact is demonstrated in an fMRI experiment acquired at 3 T without any specific brain activation, demonstrating several tubular-shaped regions with a signal intensity of sinusoidal shape. If the stimulation paradigm shows a period similar to the period of this sine wave (in this case a period of 100 s), these areas will highlight as false positives (Dagli et al. 1999). RsfMRI data are also very sensitive to such artifacts as these sinusoidal signal time traces do temporally very closely resemble real synchronized brain activation in different areas constituting the respective functional network.
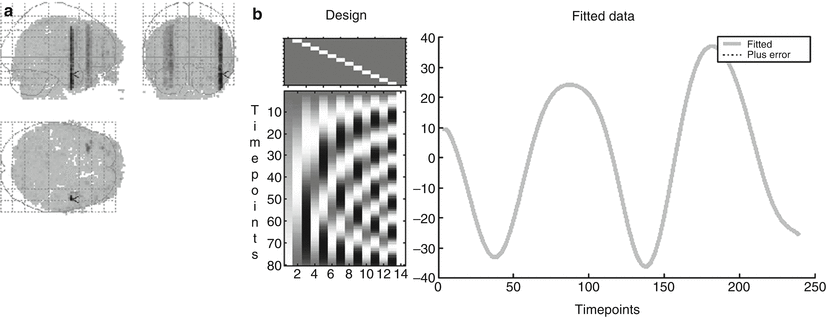

Fig. 4
Example of a pulsation artifact: 80 dynamic resting state BOLD scans were acquired with a TR of 3 s during 4 min in a volunteer. (a) Pulsation artifacts are observed behaving as tubuli-like BOLD fMRI activation regions. (b) The time course of the signal in this structure demonstrating a sinusoidal shape with a period of 100 s
1.3.2 Artifacts from Bulk Head Motion
The small intensity changes typically observed in fMRI images (ranging from a fraction of 1 % signal change to a few percentages) can easily be contaminated by a variety of sources. In clinical fMRI, the major contribution to signal artifacts arises from bulk head motion during acquisition of the functional data series (Seto et al. 2001). A further minor contribution originates from physiological brain motion (pulsation of the brain, overlying vessels, and cerebrospinal fluid) driven by cardiac pulsations (Dagli et al. 1999; Windischberger et al. 2002). Nevertheless, the primary reason for failed clinical fMRI examinations is head motion. In the study of Krings et al. (2001a), the most frequent cause for the failure of 15 % of their clinical exams was due to head movement artifacts (Krings 2001a).
The motion and its effect occurring during an fMRI time series acquisition can be divided into two separate categories: intra-image motion which is generally a very fast and sudden motion (i.e., at a time scale smaller than the image acquisition time) and inter-image motion on a time scale between a couple of seconds to minutes reflected in a slow movement of the subject (i.e., at a time scale larger than the time necessary to acquire a single image volume). These two subcategories of motion have different effects on the acquired images and functional map properties. The intra-image motion, typically induced by sudden head movement, results in “blurring” and “ghosting” in older GE-based acquisition sequences and is less present in single-shot echo-planar imaging, where all data for an image are collected in less than 100 ms (Duerk and Simonetti 1991). But if present, this sudden motion can have the following effects on EPI images: If the motion is very fast (<100 ms), it can still cause ghosting artifacts in several slices of the acquired volume. Slower, longer-lasting motion can also change image contrast; this especially applies to motion perpendicular to the acquisition plane. The latter will result in a change of the apparent repetition time for the acquisition of the same slice in the different volume (Fig. 5) which changes the T1 weighting of the tissue for the different slices and thus the signal intensity of the tissue. In other words, the tissue has experienced a different “spin history” (Friston et al. 1996b; Muresan et al. 2005).
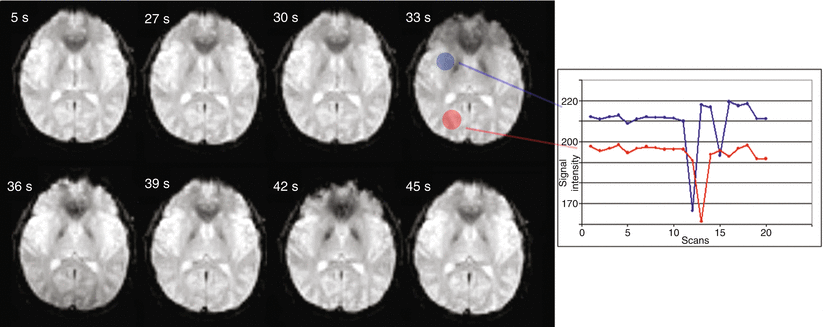

Fig. 5
Different time points in an fMRI series (TR=3 s) of a volunteer. During the scan he moved his head through the plane of acquisition. The time trace shown on the right displays the signal intensity change of the voxels in the filled regions; a large motion-induced signal drop is apparent resulting from this through-plane motion at around 30 s
In resting state fMRI, motion-related confounds can be even more troublesome. Due to a differential effect on resting BOLD signal of motion artifacts, connectivity measures can be largely influenced. Even subtle motion artifacts <0.5 mm can provoke a specific bias increasing short-range connections while decreasing long-range connections which can result in group differences between certain patient groups which will generally suffer from more motion than healthy controls (Power et al. 2013).
Motion on a time scale larger than the image acquisition time causes a misregistration of the images within the time series and makes activation foci undetectable or, even worse, induces artificial activation when the motion is temporally correlated to the stimulus (Hajnal et al. 1994) (Fig. 6). This will especially have an effect in those brain regions that show steep image intensity gradients (e.g., at the edges of the brain or in patients at the border of a T2-weighted hyperintense lesion), which are particularly prone to these artifacts. The effect of this inter-image motion has been shown to be particularly problematic in clinical examinations. Results from Hill et al. (2000) indicate that head motion occurs with a greater magnitude in patients with epilepsy than in healthy volunteers.
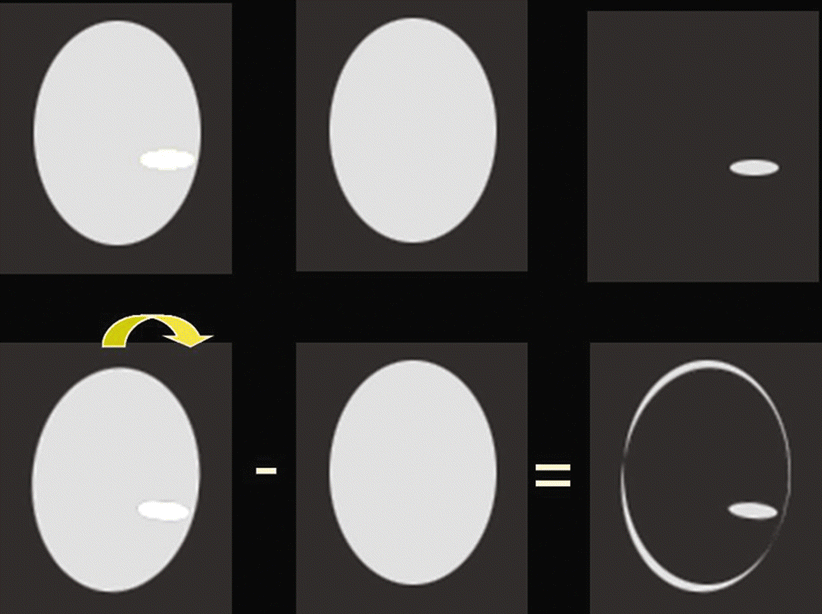

Fig. 6
Simulation of the effect of head motion between different states of activation on the observed activation in a subtraction map. In the top row without motion only the real activated region is discerned; in the bottom row on the other hand motion between both images is introduced, and a rim of false activation appears in the subtraction map
1.3.2.1 Minimizing and Correcting for Motion
Several solutions exist to correct for or to minimize inter-image motion which have been proposed by several researchers. Head movement during the acquisition phase can be restricted by fixation of the head with molds and straps (Fitzsimmons et al. 1997; Edward et al. 2000; Debus et al. 2008), which represents an intermediate level of head fixation. The use of a “bite-bar” (Fig. 7) – a custom-molded dental fixation, regularly used in our institution to restrain head motion while imaging volunteers – provides a highly rigid fixation, but can only be used in a limited number of patients (Dymarkowski et al. 1998). The presence of dental prosthesis interferes, and not all patients tolerate this kind of fixation. Furthermore, safety precautions preclude its use in these patients who are at risk of having epileptic seizures during imaging (Jiang et al. 1995; Freire and Mangin 2001).
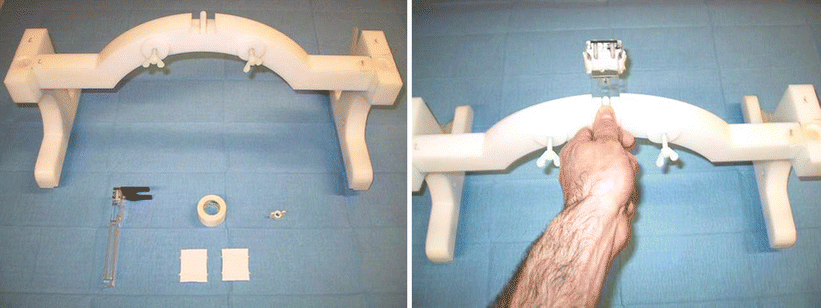

Fig. 7
Pictures of a custom-built bite-bar system used to minimize patient motion during the fMRI experiment, consisting of a plastic bridge which is positioned over the subject’s shoulder and a small detachable piece which the subject puts in his mouth
Another solution is the use of motion correction algorithms during data post-processing, which are nowadays integrated in most different fMRI analysis software. Motion correction is typically achieved by the rigid realignment of the consecutively acquired images in the data series with the first image (or an arbitrary other image) (Friston et al. 1995, 1996b). If the patient moves with a frequency unrelated to the frequency of the applied stimulation paradigm, this realignment post-processing can successfully separate this motion caused by the patient himself from true activation (Fig. 8). As most motion correction algorithms are intensity based, it is also possible that false motion is observed in the time series which may actually be the result of a large activation at a specific brain region shifting the center of intensity to a certain direction following the activation paradigm (Biswal and Hyde 1997).
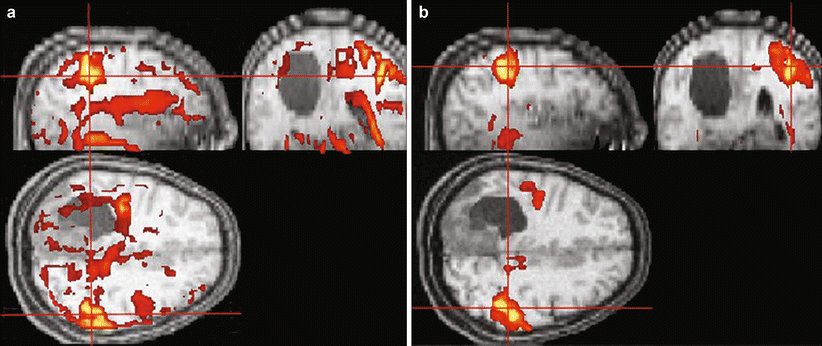

Fig. 8
Effect of subject motion on the resulting fMRI activation map of a patient (a) and the effect of the correction of this motion (b) on the observed real and false motion-induced activation in the calculated fMRI map
However, most of the patient motion is attributed to the applied stimulus (Hill et al. 2000), which is certainly the case if the patient is performing different motor paradigms (e.g., the patient is moving his head at the start of the task for looking at his fingers performing the task). This effect cannot be easily separated from the real functional activation due to their temporal synchrony (Hajnal et al. 1994).
The problem of patient motion could be further reduced in a number of different ways. First, stimulation paradigms can be optimized to minimize head motion, an issue that is currently under investigation. Much attention is given to differences in anatomic-functional information that can be obtained from active versus passive tasks which will inherently reduce motion (Gasser et al. 2004). Also, resting state fMRI does not suffer from task-based patient motion as there is no active task performed.
Stay updated, free articles. Join our Telegram channel

Full access? Get Clinical Tree


