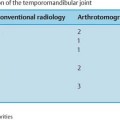
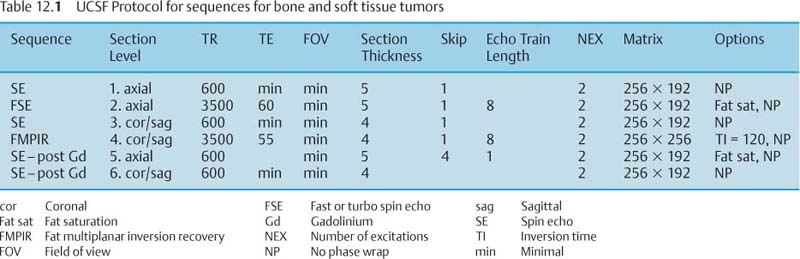
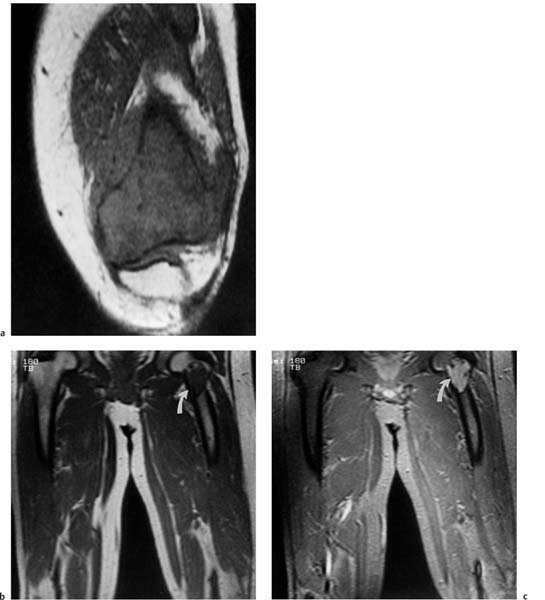
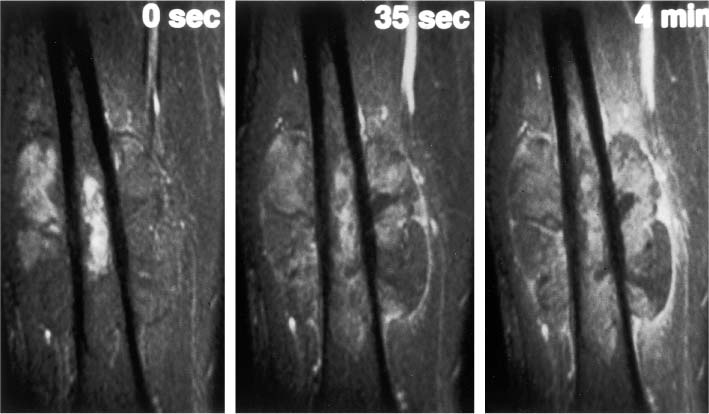
12 Bone and Soft-Tissue Tumors Before the introduction of cross-sectional imaging, primary bone tumors were diagnosed and categorized by conventional radiography and tomography. Even today, after CT and MRI have become part of the standard armamentarium in the clinical work-up, conventional radiography remains the method of choice for the initial diagnostic evaluation of bone tumors. In many cases, the radiographic findings allow a histopathologic diagnosis. It is often difficult to visualize tumors of the scapula, ribs, vertebra and pelvis by conventional radiography (91). Today, MRI has become one of the diagnostic foundations in the diagnosis of malignant tumors of the skeleton. MRI is superior to CT because: • MRI has a superior soft tissue contrast, • MRI allows direct multiplanar imaging, • MRI allows a better characterization of tissue owing to the different signal pattern of different tissues for individual sequences. MRI is more accurate than other imaging methods for staging bone and especially soft-tissue tumors (11, 34, 108). Furthermore, MRI can reveal tumor infiltration of the neurovascular bundle better than CT (11, 108). This chapter will present the current MRI methods available for delineating bone and soft-tissue tumors. Staging, tissue-specific imaging findings, changes secondary to chemotherapy and radiotherapy, and detection of tumor recurrences as well as characteristic findings of specific tumors will be discussed. The first sequence should be acquired with a body coil to allow adequate assessment of the proximal and distal extent of the lesion and to assure visualization of the tumor in its entirety. The examination with the body coil will also include any possible proximal or distal skip lesions (Fig. 12.1 and Tab. 12.1). Depending on the size of the lesion, the examination is continued with a surface coil, a torso phased-array coil, or circumferential coil. To achieve a high spatial resolution, the field of view should be small, though large enough to encompass the entire tumor including any tumorous infiltration of the vessels, nerves, and muscles. To search for vertebral metastases, a phased-array spinal coil should be applied to examine the entire spine. A torso phased-array coil or a body coil should be selected for the metastatic evaluation of the pelvis or both upper and lower extremities. Many of the criteria used in conventional radiology and CT for determining the malignant potential of a bone tumor are also applicable to MRI. Benign tumors generally are sharply delineated from adjacent bone marrow and surrounding soft tissues (73, 108), whereas most malignant tumors have an indistinct margin and the tendency for local infiltration (73). A sharp, smooth, well-defined low-signal border indicates that the tumor is most likely benign (108). But this finding is in no way specific since such a well-defined interface can also be encountered in malignant lesions (108). Measurement of the T1 and T2 relaxation times of benign and malignant lesions shows overlap and is unreliable in distinguishing between the two types of tumor (73, 108). Fig. 12.1a–c Osteogenic sarcoma with osseous metastases (skip lesion).a T1-weighted image. Low-signal primary lesion in the distal femur.b T1-weighted image. Low-signal metastasis (arrow) in the proximal femur.c T1-weighted image. High-signal metastasis (arrow) in the proximal femur. Erlemann and co-workers (26) stated that dynamic MRI with rapid sequential image acquisition after intervenous bolus injection of Gd-DTPA might improve the distinction between benign and malignant tumors (Fig. 12.2). In their study of 69 patients with bone or soft-tissue tumors, the slope of the enhancement-time curve after injection of Gd-DTPA was greater than 30% in 84.1% of the malignant tumors and less than 30% in 72% of the benign tumors (26). While these results indicate that dynamic Gd-DTPA-enhanced imaging provides valuable information as to the malignant potential of a tumor, a biopsy is still needed because of the considerable overlap between the values for benign and malignant tumors (26). Verstraete and co-workers (103) also investigated the slope of the time-intensity curve of dynamic contrast-enhanced imaging and calculated the maximal enhancement rate within the first minute after injection using a linear curve-fitting algorithm. The steepest slope of the time-enhancement curve was calculated for all pixels and displayed on a gray scale in a new computer-composed first pass image with the same matrix. The value of each pixel corresponds spatially to the first pass slope value, with high intensities indicating a steep enhancement slope and low intensities a shallow enhancement slope after injection of Gd-DTPA. This computer-composed parametric image correlated well with the tissue vascularization and perfusion, but a considerable overlap existed between values for malignant and vascular benign tumors, such as eosinophilic granuloma, giant cell tumor and osteoid osteoma. These parametric images, however, provide useful information by depicting viable tissue, which can be helpful in monitoring the tumor during chemotherapy and delineating any necrosis or surrounding inflammatory changes. Some of the tissues found histologically in tumors of the musculoskeletal tissue can be identified on the basis of their signal pattern. For instance, fat within in a tumor, as found in lipoma (Fig. 12.3), liposarcoma or even vertebral hemangioma, is characterized by a high signal intensity on T1-weighted and an intermediate to high signal intensity on T2-weighted images (Tab. 12.2). Chronic fibrotic scar tissue produces a low signal intensity in all sequences (Tab. 12.2) (75). Likewise, sclerotic bone, as found frequently in osteosarcoma, exhibits a low signal intensity in all sequences. Cystic, fluid-filled areas of the tumor generally show a low signal intensity on the T1-weighted images and a high signal intensity on the T2-weighted images, without any appreciable enhancement after administration of paramagnetic contrast medium (15). A cyst, however, can have a high signal intensity on T1-weighted images if it contains proteinaceous material or methemoglobin after recent hemorrhage. Tumors characterized by a preferentially short T1 relaxation time, i.e., high signal intensity on T1- weighted images, are listed in Tab. 12.3 (Figs. 12.3 and 12.4). These characterizing signal findings often narrow the differential diagnosis. In addition, the presence of fluid levels can add valuable information (Tab. 12.4). The choice between limb-saving procedure and amputation is determined by the aggressiveness and local spread of the tumor (5, 33, 71, 86). The staging system described by Enneking has proved helpful in the assessment of primary bone or soft-tissue tumors as to their prognosis, treatment, and recurrence rate (23). The staging system for tumors is based on: • histologic grade of malignancy G (G0 = benign, G1 = low-grade malignant, G2 = high-grade malignant) Fig. 12.2 Osteosarcoma. Representative case of dynamic MRI with images generated at intervals of 3.5 seconds. The images obtained before (0 sec) and at 35 seconds and 4 minutes after bolus injection of contrast medium are shown. Aggressive tumor with rapid enhancement, which is characteristic of most malignant lesions.
General Section
 Coils, Sequence Protocols
 Comparison between Benign and Malignant Tumors
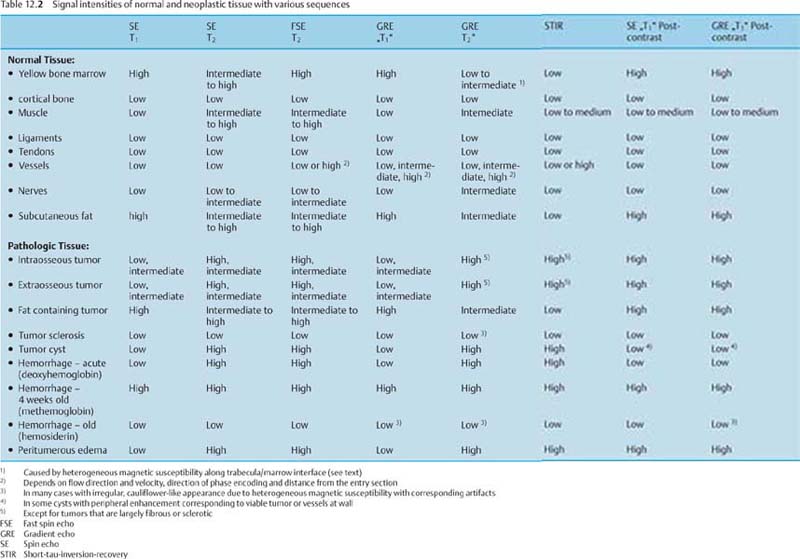
 Characteristic Signal Intensity Pattern
 Staging
Fat-containing tumors |
• Lipoma |
• Liposarcoma |
• Hemangioma |
Tumors with methemoglobin |
• Telangiectatic osteosarcoma |
• Hemorrhagic metastases |
• Malignant tumors after chemotherapy or radiotherapy |
• Pseudotumor in Hemophilia |
• Lymphangioma |
• Arteriovenous malformation |
• Melanotic metastases of malignant melanoma |
• Aneurysmatic bone cyst |
• Chondroblastoma |
• Osteoblastoma |
• Giant cell tumor |
• Osteogenic sarcoma |
• Metastases |
• Malignant tumors after chemotherapy or radiotherapy |
• Abscess |
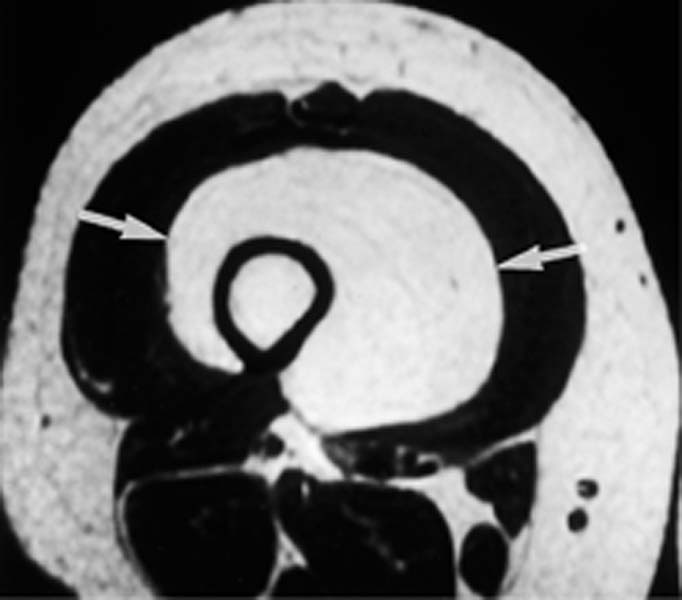
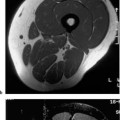
Fig. 12.3 Lipoma. The lesion in the thigh (arrows) exhibits a signal of high, fat-equivalent intensity on the T1-weighted image.
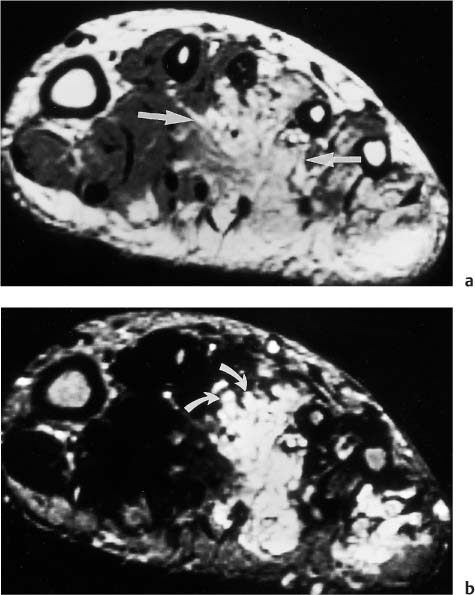
Fig. 12.4a, b Hematoma.a T1-weighted image. High-signal lesion in the forefoot (arrows), probably reflecting blood products and fat.b T2-weighted image. The high signal intensity of the lesion persists. Dilated vascular structures are visible (curved arrows).
Stage according to Enneking | Resection | Amputation |
Benign |
|
|
• 1 (inactive) | Intracapsular | Subtotal |
• 2 (active) | Extracapsular (en-bloc resection inside the reactive zone) | Marginal |
• 3 (aggressive) | Wide (including safety margin through normal tissue outside the reactive zone) | Wide |
Malignant |
|
|
• I (low-grade malignant) | Wide | Wide |
• II (high-grade malignant) | Radical (complete removal of the involved compartments, thus often including the joint) | Radical |
• local extent T (T0 = intracapsular, T1 = extracapsular but still within the compartment, T2 = extracapsular with compartmental escape),
• presence of metastases M (M0 = no metastases, M1 = detectable metastases).
The G, T, and M score is then used to determine the stage (Fig. 12.5).
Enneking’s staging system does not apply to the staging of leukemias, myelomas, Ewing sarcoma or metastases. This method of staging bone and soft-tissue neoplasms has to be separated from the assessment of growth rate of bone tumors on the basis of the radiographic destruction pattern as proposed by Lodwick. MRI contributes to the accuracy of the staging through its ability to delineate the tumor in relationship to compartmental borders and neurovascular bundles.
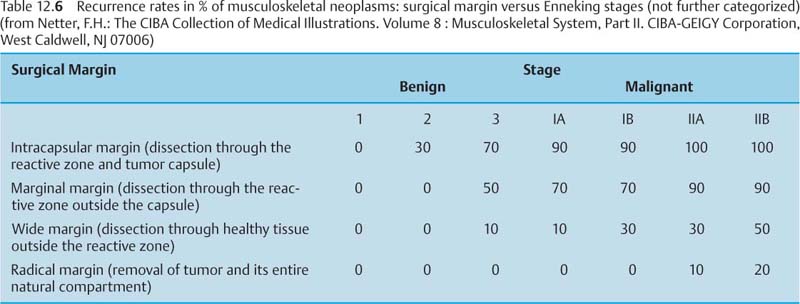
Initial surgical procedures include limb-saving re-section and amputations with four basic surgical margins (Tab. 12.5). The surgical planning takes into account the tumor stage and the recurrence rate of the tumor in relation to the surgical margin (Tab. 12.6).
Intramedullary Involvement
MRI is clearly superior to CT in determining the intramedullary extent of the tumor (1, 11, 12, 13, 34, 41, 57, 58, 70, 73, 91–95, 108). Gillespy and co-workers (34) compared the ability of CT and MRI to assess the intramedullary extension of bone tumors and correlated the sectional images with macroslides of the surgical specimens. The average difference between CT and macroslides was 16.5 mm ± 10.7 mm, and the average difference between MRI and macroslides 4.9 mm ± 4.3 mm. Much of the difference between MRI and macroslides was attributed to comparing MRI planes with different macroslides. When identical planes of section were compared in a subgroup of five patients, the average difference was 1.8 mm ± 1.6 mm (34).
Bloem and co-workers (11) prospectively evaluated the relative value of CT, MRI and bone scintigraphy in local tumor staging in comparison to the findings at dissection of the resected specimen. MRI had a nearly perfect correlation with the histopathologic specimen (r = 0.99), while CT had a lower correlation (r = 0.86). The prediction of intraosseous tumor length with bone scintigraphy was poor (r = 0.56). MRI seems to be clearly superior to CT. Since most surgeons resect the tumor with a wide margin of 5–6 cm, both MRI and CT may be adequate for surgical planning (75, 81).
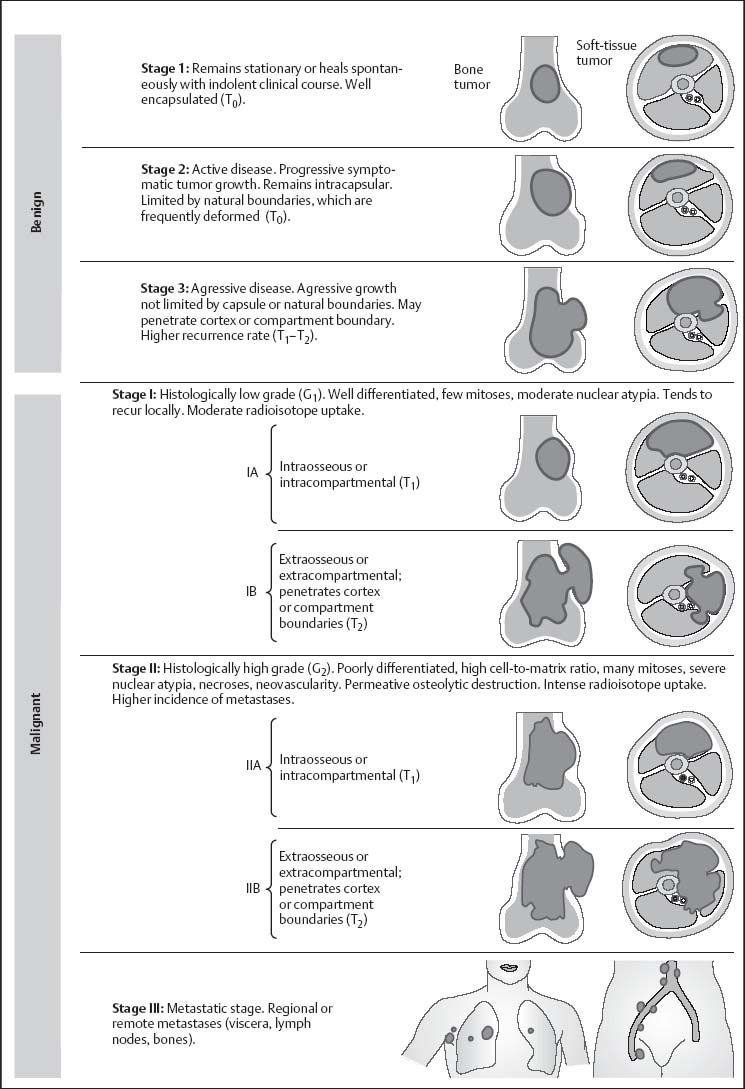
Fig. 12.5 Staging of the musculoskeletal neoplasms after Enneking (after Netter).Stages 1–3: Histologically benign (G0) with variable clinical and biologic behavior
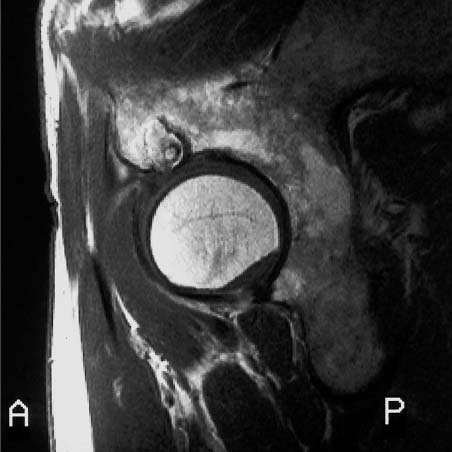
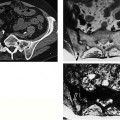
Fig. 12.6 Oblique sagittal contrast-enhanced SE image of a tumor in the acetabulum with intra-articular extension. The cartilage of the acetabular roof is infiltrated, but the joint space and the cartilage covering the femoral head are still spared. This high resolution image could prove the intra-articular extension. The tumor shows heterogeneous enhancement. Reconverted bone marrow throughout the acetabulum is a normal finding in a 65-year-old patient. (See Chapter 11.)
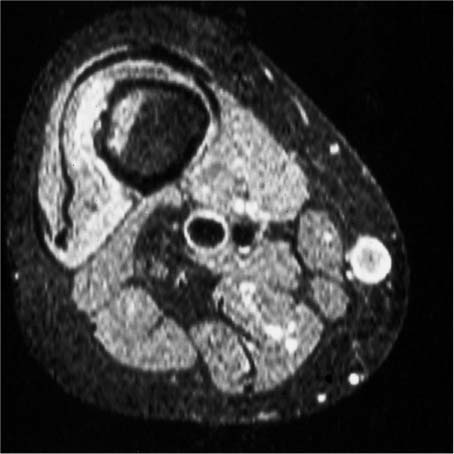
Fig. 12.7 Metastasis in the femoral shaft. Axial fat-suppressed STIR image. Low-signal residual bone marrow, high-signal intraosseous tumor component, destroyed cortex, high-signal extraosseous tumor component. Despite relatively low spatial resolution, good delineation of the cortical destruction.
Epiphyseal Involvement
Epiphyseal involvement is better predicted with MRI than with conventional radiography (69). Norton and co-workers observed epiphyseal extension on the pathologic specimen in 12 of 15 consecutive patients with long bone osteosarcoma and nonfused epiphyses. Plain radiography detected the epiphyseal involvement in only nine cases while MRI was accurate in identifying epiphyseal involvement in all 12 patients.
Intra-articular Involvement
It is not certain whether MRI is superior to CT in detecting joint involvement. Bloem and co-workers (11) showed that CT and MRI are equally accurate and specific, with a specificity above 90%. Aisen and coworkers (1) and Zimmer and co-workers (108) found MRI to be occasionally more accurate but comparable in the majority of cases (Fig. 12.6).
Unfortunately the presence of a joint effusion in the joint adjacent to the tumor is not a reliable sign of joint involvement. However, the absence of the joint effusion is a good indicator of no intra-articular invasion of the tumor.
Cortical Destruction, Periosteal Reaction
Several studies have reported the superiority of conventional radiography and CT over MRI for the evaluation of cortical destruction, tumor calcifications and ossifications and for the detection of periosteal or endosteal reaction (7, 75, 89, 90, 91, 108). The high radiodensity of the periosteal osseous reaction and osteoblastic areas is associated with a low concentration of resonating protons and resultant low signal intensity on MRI, accounting for the difficulty in visualizing these changes on MRI. However, the majority of studies reporting this aspect are several years old and were performed with low field strengths and obsolete coil technology.
Zimmer and co-workers (108) demonstrated that cortical destruction as well as periosteal and endosteal new bone formation can be identified by MRI (Fig. 12.7). GRE sequences can increase the sensitivity of MRI for the detection of subtle sclerotic changes (Fig. 12.8) since, in contrast to the SE image formation, the image is acquired without a rephasing pulse. Consequently, the heterogeneous magnetic susceptibility of focal sclerotic areas produces a signal loss. This signal loss can be used to improve the delineation of focal sclerosis or periosteal reaction.
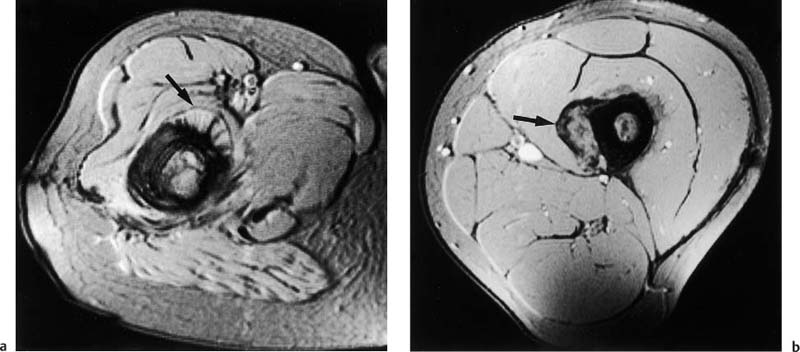
Fig. 12.8a, b Periosteal reaction of malignant bone tumor on GRE image. Axial section.a Osteosarcoma of the femur with spiculated bone formation producing a sunburst appearance (arrow).b Ewing sarcoma of the femur. Laminated periosteal reaction overlying the extraosseous tumor component (arrow). A short echo time (TE = 9 msec) can sharply delineate the calcium-containing periosteal reaction, despite the increased susceptibility of the measuring sequence.
Soft-tissue Extension
Both CT and MRI can delineate the soft tissue mass of a primary soft tissue or bone tumor. Since normal soft tissues and the soft tissue components of either tumor often have the same radiodensity, CT largely has to rely on indirect signs to determine soft extension, such as obliterated intermuscular fatty septa and displaced neighboring structures. The limited separation of intrinsically different soft tissue structures can be improved by adding intravenous injection of contrast medium to the CT examination (59, 82, 96), exploiting the differences in tissue enhancement. Even with contrast enhancement, however, CT does not achieve the discriminating tissue contrast of MRI and remains inferior to MRI in delineating the extent of soft tissue lesions (73).
In summary, MRI is clearly superior to unenhanced and enhanced CT for the determination of the soft-tissue extent of primary tumors of the bone and soft tissues. The major reason is the greater contrast between normal and abnormal tissue offered by MRI (1, 108).
Involvement of Neurovascular Bundles
MRI is also superior to CT in exhibiting the relationship between tumor and neurovascular bundle and in demonstrating any neurovascular involvement (Fig. 12.9)(1, 11, 73, 75, 108). Bloem and co-workers (11) reported a sensitivity, specificity, and accuracy of 33%, 93%, and 82% for CT and 100%, 98%, and 98%, respectively, for MRI.
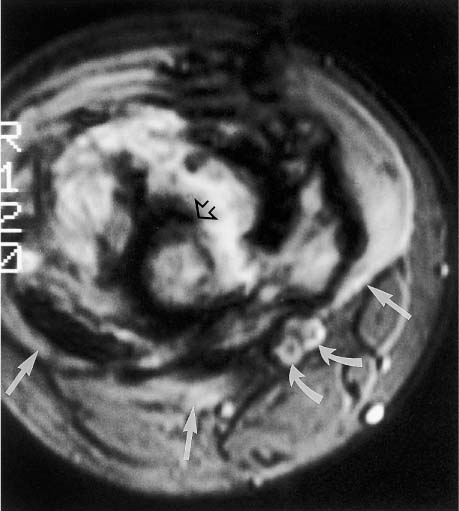
Fig. 12.9 Osteogenic sarcoma of the femur with extension toward vascular structures. T2 *-weighted GRE image shows tumor compression (straight arrows) on the popliteal artery and vein (curved arrow), but no encasement. The tumor has caused extensive cortical destruction (open arrow).
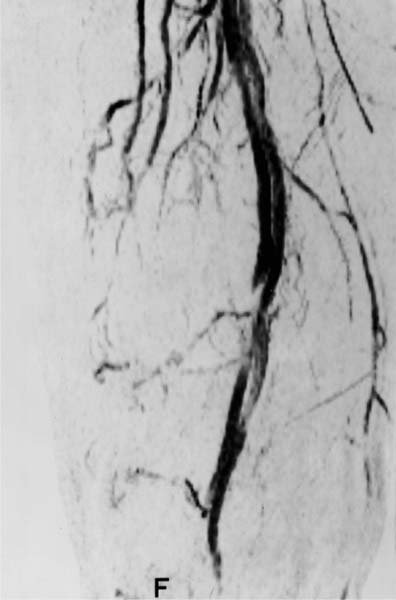
Fig. 12.10 MR angiography. The osteogenic sarcoma (not visible in this display) has displaced the popliteal artery and vein medially. The vessels are still patent and not encased by the tumor.
In some instances, the use of intravenous Gd-DTPA obscures the differentiation of tumor from adjacent fat (82). On unenhanced T1-weighted images, the tumor is characteristically of low signal intensity and clearly separated from the surrounding high signal fat. After enhancement, the tumor increases in signal intensity and may be less well differentiated from fatty tissue (26, 82).
MR angiography is especially well suited to delineate tumor displacement (Fig. 12.10) or encroachment and encasement (Fig. 12.11) of the vessels (52).
Differentiation between Peritumoral Edema and Extraosseous Tumor
Both viable tumor and peritumoral edema exhibit a high signal intensity on post-contrast T1-weighted images. Pettersson and co-workers (76) obtained conventional T1-weighted images after administration of Gd-DT PA on five patients with soft-tissue tumors and found strong enhancement in the tumor and in the peritumoral edema. Using a similar technique, Hanna and co-workers (38) observed a strong enhancement in viable tumor, granulation tissue and peritumoral edema.
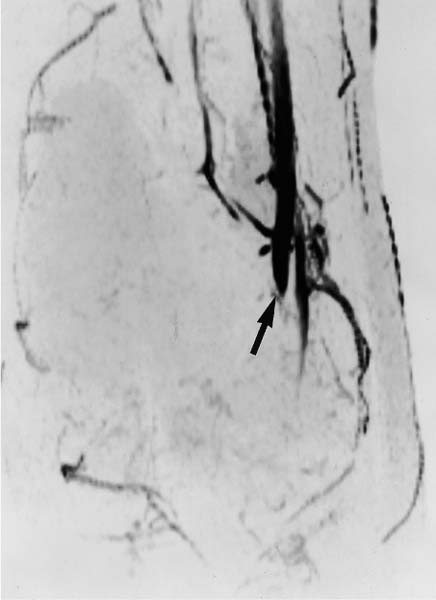
Fig. 12.11 MR angiography. A patient with an osteogenic sarcoma that has encased and compressed adjacent vessels, leading to lack of visualization of the vessels distal to the tumor (arrow).
Dynamic post-contrast MRI following intravenous bolus injection has emerged as a promising method for the differentiation of extraosseous tumor from perineoplastic edema. Lang and co-workers (53) obtained sequential images with an acquisition time of 3.5 seconds per image after bolus administration of contrast medium (Fig. 12.12). Using an exponential-fitting algorithm, the slope values of the contrast enhancement-time curves were calculated pixel-by-pixel and displayed as gray values in a computer-generated slope image (Fig. 12.13). The high temporal resolution and exponential fitting for calculating the initial slopes provided good differentiation between viable tumor and extraosseous edema. The initial slope values of viable extraosseous tumor and muscle infiltrated by tumor were 20% and more than those for perineoplastic edema (53). Since the computer-generated slope images define the margins of the lesion accurately, they appear especially useful for preoperative planning of limb-sparing surgery. This technique might also play a role in monitoring the effect of chemotherapy.
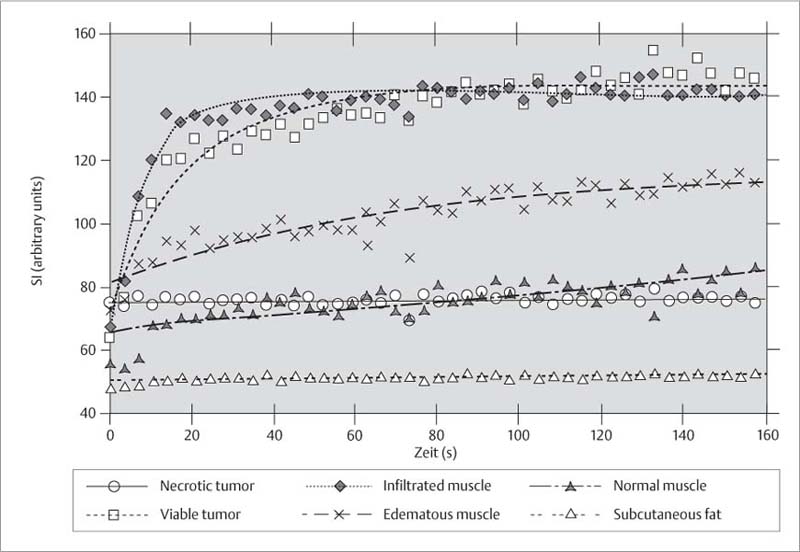
Fig. 12.12 Contrast enhancement-time curve. Dynamic MRI can differentiate viable tumor and muscle infiltrated by tumor from edematous muscles and peritumoral edema. The slope value of the contrast enhancement-time curve is markedly greater for neoplastic tissue than for normal tissue (after 53).
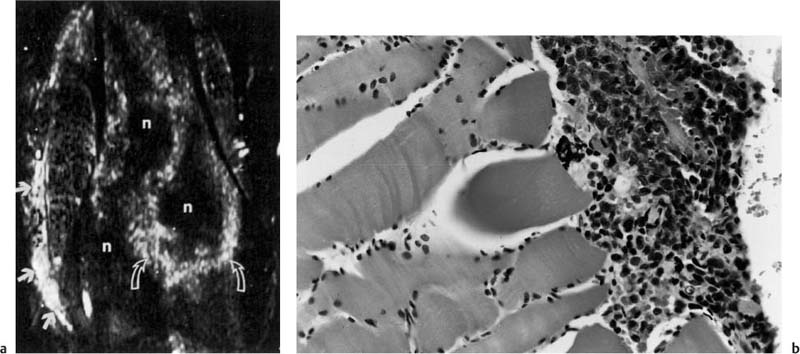
Fig. 12.13 a, b Computer-generated spatial mapping of the enhancement rate.a The gray scale is used to express the slope value of the enhancement rate, with bright areas indicating high initial slope values as found in aggressive tumor (curved arrows) or infiltrated muscles. Gray areas indicate a low initial slope value as found in perineoplastic edema (Fig. 12.12). The medial muscles show a bright area suspicious for tumor infiltration (arrows).b The photomicrograph confirms infiltrating tumor cells between the muscle fibers (after 53). n necrosis
Differentiation between Viable and Necrotic Tumor
MRI performed after intravenous administration of contrast medium can differentiate viable from necrotic tumor. Except for hypovascular tumors, viable tumors have a strong contrast enhancement. Necrotic areas within a tumor generally have no contrast enhancement and remain of low to intermediate signal intensity after administration of contrast medium (26, 51) (Fig. 12.14). It should be kept in mind, however, that the clinically available Gd-based complexes are low-molecular and, due to their small size, might diffuse into the areas of tumor necrosis by way of the extra-cellular space.
Traditionally, the clinical findings, such as a local soft-tissue swelling, determined the biopsy sites, with the inherent risk of obtaining a tissue sample from a necrotic area. Identifying the areas of viable tumor by dynamic contrast-enhanced MRI can help select the most suitable biopsy site (26, 51).
 Monitoring the Effect of Therapy
It is highly desirable to know the response of tumors to chemotherapy considering the high morbidity of chemotherapy and the need to abandon an ineffective therapeutic regimen in favor of alternative regimens. It is difficult to measure the therapeutic response solely by clinical means. Clinical parameters of tumor response, such as local soft tissue swelling or hyperthermia, correlate poorly with histologic responses (45, 105). Furthermore, conventional radiography, angiography, CT and scintigraphy, all of which have been used to measure the response to chemotherapy in the past, are poor predictors with a specificity of around 50% (15, 84).
MRI is more sensitive and can provide morphologic as well as quantitative information of the chemotherapy effect. The morphologic findings of a therapeutic effect are:
• Decrease in tumor volume,
• Improved delineation of the muscle and intermuscular fatty septa,
• Appearance of cystic areas in the tumor matrix (44, 71).
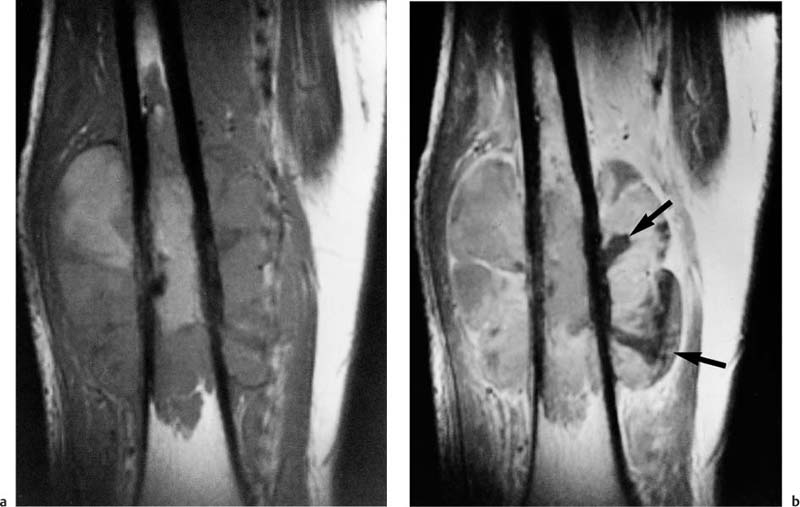
Fig. 12.14 a, b Osteogenic sarcoma with viable and necrotic components.a T1-weighted pre-contrast MRI. The tumor in the distal femur has a predominately homogeneous low-signal intensity.b T1-weighted post-contrast MRI. Large areas of the tumor show an intense enhancement corresponding to viable tissue. Necrotic areas fail to enhance and remain of low-signal intensity (arrows).
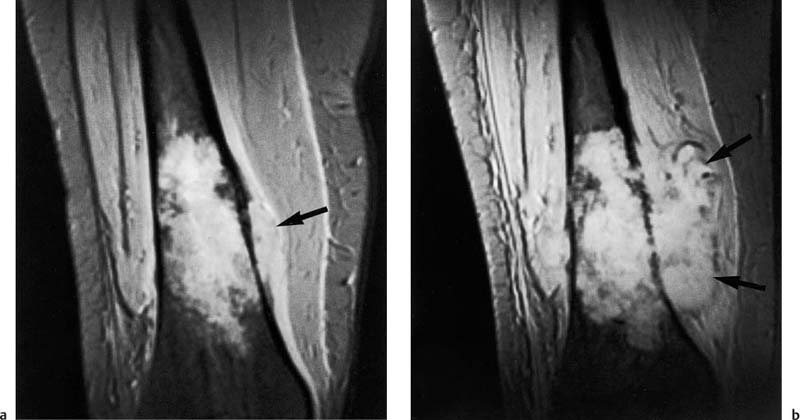
Fig. 12.15 a, b Osteogenic sarcoma before and after chemotherapy.a T2 *-weighted GRE image. The tumor has a high signal intensity. Only a small extraosseous component is seen on this image obtained before chemotherapy (arrow). b T2 *-weighted GRE image. The extraosseous component has increased in size on this image obtained after chemotherapy (arrows). The intramedullary tumor has also grown. These interval changes indicate a chemotherapy failure.
An increase in tumor volume indicates an unfavorable response to chemotherapy (Fig. 12.15), while progressive calcifications along the periphery as well as in the central areas of an osteosarcoma are a sign of good response (17, 64). The perineoplastic edema decreases with a favorable tumor response (44, 71). Osteogenic sarcomas are frequently surrounded by a dark rim, corresponding to a layer of dense collagenous fibers that are continuous with the periosteum on the histologic examination. With a favorable tumor response, this dark rim can become thicker due to a decrease in the perineoplastic edema (71).
Pan and co-workers (71) discerned four major post-chemotherapy patterns based on the MRI appearance of the tumor. A dark pattern was characterized by predominant areas of low and intermediate signal intensity on the T1-weighted and T2-weighted images. This reflected a good therapeutic response with small foci of residual tumor. A mottled or speckled pattern was characterized by a predominant area of intermediate intensity on the T1-weighted image and a high intensity with interspersed areas of low-signal intensity on the T2- weighted images. This pattern also corresponded to generally low levels of residual viable tumor. A homogeneous pattern was characterized by a predominant area of intermediate intensity on the T1-weighted and high intensity on the T2-weighted images and distinguished from the previous pattern by the absence of mottling. The homogeneous areas corresponded to macroscopic quantities of residual viable tumor. The cystic pattern was characterized by areas of intermediate intensity on T1-weighted and high intensity on the T2-weighted images, with a distinct multicystic or bubbly appearance. The finding also indicated a high proportion of residual viable tumor along the periphery of cysts (71).
Holscher and co-workers (44) demonstrated a significant correlation between poor pathologic response and increase in the high signal intensity of the extraosseous tumor component on serial T2-weighted images (r = 0.57, p = 0.02). A chemotherapy-induced high T2- weighted signal may also represent necrosis, cystic hemorrhagic areas or fibroblastic repair tissue (60).
A decrease in the signal intensity of the extraosseous component on T2-weighted images correlated with a satisfactory therapy response (44). MacVicar and co-workers (60) found microscopic clusters of viable tumor in areas of both low and high signal intensity after treatment and concluded that MRI is unreliable for excluding active disease but suitable for providing qualitative evidence of chemotherapeutic effect by assessing the change in signal intensity.
Erlemann and co-workers (27) were able to demonstrate that dynamic MRI with rapid GRE sequences obtained after the bolus injection of Gd-DTPA can be used for assessing the response to preoperative chemotherapy. A drop in the slope value of the enhancement-time curve by at least 60% relative to the baseline value indicated a response to the therapy. Nonresponders generally had a drop of less than 60% (27). Similar findings have been reported by Fletcher and co-workers and by Hanna and co-workers (28, 29, 39, 40, 77).
Van der Wounde and co-workers (100) reported that remnant viable tumor was often located at the margins of the tumor or subperiosteally. The viable tumor areas showed early enhancement and rapid wash-out on dynamic MR images (100).
MR angiography might supplement the assessment of chemotherapeutic response. Decreased neovascularity is observed in patients who respond to therapy and persistent or even increased neovascularity in nonresponding patients (52, 54).
 Recurrent Tumor and Postoperative Fibrosis or Edema
The differentiation between local recurrence and changes induced by surgery, chemotherapy, or radiotherapy can be difficult. Nodular lesions with low-signal intensity on T1-weighted and high-signal intensity on T2-weighted images are suspicious for recurrence (16, 35, 78, 101). Additional suspicious findings are a mass effect, infiltrative extension into the surrounding soft tissues and osseous destruction. In patients who underwent radiotherapy, lesions of high-signal intensity on the T2-weighted image can be seen in active tumor as well as in radiation-induced inflammatory changes (101). Other causes of an increased T2- weighted signal are listed in Tab. 12.7.
Areas of homogeneous, low signal intensity on T1- weighted images that show no appreciable increase in signal intensity on the T2-weighted images and lack any focal or nodular components generally reflect chronic sequelae following surgery, chemotherapy, or radiation therapy. Similar findings might be observed in rare cases of malignant fibrous histiocytomas with predominant fibroblastic component, precluding any reliable differentiation (78).
Reuther and colleague (78) compared CT and MRI for evidence of tumor recurrence. The sensitivity was 57.5% and the specificity 96.3% for CT, and 82.5% and 96.3%, respectively, for MRI, indicating that MRI is more sensitive for the detection of tumor recurrence (78). Postsurgical scars generally show an edema-equivalent signal up to 6 months after surgery, with a few cases exhibiting edema with corresponding high signal intensity on T2-weighted images for a much longer period after surgery. In these cases, a recurrence cannot be diagnosed unless this finding is associated with a space-occupying effect. These cases may benefit from evaluation by MTC since scar tissue, as opposed to malignant and most benign tumors (less than 25%), has a very high MTC effect (exceeding 50%) (see Chapter 1) (Fig. 12.16) (99).
• Tumor recurrence |
• Residual perineoplastic edema |
• Postsurgical changes: edema, hematoma, seroma, hemostatic packing material, granulation tissue (up to 6 months after surgery) |
• Postradiation inflammatory changes |
• Fat necrosis |
• Atrophic muscle (e. g., denervation due to surgical trauma) |
• Intercalary bone graft |
Specific Section
Depending on the tissue of origin, numerous benign and malignant bone and soft-tissue tumors are distinguished (Tab. 12.8, page 324). Imaging alone rarely affords a definitive differentiation or classification. Though conventional radiography remains of great value, primarily due to its well-established criteria based on experience gathered over many years, MRI can add to the preoperative prediction of the histologic diagnosis, in addition to its contribution to tumor staging. The current state of clinical usefulness of MRI in evaluating and characterizing different tumor entities will be presented in the remaining sections of this chapter.
Malignant Bone Tumors
 Osteosarcoma
Osteosarcomas comprise 20% of all primary malignant bone tumors, occurring most frequently between the ages of 10 to 15 years. The most common sites are the metaphyses of the long tubular bones, most frequently involving distal femur, proximal tibia, and humerus.
MRI is clinically most useful in the detection of intramedullary skip lesions, which occur in 25% of cases (Fig. 12.1), and for displaying the true extent of the bone marrow and soft tissue involvement (13, 94, 108). Dense sclerotic tumor components have a low signal intensity on T1-weighted and T2-weighted images. Cortical destruction and extensive perineoplastic edema are common (85) (Fig. 12.9).
The tumor is characteristically surrounded by a rim of low signal intensity on T1-weighted and T2-weighted images, corresponding to the periosteal reaction. Cystic and necrotic changes as well as fluid levels are frequently observed after chemotherapy (43).
Preoperative chemotherapy is administered to control micrometastases and to reduce the size and extent of the primary tumor as well as the peritumoral edema. Joint-saving surgery is generally attempted, but amputations are still often necessary. MRI is especially useful to follow patients undergoing chemotherapy. In case of an inadequate response, the chemotherapeutic regimen can be changed to offer the patient another chance of eliminating micrometastases and improving the prognosis. MRI is also well suited for detecting local tumor recurrence.
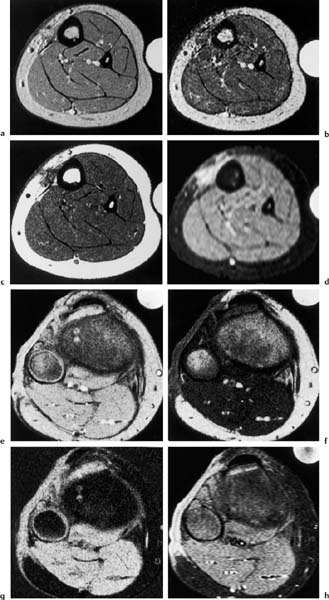
Fig. 12.16 a–h a–d Follow-up examinations after surgical removal of a malignant fibrous histiocytoma of the lower leg, axial plane.a GRE sequence.b MTC image.c T1-weighted SE sequence.d Fat suppressed STIR sequence. Scar formation of the skin with marked decrease in signal intensity induced by the MTC pulse. Low signal visualization on the T1- weighted image, high signal visualization on the fat-suppressed STIR image. This signal pattern of the scar on the T1-weighted and fat suppressed image is also observed in tumors. The strong MT effect, however, favors a scar.e-h Follow-up after surgical removal of a leiomyosarcoma of the lower leg, axial plane.e GRE sequence.f MTC sequence.g MTC subtraction image.h Fat-suppressed STIR sequence. The cutaneous scar formation shows a markedly decreased signal intensity on the MTC image. The decrease in signal intensity is almost as pronounced as that found in the musculature. The MTC subtraction image accentuates this effect and displays scar and musculature as bright structure. The fat-suppressed STIR image shows a high-signal visualization of the scar. This signal pattern is uncharacteristic and can also be observed in tumor tissue.
Tissue Type | Benign Tumors | Malignant Tumors |
Bone tumors |
|
|
• Osseous | Osteoid Osteoma (2) Osteoblastoma (2–3) Osteoma (1) | Classic osteosarcoma (IIB) Parosteal osteosarcoma (IA) Periosteal osteosarcoma (IIA) |
• Cartilaginous | Enchondroma (2) Exostosis (2) Periosteal chondroma (2) Chondroblastoma (2–3) Chondromyxoid fibroma (2–3) | Primary chondrosarcoma (IIB) Secondary chondrosarcoma (IA) |
• Fibrous | Nonossifying fibroma (1–2) Desmoplastic fibroma (2–3) Fibrous dysplasia (NA) Ossifying fibroma (2–3) | Fibrosarcoma of bone (IIB) Malignant fibrous histiocytoma (IIB) |
• Reticuloendothelial | Eosinophilic granuloma (NA) Hands-Schüller-Christian disease (NA) Abt-Letterer-Siwe disease (NA) | Ewing’s sarcoma (IIB) Reticulum-cell sarcoma (IIB) Myeloma (III) |
• Vascular | Aneurysmal bone cyst (2) Hemangioma of the bone (2) | Angiosarcoma (IIB) –Hemangioendothelioma (IA) –Hemangiopericytoma (IA) |
• Unknown | Solitary bone cyst (NA) Giant-cell tumor in bone (2–3) | Giant-cell sarcoma (IIB) Chordoma (IB) Adamantinoma (IA) |
Soft-tissue tumors |
|
|
• Osseous | Myositis ossificans (NA) | Extraosseous osteosarcoma (IIB) |
• Cartilaginous | Chondroma (2) Synovial chondromatosis | Extraosseous chondrosarcoma (IB) |
• Fibrous | Fibroma (1–2) Fibromatosis (3) | Fibrosarcoma (I–IIB) Related posts:Stay updated, free articles. Join our Telegram channel
Full access? Get Clinical Tree
 Get Clinical Tree app for offline access

|