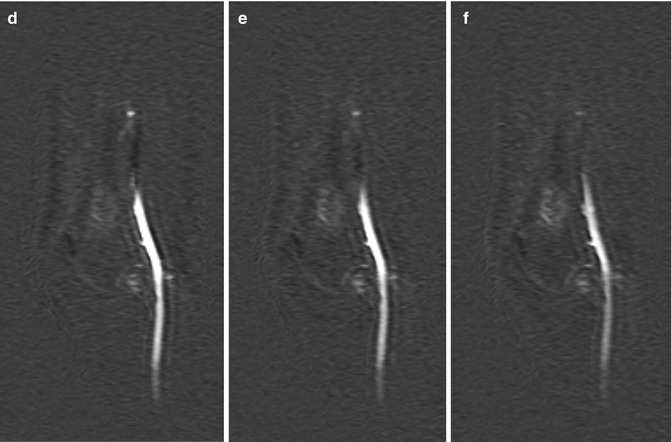
Fig. 56.1
Atypical cartilaginous tumor/chondrosarcoma grade 1. (a) Sagittal T1-weighted image. (b) Static gd-chelate-enhanced T1 fat-suppressed image shows the typical ring and arc enhancement of a cartilaginous tumor. Three subtraction images show arrival of contrast agent in the artery (c) and progressive enhancement on images taken after 3 (d), 6 (e), and 9 (f) seconds. Enhancement of the tumor is seen before 10 s, this is consistent with chondrosarcoma, which was proven at surgery
FDG-PET has the same uptake patterns in both enchondroma and chondrosarcoma grade I [6]. Areas of high-grade chondrosarcoma may be present in a dominantly low-grade chondrosarcoma. These high-grade areas can be identified by MRI due to rapid more homogeneous enhancement. These high-grade areas have a higher SUV (standardized uptake value) on FDG-PET.
Another application of functional imaging is diagnosis of giant cell tumor. Giant cell tumors have a small interstitium, and therefore, early washout of contrast agent, rather than a plateau phase or persistent increase of contrast enhancement, on time-intensity curves is seen. This is not very useful for new tumors as radiographs are specific enough, but this may be useful to identify recurrent GCT (Fig. 56.2).
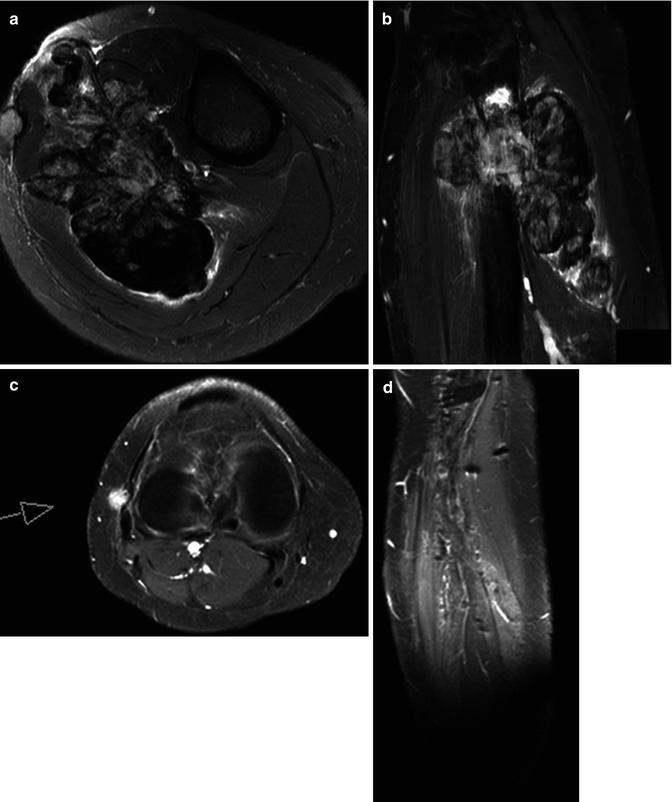
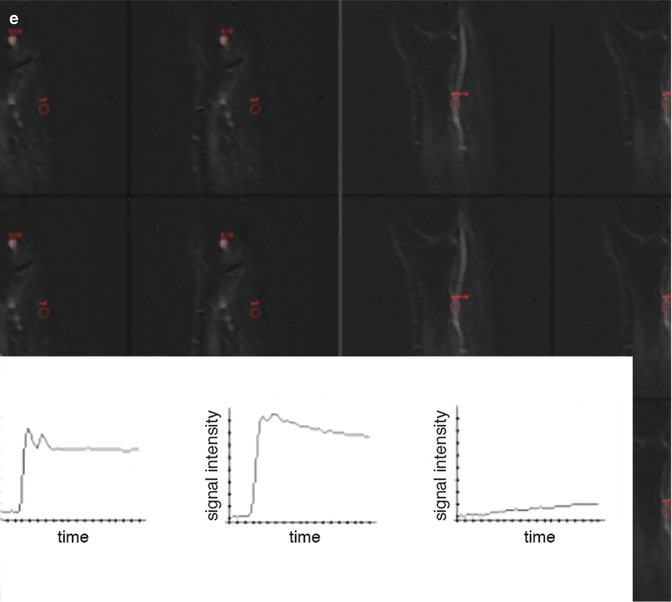


Fig. 56.2
Giant cell tumor with recurrence after resection. (a) Axial T2 fat-saturated image shows large tumor of mixed low and high signal intensities, originating from the fibula. (b) Inhomogeneous enhancement is seen on this Gd-chelate T1 fat-saturated image. Soft tissue recurrence is seen due to enhancement on these T1 fat-saturated Gd-chelate-enhanced images axial (c) and sagittal (d) images. Three time-intensity graphs on a panel of subtraction images (e) show the arterial curve on the left, a steep slope and washout on the curve taken from the tumor (middle), and a reference curve of muscle (right)
Distant metastases of bone sarcoma occur mainly in the lung; therefore, a chest CT is used in the workup to detect or exclude metastases. For Ewing sarcoma a bone marrow biopsy is taken to identify or exclude systemic disease. The definitive diagnosis of bone sarcoma including the specific type allows a treatment plan to be made and executed.
56.3 Monitoring Chemotherapy
Chemotherapy, radiation therapy, and especially surgery are the methods used to try to cure or palliate the patient. Results of surgery are evaluated by morphologic imaging, using MRI mainly. Effect of radiation therapy and especially chemotherapy administered before or after surgery is more challenging to measure. Functional imaging techniques are becoming more important as it is shown that morphologic criteria, basically tumor volume, are insufficient to monitor response to treatment [7, 8].
Monitoring the response to local or systemic chemotherapy comprises accurate identification and quantification of the proportion of therapy-induced necrosis and residual viable tumor. This may have an impact on prognosis, modification of neoadjuvant (presurgical) treatment protocols, timing and planning of surgery, planning of radiation therapy, and selection of postoperative radiation therapy and/or chemotherapy regimens. Secondly, imaging modalities strongly influence the therapeutic strategies by revealing absence or presence and location of recurrent local, regional, or distant tumor after initial treatment.
56.4 Pathophysiology
The histologic response to neoadjuvant chemotherapy is one of the most important prognostic factors for patients with bone sarcoma. Both histologic and radiologic techniques focus on determination of the fraction of the entire tumor that is still viable instead of the fraction that is necrotic. At histologic analysis of resected specimens, MRI can be used by the pathologist to target components of the tumor that are viable, thereby avoiding sample errors.
Although the principle of classifying response of musculoskeletal sarcoma to therapy, based on fraction of viable tumor, is the same for all sarcomas, some differences do exist. The basis for the classification system has initially been described for osteosarcoma [9]. Residual viable tumor in osteosarcoma preferentially persists within the soft tissues, cortical bone and endosteal surface, zones adjacent to cartilage, ligaments, and areas around zones of liquefaction.
The grading system is slightly modified for Ewing’s sarcoma [10]. Sites of predilection for persistence of minimal residual viable tumor in Ewing’s sarcoma comprise the subperiosteal area, the intramedullary compartment, the soft tissues, and the zones adjacent to hemorrhagic areas. The Rizzoli reports on a slightly different grading system in patients with Ewing sarcoma [11]. For the evaluation of chemotherapy-induced necrosis, they use a three-grade scale, ranging from at least one macroscopic nodule of viable tumor tissue (grade I), to only isolated microscopic foci of viable tumor tissue (grade II), to grade III in which no viable tumor tissue can be found. The probability of developing recurrent tumors is slightly greater than 50 % for high-risk patients (grades I and II) compared with 5 % for low-risk patients (grade III) [11].
Recurrence of tumor is typically diagnosed when residual tumor is detected by imaging techniques or when it becomes symptomatic. Recurrences of both osseous and soft tissue sarcoma typically occur in the soft tissues of the surgical bed. Recurrences of benign osseous tumors are frequently also found in bone because resection margins are smaller than in sarcoma surgery.
56.5 Imaging Response to Chemotherapy
56.5.1 Conventional Radiography
Although gross increase in volume, associated with progressive destruction of normal bone, usually is indicative of poor response, other changes such as changes in host reaction (periosteal reaction, calcification) or changes within the tumor itself (calcification, ossification, fracture, hemorrhage) do not correlate with histologic grading of response (Fig. 56.3). In Ewing’s sarcoma, a marked reduction of the soft tissue tumor component in association with solidification of periosteal new bone, reconstitution of the cortical shaft, and reappearance of intramedullary trabeculations is commonly observed. However, this also does not correlate with histologic grading [12, 13].
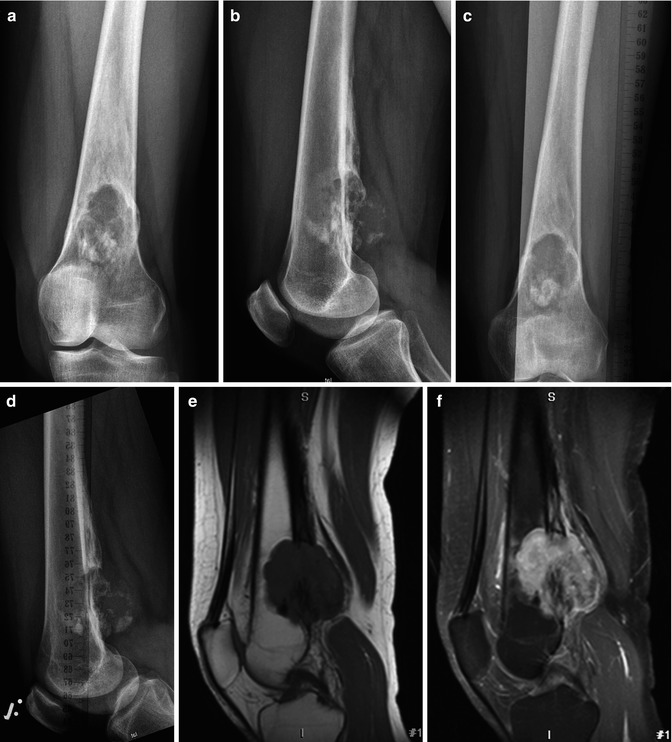
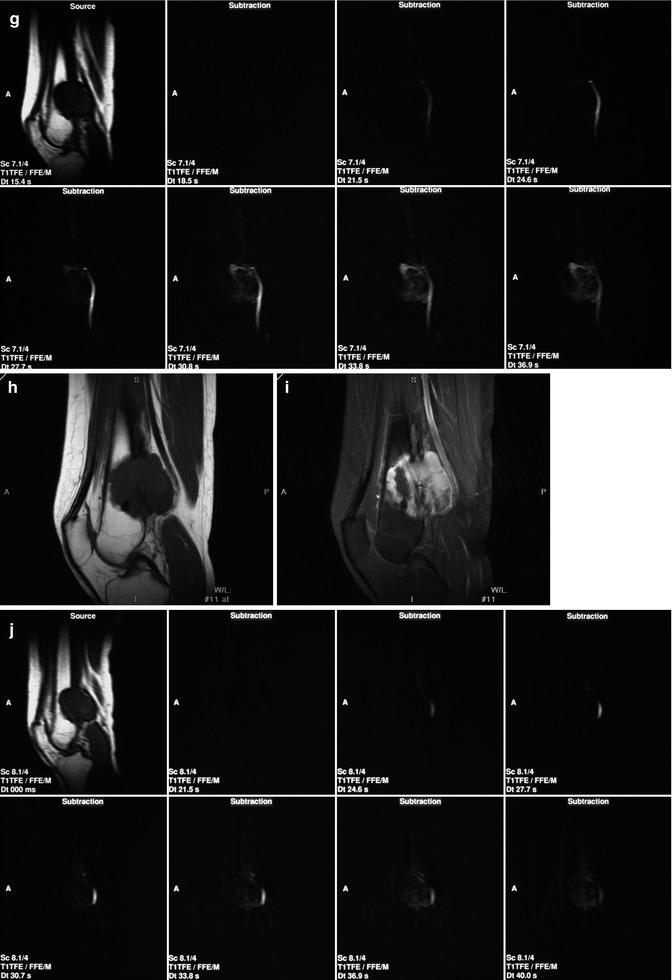
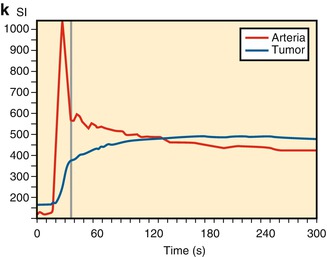


Fig. 56.3
A 45-year-old woman presented with an osteosarcoma in the left distal femur that did not respond well to chemotherapy. Conventional radiographs of the distal femur before treatment (a, b) and after three cycles of neoadjuvant chemotherapy (c, d). Sagittal T1-weighted MRI images before (e) and after (f) contrast medium injection obtained at initial presentation. (g) Consecutive sagittal dynamic contrast-enhanced subtraction MRI images demonstrate extensive areas with early tumor enhancement. Sagittal T1-weighted MRI images before (h) and after (i) contrast medium injection obtained after three cycles of neoadjuvant chemotherapy. (j) Consecutive sagittal dynamic contrast-enhanced subtraction MRI images demonstrate extensive areas with early tumor enhancement indicating viable tumor. (k) The time-intensity curve of a region within early enhancing tumor demonstrates rapidly progressive enhancement followed by a plateau phase. Histopathologic examination of the resected specimen demonstrated poor response (Reprinted with permission from reference [7])
56.5.2 Unenhanced Magnetic Resonance Imaging
Morphologic MRI criteria have been proven to be inaccurate in assessing response to chemotherapy. Only an increase in tumor volume not caused by massive hemorrhage within the tumor correlates with a poor histologic response. An unchanged or decreasing tumor volume is not predictive for a good response. In Ewing’s sarcoma the presence of a decreased but still present residual soft tissue mass after chemotherapy is correlated with poor histologic response. Only complete disappearance of tumor is indicative of good response and improved survival. The increase of signal intensity on T2-weighted images, basically reflecting liquefaction, may indicate a favorable histologic response. Increase of peritumoral (outside the low-signal-intensity pseudocapsule) edema has been correlated with poor histologic response. Decrease of peritumoral edema is a common finding that is not correlated with a favorable histologic response [14, 15].
The recently updated Response Evaluation Criteria in Solid Tumors (RECIST 1.1) only uses morphology, in particular changes in volume [16].
56.5.3 Contrast-Enhanced Magnetic Resonance Imaging
Static Gd-chelate-enhanced images taken minutes after intravenous administration reflect morphology. Enhancement is a function not only of perfusion but also of diffusion. Therefore, identification of viable tumor is inaccurate [17]. In dynamic Gd-chelate-enhanced imaging (DCE), we image the small molecular contrast agent as it passes from the intravascular space into the interstitium at a rate determined by the permeability of the capillaries (tumor vessels lack a muscular wall and contain large endothelial gaps), total vascular cross-sectional area, interstitial pressure, volume of extracellular space, contrast agent injection rate, and cardiac output. Although the impact of these factors can be manipulated by the type and especially the size of contrast agents used, the commonly used extracellular-interstitial Gd chelates reflect all these functions.
Serial images with high temporal resolution are taken before, during, and after an intravenous bolus injection of Gd chelates such as Gd-DTPA to evaluate the initial distribution of the contrast agent in the capillaries and interstitial space. Directly after MRI data acquisition is started, a bolus injection of Gd chelate with a concentration of 0.2 mL/kg at an injection rate of 4 mL/s is intravenously administered. An imaging frequency (temporal resolution) of at least one image per 3 s is initially needed to produce at least two data points in the first part of the enhancement curve, with its potentially rapid rise of concentration of the contrast agent in the tumor. In addition to obtaining information on the initial enhancement, information on distribution of the contrast agent is obtained by sampling for approximately 5 min with a temporal resolution that can be lower than the initial one.
Enhancement on T1-weighted DCE-MRI can be assessed in two ways: by the analysis of signal intensity changes (semiquantitative) and/or by quantifying contrast agent concentration change using pharmacokinetic modeling techniques. Signal enhancement can be visually evaluated with the use of subtraction techniques and by using the region of interest (ROI) method. Subtraction images are created by subtraction of precontrast MRI images from the gadolinium-chelate-enhanced MRI images. On these subtraction images, small areas within the tumor that enhance fast relative to enhancement of nearby arteries can be identified. ROIs are placed on these early enhancing areas that are identified on subtraction images. The signal intensity within these ROIs is plotted against time in time-intensity curves (Fig. 56.4). Semiquantitative parameters can be derived from these time-intensity curves. These parameters include curve shape, onset time (time from arrival of contrast agent in an artery relative to arrival of contrast agent in the tissue of interest), slope of enhancement curves, time to maximum enhancement, maximum enhancement, and washout. Commercial software is currently becoming available that generates standardized quantitative data. This requires T1 mapping prior to contrast agent administration. Validation of these quantitative parameters is still an issue.
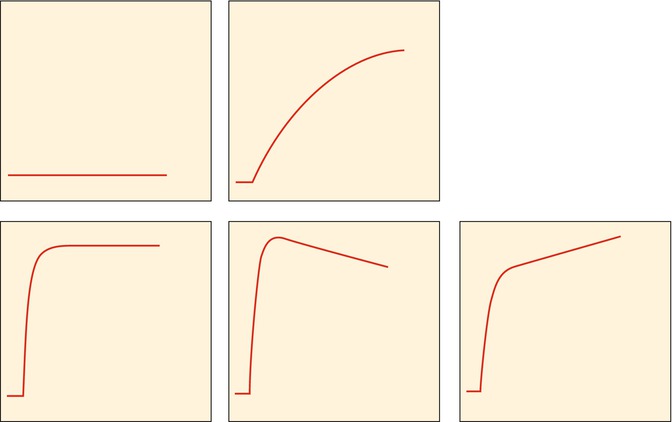

Fig. 56.4
Classification for subjective assessment of time-intensity curves: type I, no enhancement; type II, gradual increase of enhancement; type III, rapid initial enhancement followed by a plateau phase; type IV, rapid initial enhancement followed by a washout phase; and type V, rapid initial enhancement followed by sustained late enhancement (Reprinted with permission from reference [7])
A two-compartment model relating the change of tissue tracer concentration to the difference between arterial plasma and interstitial fluid concentrations is most often used. A detailed discussion on pharmacokinetic modeling techniques can be found elsewhere [18]. A transfer constant K trans (s−1) describes the transendothelial transport of the small molecular contrast agent from the vascular to the interstitial space. Three major factors determine the behavior of the contrast agent in tissues during the first few minutes after injection: blood perfusion, transport of contrast agent across vessel walls, and diffusion of contrast medium in the interstitial space. Changes in the semiquantitative parameters can be used to assess changes in microcirculation during chemotherapy.
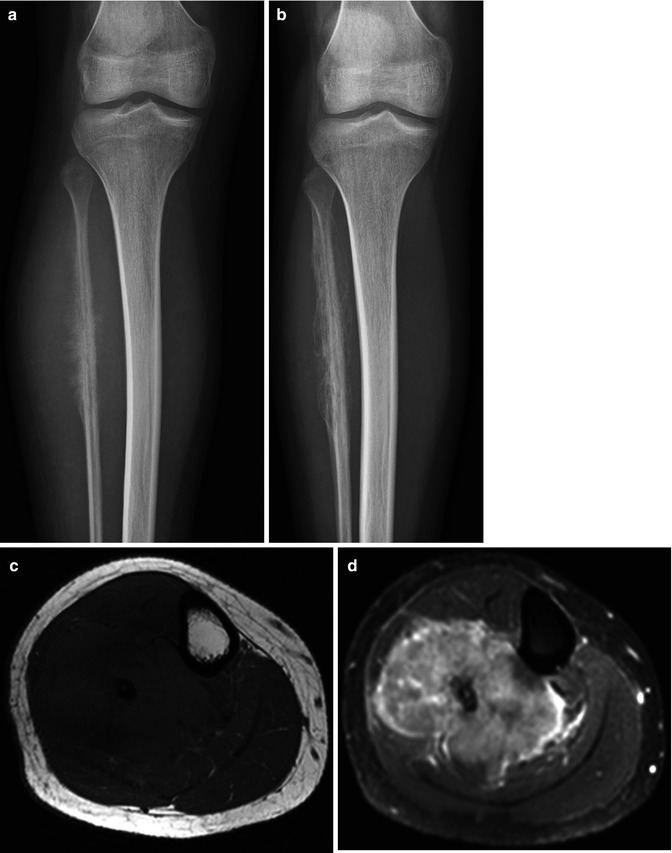
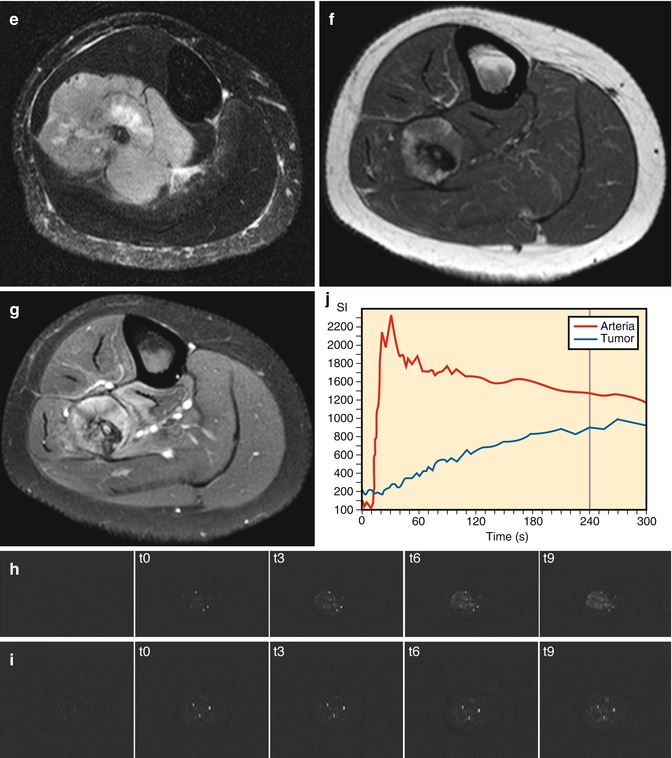
DCE-MRI has been reported to be a valuable technique for the identification and localization of residual viable tumor after chemotherapy and improves differentiation between good and poor response in bone and soft tissue sarcomas. DCE-MRI targets parameters that define angiogenesis. Under therapy, changes in capillary permeability (time-intensity curve shape and slope) and vascular density (maximum enhancement) are often observed before changes in tumor volume. Direct visual inspection of the (subtraction) images before and after chemotherapy allows easy detection of highly vascular and/or highly perfused viable tumor tissue. When more than 10 % of the total tumor volume enhances early (defined as enhancement within 6 s after arterial enhancement), a poor response with more than 10 % of tumor tissue remaining viable should be suspected. Areas of early and rapidly progressive enhancement (steep slopes) confirmed by type III, IV, or V time-intensity curves (Fig. 56.4) correspond with more rapid uptake of the contrast agent, owing to increased vascularization and perfusion associated with presence of viable tumor. Areas within the tumor demonstrating late and gradual or absence of enhancement confirmed by type I or II time-intensity curves reflect the presence of nonviable tumor tissue (Figs. 56.3, 56.5, 56.6, and 56.7; Table 56.1).
Get Clinical Tree app for offline access


Fig. 56.5
Ewing’s sarcoma of the fibula. Following chemotherapy no viable tumor was found in the resected specimen. (a) Radiograph before chemotherapy shows the malignant features. (b) following chemotherapy, regular periosteal reaction is seen. Pretreatment features are seen on the T1 axial (c), T1 fat-saturated Gd chelate (d


Stay updated, free articles. Join our Telegram channel

Full access? Get Clinical Tree


