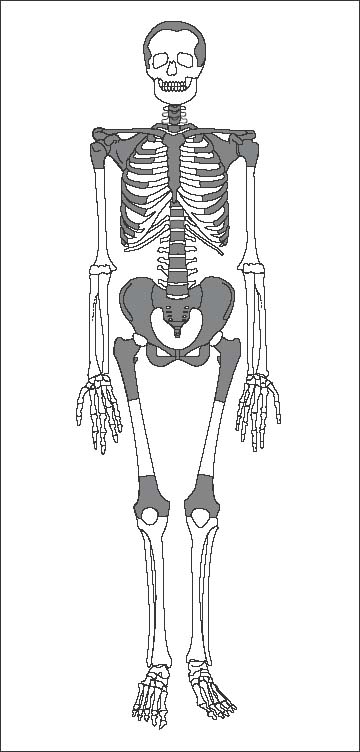
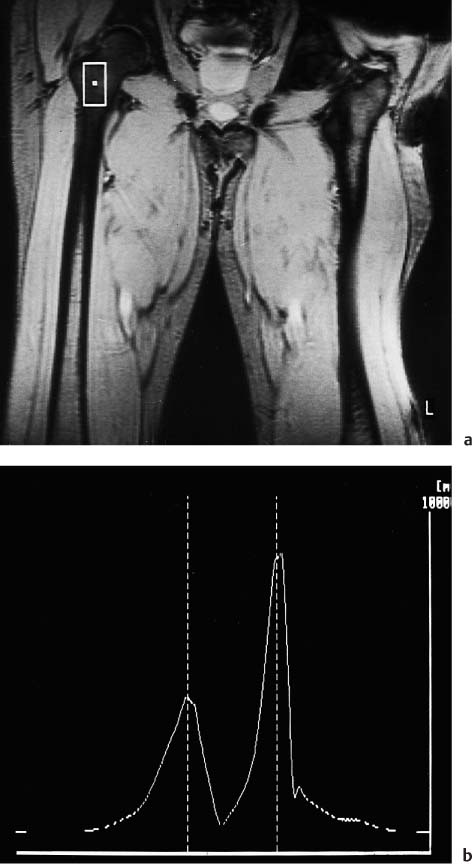
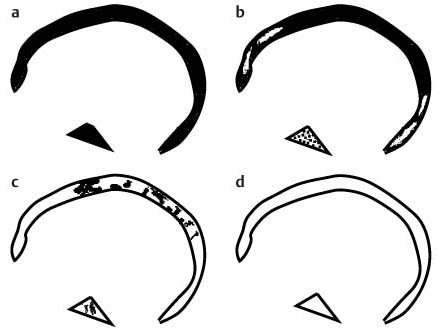
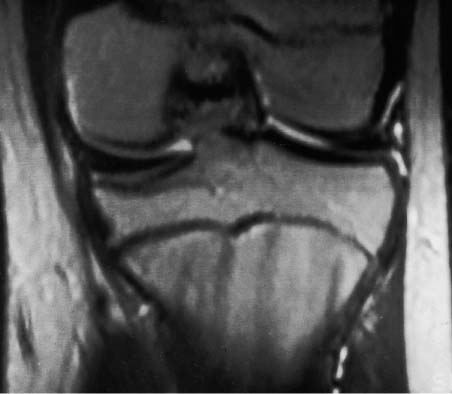
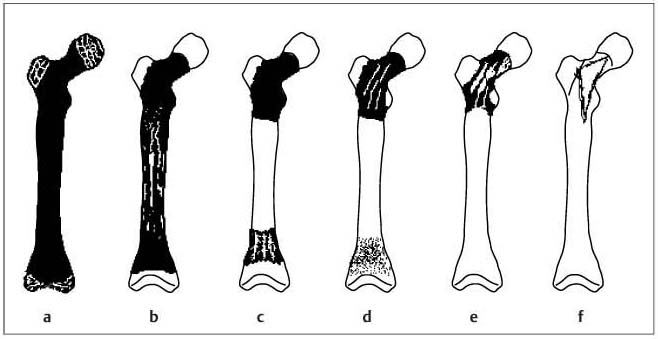
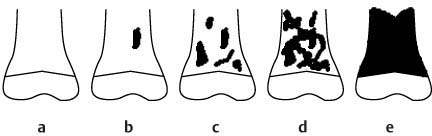
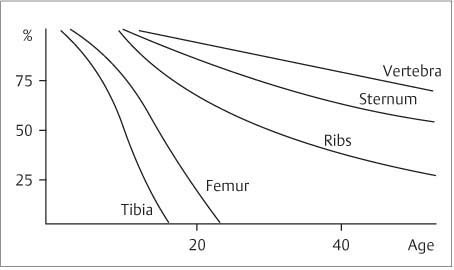
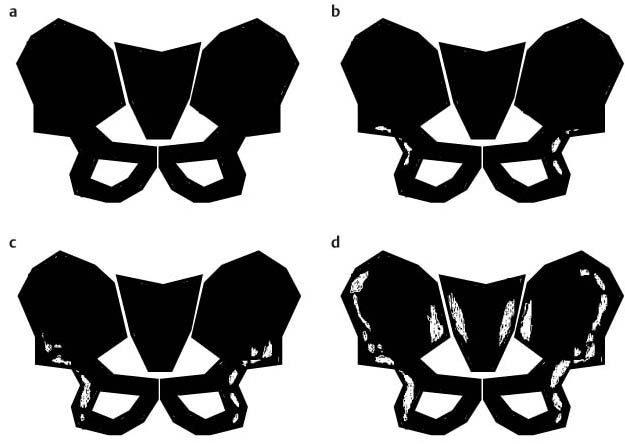
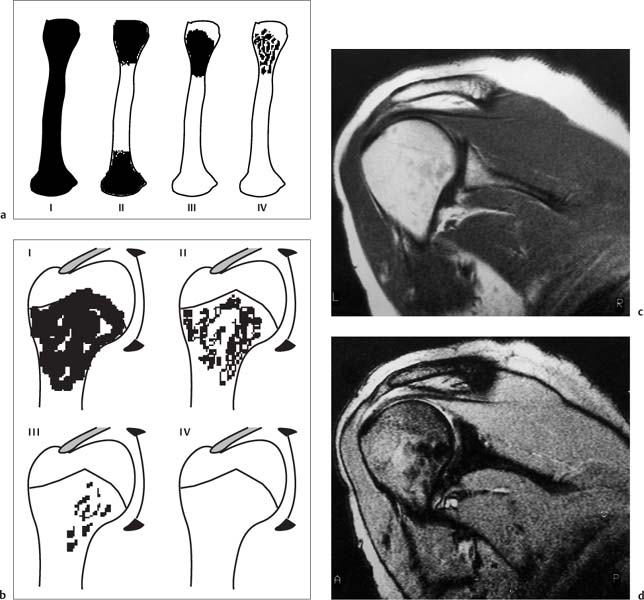
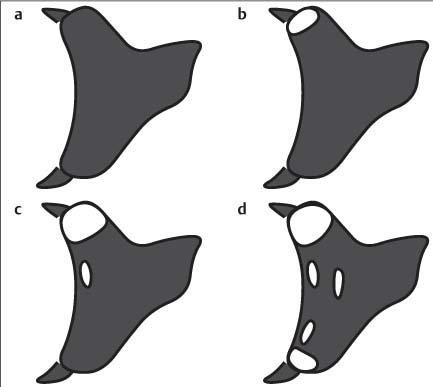
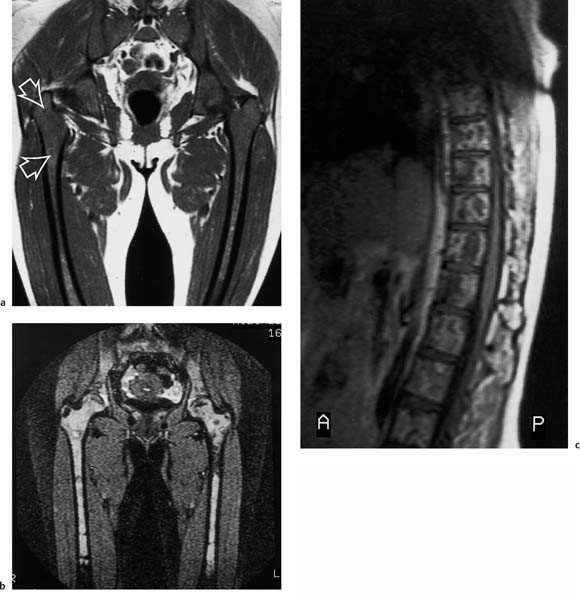
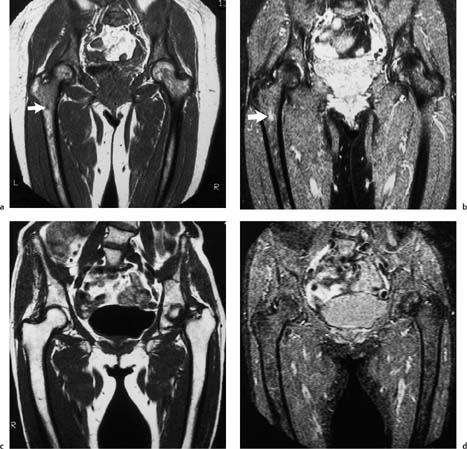
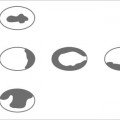
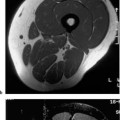
11 Bone Marrow The imaging properties of the bone marrow in specific MRI sequences depend on the following factors: • Distribution of red, hematopoietic active marrow and yellow marrow, • Density of the trabecula, • Age, gender, and anatomic region. It is for this reason that no general examination technique can be recommended. T1-weighted SE Sequences. These play a fundamental role in the examination of the bone marrow. They show a high level of contrast between high-signal fatty marrow and low-signal hematopoietic marrow and pathologic lesions, with little contrast between hematopoietic marrow and pathologic lesions because of the almost equally low signal intensity. T2-weighted SE Sequences. In contrast to most other body regions, T2-weighted images of the bone marrow are rarely more informative than the T1-weighted images because of poor contrast between fatty and hematopoietic marrow. Bone containing both red and yellow marrow appears more homogenous on T2-weighted sequences compared with T1-weighted sequences. In addition, there is little difference in signal intensity between pathologic processes and fat containing marrow, both of which show high signal intensity on T2- weighted images. The problem is most pronounced when TSE sequences are used since these result in higher signal intensity from fat, further reducing the contrast between pathologic lesions, with their relatively long T2, and surrounding fatty marrow. The use of fat suppression in conjunction with T2-weighted TSE sequences solves this problem. Bone marrow metastases may appear both hyper- and hypointense relative to surrounding healthy marrow (28). Use of Contrast Medium. This is not necessary for the detection of pathologic bone marrow lesions in general. In individual cases, however, it can be used to further characterize a pathologic finding. Due to the increase in signal intensity in pathologic processes, the already relatively high-signal bone marrow equalizes with the enhanced, originally low-signal intensity lesion, decreasing the detection sensitivity. While marked enhancement suggests an acute inflammatory, post-traumatic or tumorous process, it generally cannot be used for differentiating these processes. Opposed-Phase GRE Sequences. Opposed-phase GRE sequences are highly sensitive for the detection of red bone marrow (26). The hematopoietic bone marrow is visualized as low signal intensity or even as signal void. In part, this is due to the imaging parameters, with the phases of the fat and water protons opposed, and, in part, to susceptibility effects of iron-containing compounds in the bone marrow. A further factor must be considered when evaluating GRE images of the bone marrow. This is the appearance of susceptibility effects arising from the bony trabeculae. These cause osseous regions with a high content of trabecular bone, such as the apophyses and epiphyses, to have a lower signal intensity compared with regions of low trabecular content (52).The intensity of these effects increase with increasing echo times. STIR Sequences. STIR images are of great value for the evaluation of pathologic lesions (19). Normal bone marrow is seen as signal void, hematopoietic bone marrow as low-signal intensity, and lesions as high-signal intensity. This technique is characterized by a high sensitivity, but a low specificity. Chemical Shift Imaging. This method provides a quantitative basis for assessing the water and fat signal fractions within the bone marrow (49, 66). Similar to the opposed-phase GRE technique, it is based on the chemical shift between the protons of fat and water. Although this phase contrast imaging of the chemical shift cannot increase the specificity of bone marrow lesions (13), it can improve the sensitivity of MRI to bone marrow infiltrations of systemic diseases, such as found in Hodgkin disease, non-Hodgkin lymphoma or leukemia. Furthermore, by offering a quantitative assessment of the relative water fraction, it can monitor the therapy of systemic diseases, such as leukemia. Because of the additional effort of analyzing user-defined regions of interest, quantitative imaging of the chemical shift for evaluating the bone marrow has stayed in specialized referral centers. Relaxometry. Though most pathologic lesions as well as physiologic processes of the bone marrow cause subtle alterations of the relaxation times, relaxometry has not been found to be useful in evaluating the bone marrow, just as it has failed in MRI of other areas. The T1 relaxation times can be precisely and accurately determined, for instance with spectroscopic methods using a series of inversion recovery sequences with varying inversion times (TI), but the diagnostic usefulness has not been established. Measuring T2 relaxation times is methodically much more difficult. Because of the multi-factorial nature of the T2 relaxation times, the measurements depend on the particular method used and show considerable variation. As a result, the relaxation times between healthy bone marrow and various pathologic conditions overlap and the necessary specificity is not achieved. This is accentuated by the subtle changes related to age, gender, and location. The potential role of quantitative MRI applies to serial studies performed under identical conditions in patients undergoing myelosuppressive therapy (54). Fig. 11.1 Age-dependent percentage of hematopoietic marrow in different bones. The bone marrow is the largest organ of the body. After the fourth embryonal month, the bone marrow increasingly assumes the function of hematopoiesis (24), and hematopoiesis occurs in all bones at birth. The need for hematopoiesis declines during childhood and more and more sections of the bone marrow become hematopoietically inactive, with fat cells replacing the hematopoietic cells. The fat cells increase in number and size. Hematopoietically active bone marrow appears red. After it has become hematopoietically inactive, it turns yellow owing to its high fat content. This conversion from hematopoietically active to hematopoietically inactive marrow begins in the distal phalanges of the hands and feet and slowly progresses centripetally (Fig. 11.1). Within the tubular bones, the diaphysis is converted first, followed by the distal metaphysis. The proximal metaphysis is converted last. Apophyseal and epiphyseal bone marrow contain inactive bone marrow within a few months of the development of the secondary ossification centers and are hematopoietically active only for a short time (16). In the adult hematopoietic tissue is found in the following regions: Fig. 11.2 Hematopoietic bone marrow (black) in young adult. Fatty marrow may already predominate in the distal femoral metaphysis. • proximal metaphyses of the humerus and femur, • pelvis, • vertebral bodies, • sternum, • scapula, • calcaneus, • calvaria (Fig. 11.2). The signal intensities in the bone marrow are determined by the proportion of its constituents, which are basically water, fat, and protein (Fig. 11.3). The contribution of each constituent is still not entirely understood. For instance, the relaxation of water depends on its environment and the following states with different signal characteristics can be identified: • complex bound water, • bound water, • free water, • structured water. The state of the water in specific tissues is not exactly known. Fat also occurs in various states with different resonance frequency, which, for instance, depends on the protons in the methyl groups and on the vicinity of double bonds in unsaturated fatty acids. Furthermore, the relaxation times of proteins are related to the state of the protein molecules in different solutions (59). It is this complexity that has so far defied any understanding of how much each individual component contributes to the signal intensity. Hematopoietically active (red) bone marrow is mildly hypointense to muscle on TI-weighted images. On T2-weighted images, its signal intensity is slightly increased. With advancing age, the signal intensity of hematopoietic marrow shows a progressive increase on the T1-weighted image so that it clearly exceeds that in muscle. This age-related change reflects the replacement of hematopoietic marrow by fatty marrow (see above), causing a decrease in the T1 relaxation time and a corresponding increase in signal intensity (8). The hematopoietically inactive (yellow) bone marrow has high signal intensities on T1-weighted images, explained by its high fat content, and a slight decrease in signal intensity on T2-weighted images. It follows the signal pattern of the subcutaneous fat. The MRI distribution of yellow marrow differs from existing macroscopic anatomical data since MRI seems to be more sensitive to the presence of microscopic fat in the marrow. Bone marrow appears as high-signal yellow marrow on MRI even if histologically it contains less than 60% fat and, in children at age 10 years, as little as 20% fat (35). Macroscopically, bone marrow becomes visibly ‘yellow’ only if it contains more than 80% histologic fat. These differences explain the discrepancy between the specimen-derived and MRI-derived stage of the bone marrow development. Fig. 11.3a, b Proton spectroscopy of hematopoietic bone marrow.a Volume of interest in the right femora.b Spectrum with high peaks of water and protein protons and a small peak of fat protons. The relative distribution of water, fat, and proteins in the bone marrow is: • about 40% water, 40% fat, and 20% protein for hematopoietic bone marrow, • about 15% water, 80% fat, and 5% protein for the inactive marrow. While these numbers apply to the macroscopically distinguishable bone marrow types, the distribution is not constant, with a spectrum of values between the numbers given. Evaluating the MRI findings requires familiarity with the various patterns of distribution of fatty and hematopoietic bone marrow, otherwise residual hematopoietic marrow, for instance, might be mistaken for an infiltrative process. The normal age-related distribution patterns that can be recognized in important osseous regions are illustrated as schematics in Figs. 11.4–11.10. They show no gender difference. The distribution patterns of fat and red marrow encountered can be described as follows: Fig. 11.4a–d Normal age-related distribution pattern of active and inactive bone marrow in the pelvis.a Hematopoietic marrow throughout the pelvis in childhood.b Islands of fatty marrow in the acetabular region in adolescence.c Islands of fatty marrow in the acetabular region and ilium in adulthood.d Islands of fatty marrow in the acetabulum, ilium, and along the iliosacral joints in senescence. Fig. 11.5a–c Normal, age-related distribution pattern of active and inactive bone marrow in the vertebral bodies.a Predominately hematopoietic marrow with fatty marrow around the basivertebral vessels in childhood.b Diffusely distributed focal deposits of fatty marrow within hematopoietic marrow in adulthood.c Fatty marrow near the end plates in senescence. Fig. 11.6a–d Normal age-related distribution pattern of active and inactive bone marrow in the calvaria and clivus.a Exclusively hematopoietic marrow at birth.b Islands of fatty marrow appear in the frontal, occipital and temporal bones and in the clivus during childhood and adolescence.c Extensive fatty replacement with remnants of hematopoietic marrow in the parietal bone and clivus.d Complete fatty replacement without any hematopoietic marrow in senescence. • The pelvis can show areas of inactive marrow in the acetabulum and anterior ilium at an early age (Fig. 11.4) (6). With advancing age, fatty marrow appears along both sides of the sacroiliac joints. • The vertebral bodies show band-like and triangular accumulations of fatty marrow near the end plates, especially in the lower lumbar spine. These findings increase with age (Fig. 11.5) (15). These changes might be related to the mechanical load acting on the lumbar spine. Another pattern consists of multiple small areas of fatty marrow (48). With increasing age, the signal intensity in the vertebral bodies continually increases due to diffuse deposition of fat and can exceed the intensity of the musculature. As a result, the intervertebral disks appear dark in comparison with the vertebral bodies on T1-weighted images. • The calvaria also shows a typical pattern of fat and red marrow, with fat marrow found in the occipital, temporal and frontal bones at an early age (Fig. 11.6). Hematopoietic marrow can persist in the parietal bone in the older patient (48). The clivus contains hematopoietic marrow at birth, with conversion to fat marrow in adulthood (41). • The hematopoietic marrow in the sternum and clavicle is largely uniformly distributed (32, 69). Fat deposition is usually absent. • The proximal humeral metaphysis has a predominantly homogeneous hematopoietic marrow in young adulthood (Fig. 11.7a). With advancing age, the red marrow converts, remaining visible the longest along the medial shaft (Fig. 11.7b–d) (61). Women often have more red marrow in the humerus than men. This is particularly the case with heavy smokers. Fig. 11.7a–d a Normal, age-related distribution pattern of active and inactive bone marrow in the humerus.I Hematopoietic marrow throughout the humerus.II Hematopoietic marrow in the proximal and distal humeral metaphyses including adjacent diaphyses in childhood.III Hematopoietic marrow in the proximal humeral metaphysis in adulthood.IV Remnants of hematopoietic marrow in the proximal humeral metaphysis in senescence.b Normal, age-related distribution pattern of active and inactive bone marrow in the proximal humeral metaphysis.I Predominately hematopoietic marrow in adolescence.II, III Preferentially lateral regression of hematopoietic marrow in adulthood.IV Few if any residues of hematopoietic marrow in senescence.c T1-weighted SE sequence with preferentially medially located remnants of hematopoietic marrow seen as confluent areas of low signal intensities.d Visualization of hematopoietic marrow as signal void with GRE technique. • The scapula shows nearly exclusively red marrow. In about 95% of cases, however, yellow marrow confined to upper aspect of the glenoid fossa can be encountered, independent of age or gender. This may be related to mechanical factors caused by the insertion of the long biceps tendon (61) (Fig. 11.8). With advancing age, fatty marrow appears in the juxta-articular middle and lower glenoid areas. • The distal femoral metaphysis occasionally shows a pattern of alternating linear distribution of both marrow types (Fig. 11.9). With advancing age, the hematopoietic marrow regresses. In the proximal femoral metaphysis, a homogeneous pattern of hematopoietic marrow is seen, which decreases in size with advancing age (34, 48). The fatty marrow progresses from the apophyses of the greater and lesser trochanter (Fig. 11.10). Fig. 11.8a–d Bone marrow distribution pattern in the scapula.a Exclusive hematopoietic marrow in infancy.b and c Fatty marrow deposition in the upper aspect of the glenoid process observed in about 90% of all cases independent of age.d Additional areas of fatty marrow in the inferior aspect of the glenoid fossa in senescence. Fig. 11.9 GRE sequence of the knee of a healthy 12-year-old boy. Linearly oriented remnants of hematopoietic marrow in the proximal tibial metaphysis. Fig. 11.10 a–f Normal, age-related distribution pattern of active and inactive bone marrow in the femora.a Hematopoietic marrow throughout the femora in childhood. The epiphyses are not yet ossified.b Early fatty replacement of the hematopoietic marrow in the femoral metaphysis in a child under the age of 10 years.c Remnants of hematopoietic marrow in the proximal and distal femoral metaphyses in adolescence until the age of 20 years. The distal metaphysis shows a striped pattern.d and e Further regression of the hematopoietic marrow with increasing age in adulthood.f Complete regression of the hematopoietic marrow surrounding low signal trabeculae of the proximal metaphysis in senescence. The disease processes that induce diffuse or multifocal changes of the bone marrow can be categorized according to the MRI pattern of the bone marrow (63). The categories include: • conversion of fatty marrow to hematopoietic marrow with hyperplasia of the residual fraction of hematopoietic marrow (reconversion), • marrow infiltration with regular or malignant cells, • depletion of the hematopoietic marrow with subsequent fatty replacement, • depletion of myeloid elements and subsequent fibrosis, • deposition of metabolic products, • sequelae of bone marrow transplant. If the demand of certain diseases exceeds the capacity of the hematopoietic bone marrow, areas of inactive bone marrow are reconverted from fatty to hematopoietic marrow. This is called reconversion since it reverses the normal conversion from hematopoietic to fatty marrow during childhood. In severe or rapidly progressing conditions, hematopoietic marrow also appears in the epiphyses and apophyses. The remaining hematopoietic marrow also increases its activity and becomes hyperplastic. Marrow hyperplasia has the signal intensity of neonatal marrow and is equal to or lower than that of normal musculature. In the spine, the disk can have the same or a lower signal intensity relative to the vertebral bodies on T1-weighted images. The causes of reconversion and hyperplasia include conditions that • exceed the hematopoietic ability of the normally present red marrow: – chronic anemia, – chronic infection, – chronic cardiac decompensation, – hyperparathyroidism, – endurance athletes (53), – heavy smokers (43). • have large areas of cellular infiltration in the red marrow: – vertebral infiltration caused by lymphoma, plasmocytoma, – diffuse vertebral metastases, – leukemia. • have large areas of red marrow replaced by fat: – chemotherapy, – large field radiotherapy. • have large areas of red marrow replaced by fibrosis: – myelofibrosis. Furthermore, treatment with hematopoietic growth factors can induce reconversion of initially yellow marrow to hematopoietic marrow (10), producing changes in the marrow that may simulate bone marrow involvement by tumors. Hematopoietic hyperplasia can be an incidental finding in patients undergoing MRI for another reason and having no evidence of an underlying cause. The hyperplasia may represent hematopoietic marrow that has been reconverted by a remote and no longer identifiable process (7, 26). To quantify the extent of reconversion, grading of the hematopoietic marrow in the distal femoral metaphysis has been proposed on a scale of four levels (Fig. 11.11) (26): • Grade I and II indicate a low level of hematopoietic marrow. This is often encountered without apparent cause. In one study, it was a frequent finding in young obese women. • Grade III and IV generally can be attributed to an underlying cause. It can be difficult to differentiate foci of reconverted bone marrow in an atypical location, such as in the diaphysis of a long tubular bone, from a malignant disease process (12). Moreover, metastases within reconverted bone marrow can cause differential diagnostic problems (Fig. 11.12). MRI has confirmed the marked expansion of hematopoietic bone marrow in sickle cell disease, with the hematopoietic hyperplasia seen as decreased signal intensity on the T1-weighted images throughout the femur and focally in the axial skeleton (45). In sickle cell crisis with painful joints, juxta-articular foci of decreased signal intensity on the T1-weighted image with increased signal intensity on the T2-weighted image are consistent with acute diametaphyseal bone infarcts. Focally decreased signal intensity on T1-weighted and T2- weighted images indicates absence of edema and is consistent with old infarction or fibrosis. Increased cellularity generally causes the signal intensity to decrease on T1-weighted images and to be the same or to increase on T2-weighted images. GRE and STIR sequences have a higher sensitivity in detecting these changes, which frequently increase the T2 relaxation time. Fig. 11.11 a–e Schematic drawing of the various manifestations of reconverted bone marrow in the distal femora (after 26).a No hematopoietic marrow.b Focal.c Multifocal.d Confluent, e Complete reconversion of the marrow in distal femoral metaphysis. Fig. 11.12 a–c Extensive reconversion of the bone marrow in diffuse metastases of a medulloblastoma.a T1-weighted SE sequence, coronal section through the pelvis and femora. Diffuse decrease in signal intensity in the femora and pelvis due to reconverted hematopoietic bone marrow. Occasional heterogeneity of the signal, compatible with metastases (arrows).b Fat-suppressed STIR sequence of the same region. High-signal visualization of the bone marrow with occasional heterogeneity of the signal.c Sagittal T1-weighted SE sequence of the spine after administration of contrast medium. Diffuse metastases throughout the entire axial skeleton. Polycythemia vera represents a clonal neoplastic proliferation of the pluripotent hematopoietic stem cells and is characterized by an increase in red cell mass and a high cell turnover. MRI shows the increased marrow cellularity as homogeneous decrease in signal intensity on the T1- weighted images and no change or only a slight increase in signal intensity on T2-weighted images (17). The high cell turnover induces a reconversion of fatty to cellular marrow in the peripheral skeleton. MRI of the pelvis is especially suited for evaluating the marrow compartment and should include the spine, representative of the axial skeletal marrow, and the femora, representative of the appendicular skeletal marrow. The MRI findings improve during treatment with phlebotomies and chemotherapy. The marrow pattern in the proximal femoral metaphysis seems to correlate well with the clinical severity as determined by established laboratory parameters (21) (Fig. 11.13). Fig. 11.13 a–d Two patients with polycythemia vera.a, b Female patient with untreated polycythemia vera and extensive polyglobulinemia.a T1-weighted SE sequence, coronal plane. Decreased signal intensity in the femora compatible with bone marrow reconversion. Relatively low signal intensity also in the epiphysis. Remnants of normal fatty marrow in the greater trochanter and, partially, in the diaphysis. Focal decrease in signal intensity in the metadiaphyseal region compatible with a bone infarct (arrow).b Fat suppressed STIR sequence. In comparison with the subcutaneous fat, the femoral marrow has a relatively high signal. Focally increased signal intensity (arrow) compatible with a bone infarct.c, d Female patient with polycythemia vera. Following cytostatic therapy with hydroxycarbamide, normal differential blood count.c T1
Examination Technique
Anatomy
 General Anatomy
 Specific MR Anatomy

Generalized Disorders
 Reconversion, Hyperplasia
 Cellular Infiltration, Displacement
Polycythemia
![]()
Stay updated, free articles. Join our Telegram channel


Full access? Get Clinical Tree


