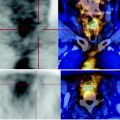
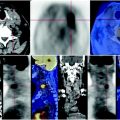
Fig. 52.1
The PET-CT axial and MIP images a–c show the progression of the metastasis to the sternum during follow-up and the absent response to medical therapy. The CT shows the volumetric expansion of the lytic lesion with cortical interruption in the scan performed six months later (c), better seen in the sagittal reconstruction. After radiotherapy (d) reduction of the metabolic activity of the lesion showing sclerotic margins and low carbohydrate deposition due to actinic reaction are observed
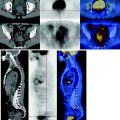
Fig. 52.2
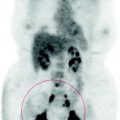
The PET image shows two areas of modest increase in glucose consumption at the sacroiliac joint, on the right sacral side (Fig. 52.3). On CT scans, morphostructural bone changes are not observed, although there is a scarcity of trabeculae in the sacrum right, without interruption of cortical rhyme. CT-PET suggests though a metastatic replacement of the bone marrow, that has not yet determined osteolysis on CT, an event generally is seen lately
At the same time new metastases appear in the sacrum and the right sacral wing, which are characterized by abnormal glucose consumption.
The clavicular fossa lymph node detected in the left shows a limited increase of FDG metabolism and is therefore reactive in nature and benign: radiation therapy at the level of sternal metastases may lead to inflammation of the region with satellite adenitis (MIP image in Figs. 52.1d, 52.2d) (See also Figs. 52.3, 52.4).
Related posts:
 Laryngeal Squamous Carcinoma: Staging
 Radio-Treated Cancer of the Posterior Hemi-Circumference of the Anal Canal: Post-Actinic Fibrosis
 Bone-Destroying Metastases in Thyroid Undifferentiated Carcinoma
 Surgically Treated Endometrial Cancer: Bilateral Nodal Recurrence
 Undifferentiated Gastric Adenocarcinoma with Peritoneal Carcinosis
 Follow-Up of Papillary Breast Cancer: Solitary Sacroiliac Benign Lesion
Stay updated, free articles. Join our Telegram channel

Full access? Get Clinical Tree


