(1)
Institute of Radiology, University Hospital Erlangen, Maximiliansplatz1, 91054 Erlangen, Germany
57.1 Introduction
57.2.1 Conventional X-Rays
57.2.2 Computed Tomography
57.2.3 Magnetic Resonance Imaging
57.3.2 Vessel Size Imaging
57.3.3 Diffusion-Weighted Imaging
Abstract
Bone metastasis is frequently observed in the most relevant types of solid tumors representing an important imaging target for detection and follow-up. For this purpose, morphologic aspects of skeletal lesions are assessed by conventional X-rays, CT, and MRI, whereas bone scintigraphy and SPECT reveal changes of bone remodeling. However, more recently developed approaches reflecting functional and metabolic characteristics in bone metastasis can be used for early detection and treatment response assessment of these lesions that include dynamic contrast-enhanced, vessel size, and diffusion-weighted imaging as well as MR spectroscopy, different PET tracers, and hybrid techniques. The focus of this chapter is to review functional and metabolic techniques and the underlying pathogenic processes resulting in the respective imaging findings.
Abbreviations
ADC
Apparent diffusion coefficient
AUC
Area under the curve
BS
Bone scintigraphy
CPS
Cadence contrast pulse sequencing
CT
Computed tomography
DCE
Dynamic contrast-enhanced
DWI
Diffusion-weighted imaging
EORTC
European Organisation for Research and Treatment of Cancer
F
Fluoride
FDG
Fluorodeoxyglucose
FT
Filling time
MDP
Methylene diphosphonate
MRI
Magnetic resonance imaging
MRS
Magnetic resonance spectroscopy
PDGFR
Platelet-derived growth factor receptor
PE
Peak enhancement
PET
Positron emission tomography
PTHrP
Parathyroid hormone-related protein
RANK
Receptor activator of nuclear factor κ B
RANKL
Receptor activator of nuclear factor κ B ligand
RBF
Regional blood flow
RBV
Regional blood volume
RECIST
Response evaluation criteria in solid tumors
RGD
Tripeptide sequence Arg-Gly-Asp
SPECT
Single-photon emission computed tomography
TGF-β
Transforming growth factor-β
TIC
Time-intensity curve
UICC
International Union Against Cancer
US
Ultrasound
VEGF
Vascular endothelial growth factor
VEGFR
Vascular endothelial growth factor receptor
VSI
Vessel size imaging
WHO
World Health Organization
XR
Conventional X-rays
57.1 Introduction
Metastasis to bone is frequently observed in the most relevant types of solid tumors. Among these, approximately 70 % of breast and prostate cancer patients succumbing to their disease have evidence of skeletal metastatic lesions [1]. Thus, the skeleton is one of the most common metastatic sites in cancer, and resulting skeletal complications such as pathologic fractures, spinal cord compression, and hypercalcemia severely reduce the quality of life in these patients. For the phenotype of skeletal metastasis, two morphologic extremes exist, ranging from osteolytic to osteoblastic lesions. Whereas tumors from the breast, lung, and kidney result more frequently in osteolytic metastases, prostate cancer or neurogenic tumors rather tend to form osteoblastic lesions. However, phenotypically osteolytic and osteoblastic metastases may appear in the same patients as demonstrated for metastatic melanoma in Fig. 57.1. The most common locations of skeletal metastases are the axial skeleton including spine and pelvis but also humerus and femur. Less frequent locations are the peripheral extremities, namely, tibia, fibula, radius, and ulna as well as the bones of the hand and foot [3].
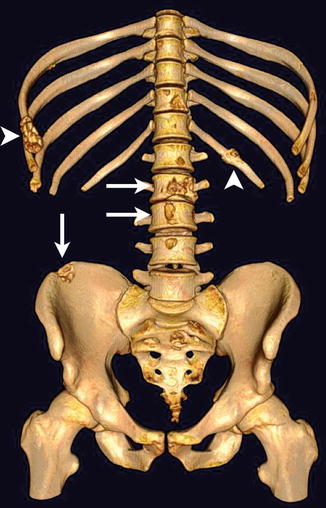
Fig. 57.1
Bone metastases in a melanoma patient with predominantly osteolytic (arrows) and osteoblastic (arrowheads) phenotype in the spine, ribs, and pelvis as presented in a three-dimensional CT surface reconstruction (Reprinted with permission from Bäuerle et al. [2])
Imaging of bone metastases is highly relevant for detection and follow-up of metastatic disease, for the latter most often to evaluate treatment response upon local or systemic therapy. Beyond the assessment of morphologic structures by conventional X-rays (XR), computed tomography (CT), and magnetic resonance imaging (MRI), a wide range of functional and metabolic imaging techniques are applied to metastatic lesions of the skeleton. These include dynamic contrast-enhanced MRI (DCE-MRI), DCE-CT, DCE-ultrasound (DCE-US), vessel size imaging (VSI), diffusion-weighted imaging (DWI), MR spectroscopy (MRS), bone scintigraphy (BS), single-photon emission CT (SPECT), and positron emission tomography (PET). Due to the irregular morphology of bone metastases and the slow turnover of bone matrix, there is a need for quantitative parameters reflecting pathophysiologic processes in skeletal lesions. For this reasons, functional and metabolic imaging is of high importance for the potential to offer quantitative data of biological processes in such lesions. Whereas methods like DCE-MRI, DCE-US, VSI, and DWI are rather novel developments to image functional processes in disseminated skeletal disease, nuclear medicine techniques BS, SPECT, and PET have been used for decades.
This chapter reports on metabolic and functional techniques containing recently described approaches for diagnosis and assessment of treatment response in skeletal metastasis. Before briefly describing morphologic imaging techniques for detection and follow-up, the biologic background as well as current standards for treatment and therapy monitoring of skeletal metastatic lesions are reported. Focus, however, is to summarize functional and metabolic imaging methods for the assessment of bone metastasis with respect to the biological processes underlying imaging findings.
57.1.1 Pathogenesis of Bone Metastasis
Following primary tumor growth, cancer cells detach from this site and intravasate in adjacent blood vessels for hematogenous spread. After circulation via the blood stream and extravasation, disseminated tumor cells enter the stroma of various organs including bone (Fig. 57.2a). Cells that have successfully reached the bone marrow cavity either stay dormant or proliferate to form a micrometastatic lesion, and after further proliferation and angiogenic activity, subsequently form a macrometastasis. During the development of metastasis in the skeleton, two processes occur simultaneously or sequentially: tumor cell proliferation and bone destruction. Both processes are influenced by bone marrow stroma and bone cells that interact with tumor cells in a so-called vicious cycle. Thereby, metastatic cells stimulate osteoclasts and osteoblasts at the endosteal bone surface to resorb or produce bone matrix, leading to osteoclastic, osteoblastic, or mixed metastases. As shown in Fig. 57.2b for osteolytic metastases, tumor cells express factors, such as parathyroid hormone-related protein (PTHrP), that stimulate osteoblasts and bone marrow stromal cells to produce receptor activator of nuclear factor κ B ligand (RANKL) [4]. On osteoclast precursor cells, interaction of RANKL and its receptor RANK results in the maturation of these precursors to active osteoclasts initiating the bone resorption process [5]. Consequently, the release of bone-derived factors such as transforming growth factor-β (TGF-β) stimulates tumor cells to express PTHrP in a positive feedback mechanism.
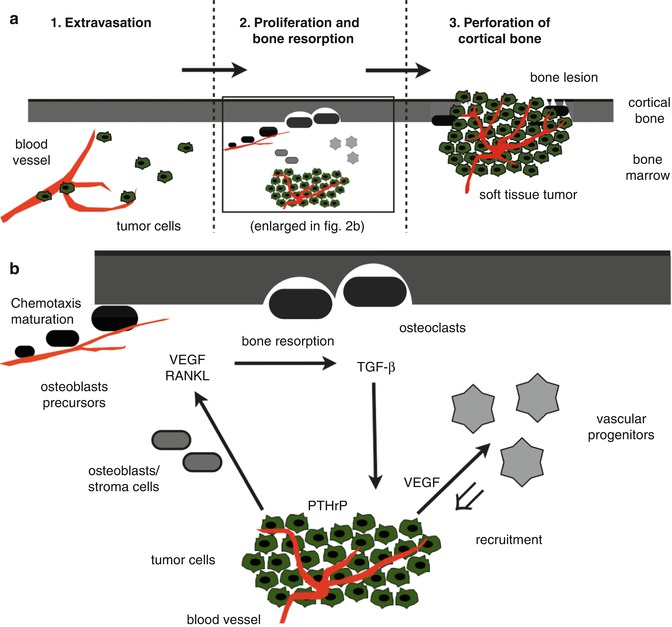
Fig. 57.2
(a, b) Schematic illustration of pathogenic processes in osteolytic bone metastasis. Tumor cells from the primary tumor that have reached the bone marrow cavity extravasate from local blood vessels, proliferate and induce bone formation, finally resulting in perforation of cortical bone (a). The magnification of the pathogenic steps tumor cell proliferation and bone resorption (b) include the expression of factors such as PTHrP, VEGF, RANKL, and TGF-β for inducing a positive feedback loop (vicious circle) as explained in the text. PTHrP parathyroid hormone-related protein, VEGF vascular endothelial growth factor, RANKL receptor activator of nuclear factor κ B ligand, TGF–β transforming growth factor β (Reprinted with permission from Bäuerle et al. [2])
Interestingly, angiogenesis is upregulated in the bone marrow of patients with bone metastasis [6, 7]. For breast cancer bone metastases, key factors of angiogenesis including vascular endothelial growth factor (VEGF), VEGF receptors (VEGFR), and integrins were reported to stimulate osteoclast chemotaxis and activity [8]. At the site of bone resorption, blood vessels were recognized to act as guiding structures for pre-osteoclasts that maturate to bone-resorbing osteoclasts [5, 9]. Furthermore, VEGF and other angiogenic factors are required to recruit vascular progenitor cells from the bone marrow for new vessel formation due to the growing need for nutrients of proliferating tumor cells (Fig. 57.2b).
Resulting from these pathogenic considerations, bone metastases are comprised of two components: a soft-tissue tumor, including cancer cells and tumor stroma (tumor-associated cells and vascularization), and the osseous lesion, which is either predominantly lytic or blastic [10]. These components are shown in Fig. 57.3 for an osteolytic lesion in the proximal femur of a renal cell carcinoma patient. However, also in osteoblastic lesions, active tumor tissue surrounds the site of new bone formation, but volume and cellularity of this soft-tissue tumor component may be decreased as compared to lytic metastases.
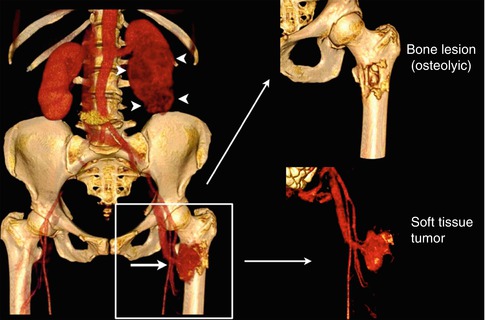
Fig. 57.3
Osteolytic bone metastasis in the left proximal femur (arrow) of a patient with a renal cell carcinoma (arrowheads, left kidney) as presented in a three-dimensional CT surface reconstruction after contrast media application (left). The bone metastasis is comprised of two compartments: the bone lesion (osteolytic; right upper corner) and the soft-tissue tumor that is highly vascularized (right lower corner) (Reprinted with permission, adapted from Bäuerle and Semmler [10])
57.1.2 Treatment and Assessment of Response in Bone Metastasis
Apart from local approaches for the treatment of bone metastasis such as surgery and radiation therapy, systemic drug application is most frequently performed in disseminated disease and includes cytotoxic chemotherapy, bisphosphonates, and hormonal therapy. The latter is administered in case of hormonally active primary tumors, predominantly in breast and prostate cancer. The treatment regimen and resulting mechanism of action is relevant for the choice of imaging techniques to assess the respective morphologic and functional changes. While cytotoxic drugs and hormonal therapy primarily exert an effect on the soft-tissue compartment consisting of tumor and stroma cells, bisphosphonates rather have an effect on bone cells within the osseous lesion by inhibiting skeletal destruction. Currently, particularly nitrogen-containing bisphosphonates like zoledronic acid represent the standard treatment for bone metastases resulting in osteoclast apoptosis that is beneficial for lytic and blastic disease in breast and prostate cancer bone metastases [11, 12]. Interestingly, preclinical and initial clinical data report of direct inhibitory effects of bisphosphonates on tumor cells, which remains to be confirmed in larger studies that include patients with lytic and blastic disease from different primary tumors [13].
With respect to the relatively long survival time of patients with skeletal metastasis in the range of months to several years, assessment of treatment response in bony lesions is crucial for the clinical management [14]. Besides imaging, also biochemical parameters of bone metabolism determined in serum or urine can be used to follow up osseous disease. Secretion of such markers results from the unbalanced activity of osteoclasts and osteoblasts in lytic and blastic lesions. Although serum markers give valuable information on bone turnover processes, they may be of limited sensitivity and selectivity dependent on the metastatic phenotype and the applied treatment [15]. For these reasons, imaging is indispensable for the acquisition of lesion size and location. However, also the assessment of treatment response by imaging has its drawbacks, given the challenging morphology of lesions and the slow turnover of bone that hamper an early determination of response [10, 16]. Several classification systems have been proposed during the last decades as reviewed in Table 57.1 including different imaging modalities to determine the response as (1) complete response, (2) partial response, (3) stable disease, and (4) progressive disease. The response evaluation criteria in solid tumors (RECIST) are the current standard for therapy response assessment proposed in 2000 and recently updated (version 1.1) [20, 21]. According to the initial RECIST guidelines, any bone lesions were considered “truly nonmeasurable” [20]. In the RECIST 1.1 guidelines, the imaging modalities BS, XR, and PET are still not considered adequate to measure bone lesions for follow-up, but are suitable to confirm the presence or disappearance of metastases. CT and MRI, on the contrary, are defined as eligible to measure and follow-up osteolytic lesions with an identifiable soft-tissue component [21]. Osteoblastic lesions, on the contrary, are still considered nonmeasurable. Furthermore, the members of the working group defining RECIST 1.1 excluded the use of functional and metabolic assessment techniques such as DCE-MRI and [18F]-FDG PET for assessment of treatment response due to a lack of standardization and availability.
Table 57.1
Classification systems for assessment of treatment response in bone metastases
WHO [19]b | Hamaoka et al. [16]c | RECIST 1.1 [21]e | ||
|---|---|---|---|---|
Complete response | Disappearance of all known disease | Complete disappearance of all lesions for at least 4 weeks | Complete fill-in or sclerosis of lytic lesion (XR, CT) | Disappearance of all target lesions |
Disappearance of hot spots or tumor signal (BS, CT, MRI) | ||||
Normalization of osteoblastic lesion (XR, CT) | ||||
Partial response | At least 50 % decrease in size of bone lesions | Partial response in size of lytic lesions or decreased density of blastic lesions for at least 4 weeks | Sclerotic rim about initially lytic lesion or sclerosis of previously undetected lesion (XR, CT) | At least a 30 % decrease in the sum of the longest diameter of target lesions |
No new lesions or progressive lesions | Partial fill-in or sclerosis of lytic lesion (XR, CT) | |||
Regression of lesion (BSd) | ||||
Decrease in blastic lesion (XR, CT) | ||||
Stable disease | Unchanged or between 25 % increase and 50 % decrease in size of measurable lesions | Can be diagnosed after at least 8 weeks after initiation of therapy | No change in measurable lesion (XR, CT, MRI) | Neither sufficient shrinkage to qualify for partial response nor sufficient increase to qualify for progressive disease |
No change in blastic/lytic lesion (XR, CT, MRI) | ||||
No new lesion (XR, BS, CT, MRI) | ||||
Progressive disease | Mixed: some lesions persist while others progress or new lesions appear | Increase in size of existent lesions or appearance of new lesions | Increase in size of any existing measurable lesions (XR, CT, MRI) | At least a 20 % increase in the sum of the longest diameter of target lesions or the appearance of new lesions |
Failure: some or all lesions progress and/or new lesions appear | New lesion (XR, SS but exclude flares, CT, MRI) | |||
No lesions regress | Increase in activity (BS but exclude flares) or blastic/lytic lesion (XR, CT) |
57.2 Morphologic Imaging of Bone Metastasis
Imaging techniques reflecting morphologic characteristics of bone metastasis are the current standard of care for bone metastasis detection and follow-up with multiple advantages but also drawbacks. XR, CT, and MRI are routinely used for this purpose. Obviously, morphologic changes captured by XR and CT reflect skeletal changes, either being primarily lytic or blastic, and MRI captures tumor cell-induced changes especially in the bone marrow, or in later stages soft-tissue tumors that are exceeding cortical bone to infiltrate adjacent structures.
57.2.1 Conventional X-Rays
For its wide availability and cost-effectiveness, XR is frequently used to detect and follow-up on bone metastases by capturing morphologic changes in the calcified bone matrix of patients with bone metastases. Osteolytic metastases appear as areas of decreased density after destruction of trabecular and cortical bone, whereas osteoblastic lesions as areas of increased density due to new bone formation. As complementary method for BS, XR is regularly applied to elucidate on unclear BS findings representing a rather specific but insensitive method for the detection of secondary lesions in bone. The main reason for this is that bone destruction of roughly 50 % of the mineralized tissue is detectable with XR [22]. Therefore, lesions in the bone marrow cavity affecting primarily trabeculae are not easy to assess as compared to cortical destruction. As reported above, bone metastases are most frequently located in the axial skeleton, where an overlay of structures hampers the detection of decent findings when using XR, but detection of skeletal metastases in extremities is a valid method as no overlap of other structures or bones is present [23].
Changes in size and density of bony lesions are relevant for determination of treatment response that has to be evaluated differently in lytic and blastic disease. Upon successful treatment, a sequence of sclerotic rim formation, filling of the lytic lesion according to osteoblastic activity and finally fading of an initially visible lesion can be observed [24]. For osteoblastic metastases, decrease or increase in lesion size is a criterion for response or progression, respectively, whereas density changes are rather uncharacteristic [24, 25]. The slow bone turnover results in prolonged morphologic changes of skeletal lesions after treatment that might not be discernable up to weeks or even months upon treatment initiation [24, 26, 27].
57.2.2 Computed Tomography
CT enables the evaluation of bone structure without overlay or obscuring that provides increased sensitivity for the detection of bone metastases as compared to XR, particularly for lesions in the axial skeleton or skull [28, 29]. Furthermore, the size and volume of lesions can be acquired three dimensionally, which improves the evaluation of stability aspects and fracture risk. The possibility of assessing the entire skeleton by CT is of clear advantage over XR as up to 40 % of bone metastases were not covered by regular series of XR covering the axial skeleton [30]. Whole-body acquisition in low-dose technique proved advantageous over conventional radiography for detection of disseminated malignant lesions [31]. As soft-tissue contrast is limited for CT, metastases confined to the bone marrow might be difficult to diagnose, but still, the replacement of regular bone marrow by tumor cells could be assessed with a quantitative approach based on calculation of Hounsfield units within the bone marrow cavity [32]. Morphologic characteristics of an osteolytic lesion on an unenhanced CT scan are displayed in Fig. 57.4a.
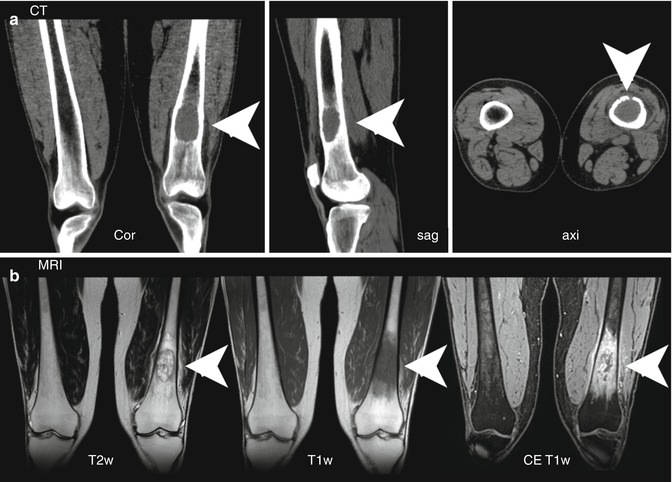
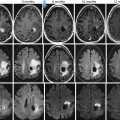
Fig. 57.4
(a, b) Morphologic features of an osteolytic bone metastasis in the left distal femur in a melanoma patient as assessed by CT (a) and MRI (b). The osteolytic lesion (arrowheads) on CT images is presented in coronal, sagittal, and axial orientation. MRI displays morphologic aspects of the soft-tissue tumor (arrowheads) in the bone marrow using T2- and T1-weighted imaging, the latter before and after contrast agent application. T1w T1 weighted, T2 T2 weighted, CE contrast enhanced (Reprinted with permission from Bäuerle et al. [2])
In comparison to XR, CT is superior for determination of treatment response [33]. Using CT, changes in the bone density of metastatic regions can be assessed, where an initial decrease of bone density directly after the initial radiation therapy of osteolytic metastases was followed by an increase after 3 months following therapy [34]. Such re-ossification after radiotherapy was reported in several studies including skeletal lesions from different primary tumors [35, 36].
57.2.3 Magnetic Resonance Imaging
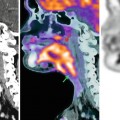
Owing to its excellent soft-tissue contrast, MRI is highly sensitive and specific for the detection of bone metastases, when compared to other imaging modalities [37]. As tumor proliferation often precedes bone destruction, MRI is able to capture malignant bone marrow infiltration before morphologic bone changes become apparent [38]. Tumor proliferation in the bone marrow results regularly in hypo- or isointense T1 and hyperintense T2 signal as well as relatively strong contrast media uptake, regularly seen in osteolytic disease reflecting the extent of tumor infiltration of the bone marrow (Fig. 57.4b). As the tumor cellularity is usually lower in osteoblastic metastases, the described signal changes might not be as pronounced or even absent. In addition, MRI is more suitable than other radiological techniques to evaluate structures adjacent to bone when the intramedullar tumor has penetrated cortical bone and infiltrates nerves, vessels, or the spinal cord [39, 40].
Technical advancements allow whole-body imaging in a reasonable time frame for staging or follow-up of patients with osteotropic primary tumors [41]. Using this technique, sensitivity for detection of skeletal lesions was higher than BS and whole-body CT [41, 42]. Two- and three-dimensional size changes of the soft-tissue tumor mass upon therapy can be captured by MRI, whereas signal intensity variations on T1-weighted images could not be used to diagnose response to treatment [43–45].
57.3 Functional and Metabolic Imaging of Bone Metastasis
Beyond morphology, functional and metabolic imaging techniques enable the assessment of quantitative parameters that display the underlying pathophysiology of bone metastasis. These techniques can be applied using CT, MRI, US, BS, SPECT, and PET. As reported for morphologic differences between predominantly blastic or lytic bone metastases, the phenotype of skeletal lesions is equally crucial for functional data interpretation. In this regard, functional and metabolic methods reflect either characteristics of the tumor cell or the bone compartment or the osseous lesion. Whereas DCE-MRI, DWI, VSI, DCE-CT, DCE-US, MRS, and [18F]-fluorodeoxyglucose ([18F]-FDG)-PET display processes from the soft-tissue compartment, BS, SPECT, and [18F]-fluoride ([18F]-F)-PET reveal features from the bone compartment, namely, bone remodeling. The rationale of using hybrid techniques for bone metastasis imaging is the assessment of complimentary information, e.g., from PET/CT or PET/MRI, of these two compartments in one examination. Apart from the rather blastic or lytic appearance, functional and metabolic characteristics are further influenced by the primary tumor entity. Unfortunately, a considerable number of reports include patients with different primary tumors and phenotypes of bone metastasis, hampering the interpretation of data. Another confounding factor is the lack of standardization of imaging methods, e.g., for DCE techniques different post-processing models are applied and for DWI no consensus on the optimal set of b-values for bone metastasis imaging exists. Despite these limitations, the quantification of functional and metabolic parameters reflecting pivotal pathogenic processes in bone metastases open new perspectives for detection and follow-up of these lesions.
57.3.1 Dynamic Contrast-Enhanced Imaging
Visualization of altered vascularization reveals an important pathogenic process in bone metastasis. Different aspects of microcirculation in skeletal lesions can be quantified by DCE techniques, which is a rather novel way of assessing quantitative data in these lesions. DCE imaging methods that have been applied to bone metastasis comprise CT, MRI, and US and can be used to measure properties of tissue microvasculature such as blood volume, perfusion, and vascular permeability. For these techniques, repetitive imaging upon intravenous administration of contrast agent is required, and compartmental modeling or descriptive analyses are performed subsequently to determine quantitative parameters.
Among the modalities applicable for DCE imaging, DCE-MRI has been applied most frequently to bone metastases. Besides the preclinical DCE-MRI data reported below, several clinical studies have been performed in the last decade. As derived from time-intensity curves (TIC), overall increased descriptive parameters such as peak enhancement (PE) in bone metastasis and multiple myeloma were demonstrated in comparison to non-affected bone marrow [46]. Accordingly, two studies enclosing only prostate cancer patients demonstrated significantly increased values of microcirculation determined in bone metastases by descriptive analysis or the Tofts model as compared to normal bone marrow including PE, Ktrans, and V e [47–49]. Enhancement patterns based on TIC curves were described to contain an early wash-out and a rapid contrast wash-in with a second slower-rising slope to be suitable for discrimination between benign and malignant bone lesions of the spine [50]. When comparing bone metastases to compression fractures, metastatic spinal lesions had a higher PE percentage and steeper enhancement slope than chronic compression fractures, but discrimination to an acute compression fracture was not possible [50]. Tokuda and colleagues investigated the same set of TIC patterns in 34 patients and found no characteristic pattern for differentiation between benign and metastatic lesions, but the steepest slopes of metastatic lesions were significantly higher than those of benign lesions [51]. Sorting of spinal skeletal metastases according to their acuity in acute, subacute, and chronic lesions revealed usefulness of the mean percentage enhancement in these lesions for classification [52]. Thereby, acute lesions enhanced significantly stronger than subacute and chronic metastases, and TIC were significantly different between the three classes as well. Finally, a pilot study by Montemurro et al. demonstrated the feasibility of DCE-MRI in breast cancer patients to evaluate changes in the TIC upon systemic treatment of endocrine therapy and bisphosphonates [53].
For deeper understanding of angiogenic mechanisms in bone metastasis, functional imaging has been used to assess the impact of inhibiting pivotal angiogenic factors in a nude rat model of osteolytic breast cancer lesions (Fig. 57.5). DCE-MRI was performed to capture response to blockade of VEGF, VEGFR/platelet-derived growth factor receptor (PDGFR), and the integrins αvβ3/αvβ5 to be compared with standard treatments, namely, the bisphosphonate zoledronate and the cytotoxic agent paclitaxel [10, 54–56, 57] (Fig. 57.6). Imaging was correlated to histology and documented significant changes in blood volume and vessel permeability in comparison to controls. Interestingly, anti-angiogenic treatments inhibiting VEGF, VEGFR/PDGFR, and αvβ3/αvβ5 resulted in antiresorptive effects and, on the contrary, the antiresorptive agent zoledronate exerted anti-angiogenic properties [54–56, 58]. Thereby, an interaction between angiogenesis and bone resorption was concluded. Besides the consequences for novel treatments of bone metastases, such an interaction was shown to be useful for the assessment of treatment response in experimental bone metastasis. As bone remodeling is a rather slow process, functional changes captured by DCE-MRI including the amplitude A (associated with blood volume) and exchange rate constant k ep (associated with vessel permeability and perfusion) were determined in longitudinal experimental studies according to the two-compartment model of Brix [54, 55, 58–60]. Thereby, significant changes particularly of the amplitude A were detected earlier than morphologic changes acquired by volumetry of osteolysis upon treatment with anti-angiogenic drugs Avastin, sunitinib, Sutent, and cilengitide as well as with the antiresorptive bisphosphonate zoledronate. A significant reduction of the amplitude A was determined as early as 5 days upon the initiation of treatment, whereas osteolytic volume decreased beginning 15 days after treatment initiation in a nude rat model [55, 57].
Get Clinical Tree app for offline access
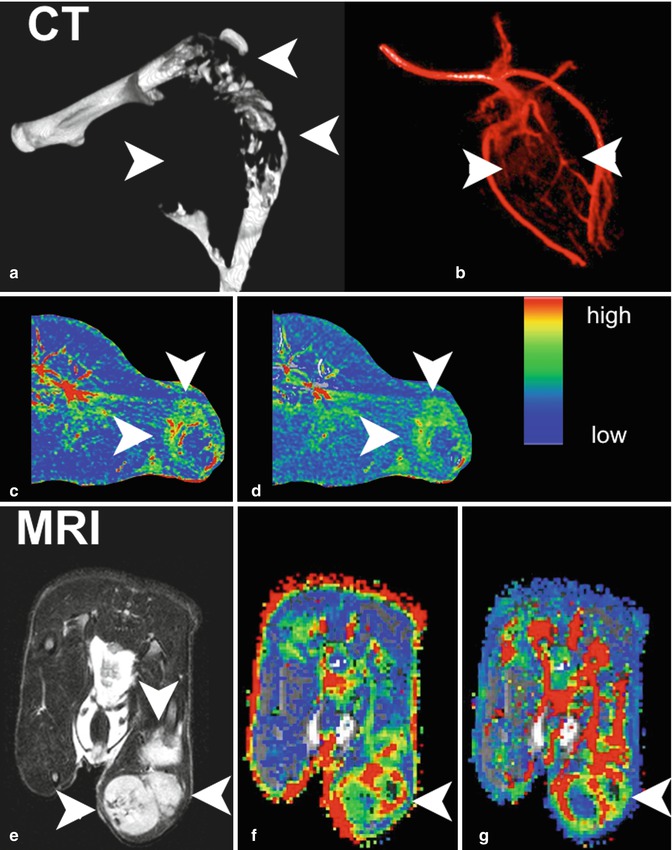
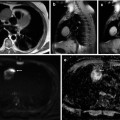
Fig. 57.5
(a–g) Morphologic and functional aspects of experimental breast cancer bone metastasis (nude rat model). Morphology of the osteolytic lesion in the distal femur, proximal tibia, and proximal fibula of the rat hind leg as presented in a three-dimensional CT surface reconstruction (a). Corresponding CT angiography visualizing the abnormal structure of newly formed vessels in the soft-tissue tumor (b). Color-coded parameter maps derived from DCE-CT on axial slices through the bone metastasis (arrowheads; c, peak enhancement; d, area under the curve). T2-weighted MRI in axial orientation showing morphologic features of the soft-tissue tumor (arrowheads; e). Correspondingly from DCE-MRI, color maps for parameters amplitude A (f) and exchange rate constant k ep (g) with arrowheads pointing at the bone metastasis. The color code for DCE-CT and DCE-MRI ranges from red (high values) to blue (low values), respectively (Reprinted with permission from Bäuerle and Semmler [10])
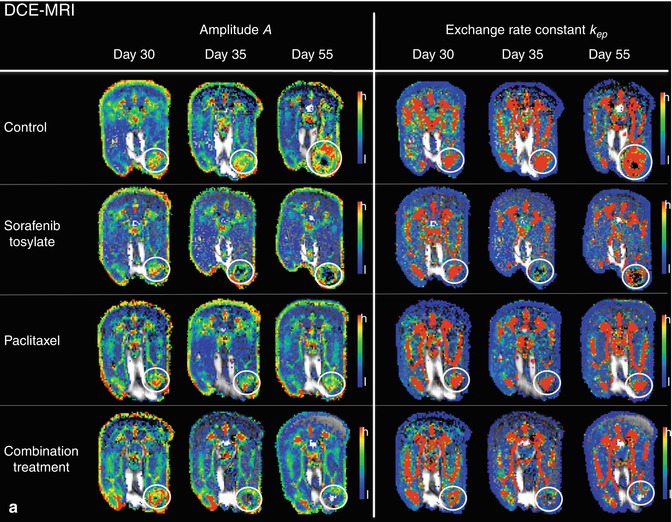
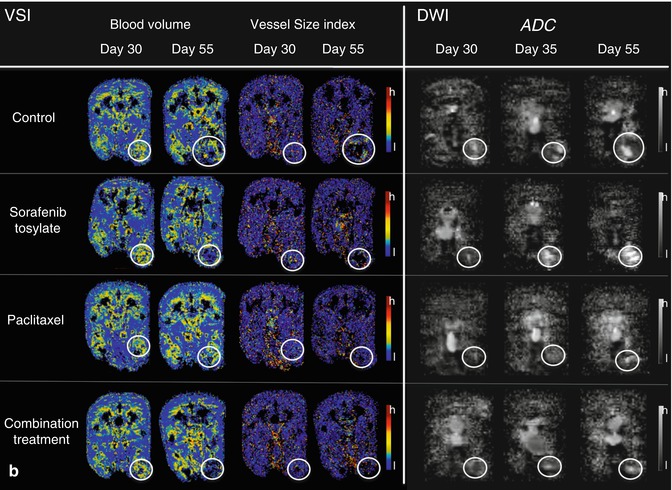
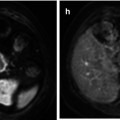
Fig. 57.6
(a, b) Functional parameters in experimental breast cancer bone metastasis from nude rats treated with sorafenib, paclitaxel, and the combined treatment as compared to control animals at days 30 (before application of therapy), 35, and 55 (after initiation of therapy, respectively). Displayed are color-coded maps derived from DCE-MRI (amplitude A, exchange rate constant k ep; a), VSI (blood volume, vessel size index; b), and DWI (ADC; b) in axial orientation through the largest diameter of the bone metastases in the hind legs of nude rats, respectively (white circles). Color codes for DCE-MRI and VSI range from red


Related posts:

Stay updated, free articles. Join our Telegram channel
Full access? Get Clinical Tree
