General Information on Cardiac Computed Tomography
Cardiac computed tomography (CT) has become one of the fast growing areas of cardiovascular imaging since the advent of multidetector scanners in 1998. Early cross-sectional CT imaging of the heart was performed using electron beam CT. Continued advancements in multidetector CT (MDCT) scanners as well as their widespread availability, however, have further increased the utility of cardiac MDCT for evaluation of a variety of cardiovascular diseases.
CT uses rapidly rotating x-ray sources and detectors to create an image. The x-ray sources and detectors are mounted opposite one another on a ring, and the rotating unit is called the gantry. The patient is placed inside the ring, and radiation that is not absorbed by the patient passes into multiple detectors, and, through a process known as filtered back projection, a cross-sectional image is generated (Fig. 5–1). Images are acquired in an axial (transverse) plane in thin sections to yield isotropic voxels, matching that of in-plane spatial resolution. CT angiography (CTA) of the cardiovascular system refers to CT scanning that is performed during the injection of an iodinated contrast agent. Although much information can be obtained from a noncontrast CT, optimal evaluation of cardiac structures, including vascular anatomy, usually requires CTA.
Important aspects of cardiac CT imaging include:
High temporal resolution with electrocardiogram (ECG) synchronization of data acquisition to minimize cardiac motion artifacts
High spatial resolution with isotropic voxels to allow for oblique reconstructions without loss of resolution
Contrast resolution
Radiation dose
Image quality optimization mainly consists of elimination of artifacts related to cardiac motion, respiratory motion, and partial volume effects. Different aspects of CT imaging, including collimation, pitch, breath-hold period, field of view, reconstruction interval, rate and volume of intravenous contrast administration, reconstruction algorithm, and radiation dose, affect overall image quality. Unfortunately, no single set of optimal scan parameters currently suffices for all cardiac CT applications on all CT systems. Instead, CT techniques often reflect a combination of personal or institutional preferences coupled with individual manufacturer capabilities and tailored, to a large extent, to the individual patient’s specific clinical needs.
The gantry design of all MDCT scanners is similar with only minor variations. Single-source systems consist of a single set of x-ray source and detectors, and dual-source systems have two sets of x-ray sources and detectors mounted on the gantry. Detector geometry and postprocessing algorithms are system specific and somewhat dependent on the number of detectors used in the gantry design and number of slices generated, currently anywhere from 4 to 320 slices. Special three-dimensional (3D) back-projection algorithms are used to correct for artifacts that arise from the cone-beam geometry that results from the oblique x-ray projections of thin collimated slices generated from the gantry.1 Thin-slice collimations (0.5-0.625 mm) with reconstructed slice thickness of 0.4 to 0.7 mm allow for near isotropic voxels, which are important for oblique reconstructions. Gantry speed rotations of 280 to 420 ms/360° allow for high temporal resolution in the range of 140 to 210 ms. Further improvements in temporal resolution are obtained with the use of dual-source technology and multisegment postprocessing algorithms, which are important for functional assessment of the heart as well as for improving image quality in patients with fast heart rates.
Normal motion of the heart is a source of significant motion artifact on conventional CT imaging. Because cardiac motion varies throughout the cardiac cycle, often in a predictable manner, synchronization of data acquisition to the heart cycle allows for combination of data acquired from consecutive gantry rotations in volumetric data sets with minimal blurring artifact related to cardiac motion.
The ECG signal is commonly used for synchronization. The time between two consecutive heartbeats is defined by the R-R interval (the interval between consecutive R waves of the ECG; 1000 ms for a heart rate of 60 beats per minute). Depending on the acquisition mode, the R-R interval of the ECG signal is used to either prospectively trigger data acquisition or to retrospectively determine the timing of reconstruction of the image data sets.
With prospective triggering, data acquisition is timed to the ECG R peak after a preselected delay within the following cardiac cycle at a given table position. After table movement, data are again sampled based on the next available R trigger (Fig. 5–2). With retrospective ECG gating, a conventional spiral data set is acquired with simultaneous tracing and recording of the patient’s ECG. Following data acquisition, image data and ECG data are merged to allow for ECG-related image reconstruction after scanning (Fig. 5–3). In contrast to other CT spiral acquisitions, cardiac algorithms usually require a substantially reduced pitch factor (0.2-0.3) in order to allow image reconstruction at any time point of the cardiac cycle. A comparison of these two acquisition techniques is shown in Table 5–1.
| Prospective Triggering | Retrospective Gating | |
|---|---|---|
| Advantages | Pulsed radiation Low radiation exposure | Spiral acquisition Volumetric data set Full coverage of cardiac cycle Variable data reconstruction High reproducibility Allows for dose modulation |
| Disadvantages | Sequential (not volumetric) data acquisition Predefined timing necessary Partial R-R interval covered Irregular heartbeats may cause misregistration | Continuous radiation High radiation exposure |
Temporal resolution is the amount of time needed to acquire the necessary x-ray data in order to reconstruct an image.2 In cardiac MDCT, an image can be generated using half-scan reconstruction algorithms, and hence, temporal resolution for a particular scanner corresponds to the time needed for the gantry to rotate half of a full 360° rotation, or 175 ms with a 350 ms/360° rotation speed. Further improvements in temporal resolution can be achieved with multisector reconstruction algorithms, which are based on merging data of adjacent cardiac cycles (two to four heartbeats) in order to fill a data segment more rapidly (Fig. 5–4). However, with multisector reconstructions, image quality may be degraded due to blurring artifacts related to differences in the position of cardiac structures from cycle to cycle even within the same phase of the cycle. In this regard, multisegment reconstruction is most useful when coupled to gantry rotation and the patient’s heart rate using a computerized algorithm.2,3 Dual-source CT scanners achieve improved temporal resolution (75-83 ms depending on scanner) with simultaneous scanning using two sets of sources and detectors, and similar to single-source scanners, multisector reconstruction algorithms can further improve the temporal resolution.
Spatial resolution is mainly dependent on detector width, slice collimations, and data sampling. Coronary arteries are small, ranging from 1 to 5.5 mm in diameter.4 Nitroglycerin given just prior to scanning is often used to dilate the coronary arteries.5,6 With current generation MDCT scanners, there have been great improvements in spatial resolution, particularly in the z-axis resolution, leading to near isotropic voxels with spatial resolution up to 0.4 × 0.4 × 0.4 mm.7 These advances have greatly enhanced visualization of small structures such as the coronary arteries but still remain inferior to conventional coronary angiography, which has a spatial resolution of 0.2 × 0.2 mm.8
Several considerations are important to be aware of with contrast use in cardiac imaging. First, because image quality is greatly dependent on regularity of the heart rhythm, nonionic contrast is used to prevent perturbations in the heart rate during image acquisition.9 Second, patients with cardiac disease may have low cardiac outputs, and as such, the timing of contrast arrival into the regions of interest can be variable. Hence, it is important to accurately track contrast delivery times individually for each patient. Third, because imaging time is so short in cardiac imaging, contrast osmolarity also becomes an important factor. In particular, when using third-generation scanners with very short imaging times, maximal opacification with greater osmolarity is advantageous. Finally, the physiologic impact of receiving contrast media must be taken into consideration because this can also affect the timing of contrast arrival.
Two types of contrast timing methods have been employed in current MDCT scanning systems. The first involves determining the circulation time by giving a small-volume test bolus (10-20 cc) of contrast and observing the time of its arrival in the heart, also known as a timing run. The second involves imaging a specific region of interest (eg, ascending aorta), and once the contrast density attenuation reaches a prespecified point, image acquisition starts, also known as bolus tracking. Again, exact values are dependent on scanner type, contrast type, amount and delivery method, scan delay time, and individual preference.
Because cardiac MDCT data are acquired with near-isotropic resolution, oblique multiplanar and thin maximum intensity projection reconstructions, including curved reformations, are used, in addition to standard axial two-dimensional (2D) evaluation, for evaluation of the cardiac structures. These oblique reconstructions are particularly important for visualization of the coronary vessels throughout their course in both a longitudinal and axial plane to the vessel of interest for the assessment of atherosclerotic plaque and luminal stenosis (Fig. 5–5). In addition to 2D evaluations, volume- and shaded surface-rendered 3D reconstructions with advanced visualization algorithms allow for the extraction of specific overlying structures such as bones, lung tissue and vessels, and soft tissue structures to focus on cardiac anatomy. These volume-rendered 3D images (Fig. 5–6) are invaluable for understanding complex cardiac anatomy (eg, anomalous coronary arteries) and in surgical planning. Shaded surface displays are commonly used for visualization of internal structures from a specified point simulating an endoscopic or angioscopic view (Fig. 5–7) and can provide important information on the internal relationship of structures, which may be important for guiding procedures (eg, pulmonary vein isolation).
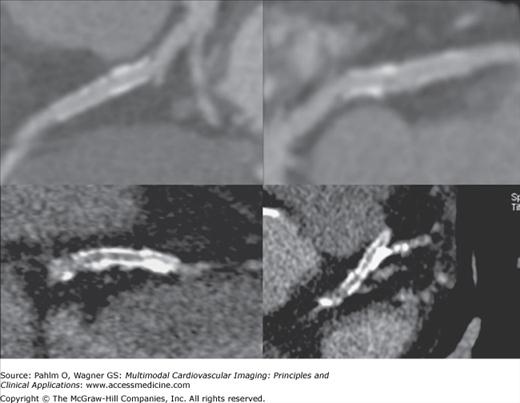
Figure 5–5.
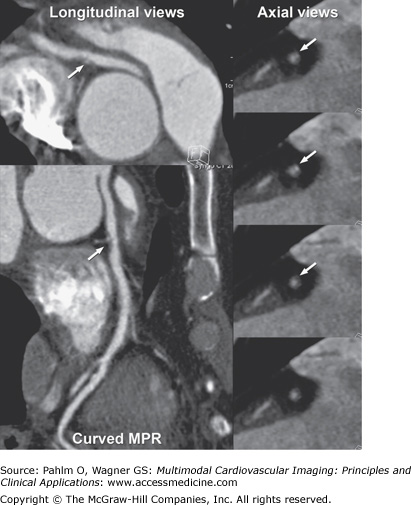
Computed tomography images using multiplanar straight and curved reconstructions demonstrating moderate mixed calcified and noncalcified plaque (arrow) in the right coronary artery demonstrated on both longitudinal and axial views of the vessel of interest. MPR, multiplanar reconstruction.
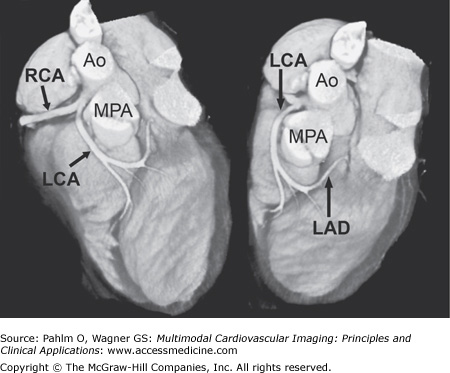
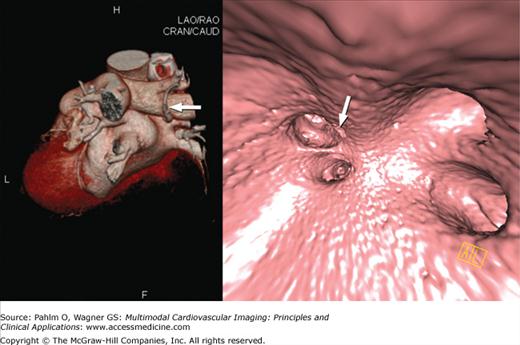
Figure 5–7.
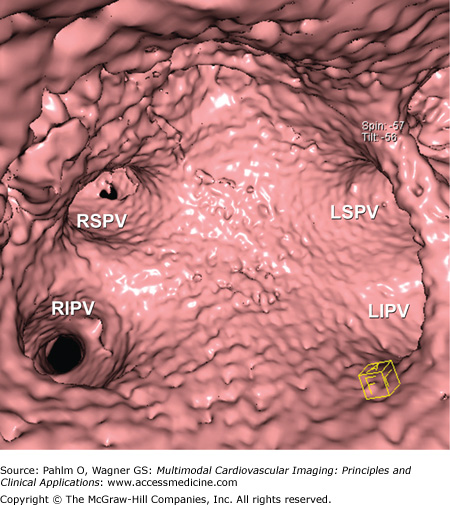
Computed tomography image demonstrates shaded surface–rendered reconstruction of the interior of the left atrium and draining pulmonary veins. LIPV, left inferior pulmonary vein; LSPV, left superior pulmonary vein; RIPV, right inferior pulmonary vein; RSPV, right superior pulmonary vein.
Retrospective ECG gating allows for the reconstruction of volumetric image data sets during multiple phases of the cardiac cycle. Although currently temporal resolution is still limited (75 ms at best), qualitative evaluation of wall motion and valve function can be made. Additionally, precise quantitative calculation of ventricular volumes and ejection fraction can be obtained from the data sets.10-13
Radiation dose exposure is largely dependent on the acquisition protocol used. Typical effective radiation doses for coronary CTA are 5 to 12 mSv, although doses as high as 36 mSv have been reported with some protocols. In comparison, the typical radiation dose for chest CT is 5 to 7 mSv and that of a chest x-ray is <0.1 mSv. Several methods can be used to reduce overall radiation dose. These include minimizing scan length, reducing tube voltage (eg, 100 kVp instead of 120 kVp), using ECG dose modulation schemes in which tube current is lowered during acquisition of nondesired phases, reducing amperage (mA), limiting scan field of view, using step and shoot scanning (eg, prospective gating techniques), and increasing the table speed or pitch.14 The ability to use one or multiple dose-reduction schemes is dependent on multiple factors including patient body habitus, patient heart rate, and CT scanner capabilities.
MDCT represents an important diagnostic imaging modality in the evaluation of patients for cardiac disease. Although MDCT has the ability to provide spectacular 3D information for a variety of diseases, specific technical and clinical aspects must be considered for each individual patient.
Cardiac motion is a significant source of motion artifact for conventional CT imaging. Fast gantry speed CT scanners with resultant high temporal resolution and ECG-gated acquisitions, either prospective or retrospective, are used in cardiac CT imaging to improve image quality by minimizing cardiac motion artifact. Given the limited temporal resolution offered by current MDCT technologies, image quality can also be improved through optimization of the patient’s heart rate. Reconstruction is commonly performed during mid to late diastole, when there is minimal cardiac motion. Diastolic time is approximately two-thirds of the cardiac cycle; however, with increasing heart rate, the proportion of the cardiac cycle spent in diastole decreases.1,15 β-Blockers are often used to both lower the heart rate and promote regularity of the heart rhythm or decrease arrhythmias. Depending on the optimal diastolic time interval desired, oral or intravenous β-blockers have been shown to be safe when administered to patients prior to CT scanning.15-17 In patients unable to tolerate β-blockers (eg, severe asthmatics), calcium channel blockers may provide a similar benefit.
Respiratory motion is another potential source of motion artifact that can degrade image quality on CT imaging. The use of multidetector scanners with wide coverage and minimizing scan length are methods that can decrease overall scan acquisition time and hence the amount of time required for the patient to breath-hold. Thus, for coronary imaging, scan acquisition coverage is limited to the heart. By contrast, for evaluation of a patient with bypass grafts, coverage needs to be increased to include any aortocoronary bypass grafts. This necessitates increased scan acquisition time and hence increased breath-hold time. It is important to instruct the patient prior to image acquisition on the importance of breath-holding during scan acquisition. For patients unable to breath-hold the requisite amount of time needed for scan acquisition, methods to reduce scan acquisition time or use of alternative imaging techniques should be considered.
Many cardiac CT imaging applications require the concomitant administration of intravenous iodinated contrast to improve visualization and distinction of the cardiac structures. For cardiac CT imaging, regularity of the heart rate and rhythm throughout image acquisition is important in order to optimize image quality, and potential changes in heart rate and rhythm may occur with administration of intravenous contrast. Care should be taken to screen patients with potential contraindications to contrast use, including a history of prior reaction to iodinated contrast and/or known renal insufficiency.
Image quality is important for diagnosis. Spatial resolution, temporal resolution, and contrast resolution are all important aspects for image quality related to CT scanners and protocol design. However, several patient-specific parameters, including body habitus, heart rate and rhythm, respiratory status, and cardiac structure being imaged, are also important aspects for diagnostic image quality. Patients with high body mass index often require a high tube current in order to produce diagnostic quality images with low image noise. Depending on the CT scanner, different methods may be used to achieve diagnostic image quality while minimizing overall radiation dose. As mentioned earlier, heart rate can be optimized for cardiac CT imaging by the administration of β-blockers to increase diastolic time. Patients with irregular heart rhythms may also benefit from β-blocker administration to regularize the heart rate (eg, suppress premature contractions). However, these drugs may be of no benefit in a patient with irregularly irregular rhythm, as in atrial fibrillation. Finally, it is important to note that although higher specifications and restrictions on these patient-specific parameters may be necessary for imaging small mobile structures such as the coronary arteries, these restrictions may not be so stringent when imaging other larger cardiac structures such as the pulmonary veins or pericardium.
Standard Applications for Cardiac Computed Tomography
Goals in the assessment of coronary artery disease include identification of coronary plaques and flow-limiting coronary stenoses, measurement of atherosclerotic burden, and characterization of plaque components.18 Identification and quantification of calcified plaques can be performed using a noncontrast CT study. Further information on atherosclerotic burden, presence of noncalcified or mixed plaques, and assessment for stenoses requires a contrast CT study.
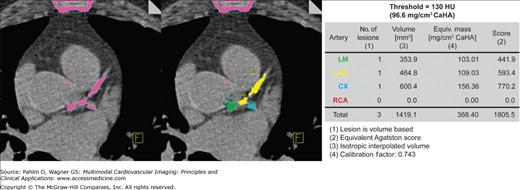
Atherosclerotic coronary calcifications are often found in patients with long-standing coronary atherosclerosis. Elevated levels of coronary calcification have been shown to correspond to increased risk of myocardial events.19-22 Current clinical indications for quantification of coronary calcium are in patients with atypical chest pain, as well as asymptomatic patients with traditional cardiovascular risk factors.23 Noncontrast CT is currently the only method available to accurately quantify the coronary calcium plaque burden. Coronary artery calcium is assessed through the measurement of the number of pixels in the CT image with a density ≥130 Hounsfield units (HU) to calculate a total calcium score,24 a calcium volumetric score,25 or an absolute calcium mass26 (Fig. 5–8). Each method has shown similar reproducibility,27-29 and most software processing programs can easily provide all three scores simultaneously. A high coronary calcium score is a sensitive but nonspecific marker for obstructive coronary artery disease (CAD), and changes in the calcium score have not been shown to correspond to changes in cardiovascular event risk.23
Noncalcified atherosclerotic plaques in the coronary arteries can be visualized using contrast-enhanced CT. The high spatial resolution and soft tissue delineation can provide information about the content of atherosclerotic plaques and coronary artery wall,30 including distinction between low-density lipid-rich (47 ± 9 HU) versus higher density fibrous (104 ± 28 HU) plaques.31,32 Several studies have demonstrated the high sensitivity (72%-99%) and specificity (86%-97%) and particularly the high negative predictive value (97%-100%) of MDCT when compared against the gold standards of x-ray coronary angiography and intravascular ultrasound for the detection of significant CAD.33-39 More importantly, with increasing number of detectors and faster gantry speeds leading to an improvement in image resolution, there has been a significant increase in the number of evaluable segments compared with early-generation scanners. The presence of coarse calcifications with related blooming and streak artifact, however, still remains problematic in regard to accurate interpretation of degree of luminal narrowing.
Anomalies of the coronary arteries affect approximately 1% of the population, with 87% of these individuals having anomalies of the origin and distribution and 13% having coronary artery fistulae.40,41 The true incidence of ectopic origin of the coronary arteries from the aorta in the population is unknown but estimated to be between 0.17% and 0.6%. Cardiac catheteri-zation has traditionally been the preferred imaging modality for characterization of coronary artery anomalies. However, given the complex 3D nature of these anomalies, not infrequently, conventional angiography incompletely delineates the anatomic origin and course of the coronary artery. CTA of the coronary arteries has therefore become one of the accepted standards for complete evaluation of coronary artery anomalies. With the high spatial resolution, volumetric acquisition, and orientation in any plane, CT can accurately depict the origin and course of coronary artery anomalies with high sensitivity, although specificity is reduced in patients with high heart rates due to the limited temporal resolution even with cardiac gating.42,43
With the growth of nonsurgical revascularization techniques, there has been an enormous increase in the number of patients with CAD who receive coronary artery stents.44,45 Hence, early identification of in-stent restenosis is important in the management of these patients. MDCT has shown variable success for evaluation of in-stent restenosis with steady improvements noted when using newer 64-slice systems offering improvement in spatial resolution, particularly when using dedicated reconstruction kernels.45-53 However, there is still high variability of stent lumen visibility depending on the stent type, size, orientation, and surrounding tissue (Fig. 5–9). Sharp reconstruction kernels, in addition to the routine medium kernels, may provide improvement in visible lumen diameter as well as more realistic intraluminal attenuation values.44,45
Surgical revascularization of CAD is accomplished by coronary artery bypass grafting in which a graft (arterial or venous) is used to bypass an occluded or stenosed coronary artery. Compared with the native coronary arteries, reversed saphenous vein and internal mammary artery grafts are easier to visualize due to the reduced overall motion, larger lumen, and less convoluted course. Familiarity with the common types of grafts used and placement can aid in both planning and interpretation of images (Fig. 5–10). Venous conduits are generally wider and longer than their arterial counterparts but have reduced long-term patency.
Figure 5–10.
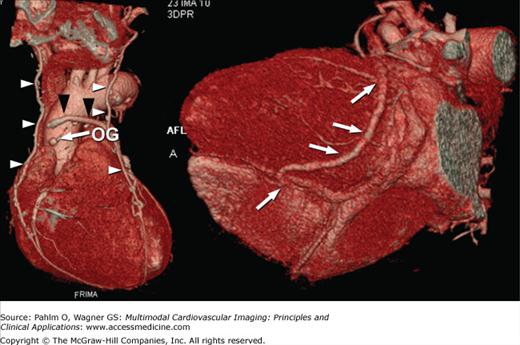
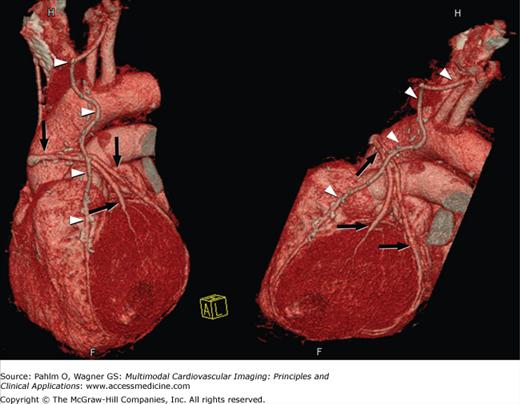
Volume-rendered computed tomography images demonstrating different bypass graft types including free saphenous vein grafts (black arrowheads), in situ internal mammary artery grafts (white arrowheads), sequential bypass grafts (white arrows), and “Y” or “T” grafts (black arrows). OG, occluded graft.
With the MDCT technique, special considerations must be taken into account during data acquisition. Because most patients have an in situ mammary artery graft, image acquisition must cover the entire thorax in order to visualize the proximal anastomosis and origin of the internal mammary arteries. Given the larger volume of coverage, adjustments in contrast dose and scan delay timing after contrast administration should be made to ensure adequate contrast enhancement of the bypass grafts and native coronary artery vessels during image acquisition. MDCT has been shown to have high sensitivity (97%-100%) and specificity (98%) for diagnosing graft occlusion, although somewhat lower sensitivity (75%-82%) and specificity (88%-92%) for detecting significant stenoses.54,55
There has been an increase in the number of interventional procedures performed for the treatment of atrial arrhythmias. In particular, atrial fibrillation, which affects approximately 2 million people in the United States,56 can now be treated using an ablation technique, often pulmonary vein isolation. Imaging evaluation of the left atrial anatomy and pulmonary venous anatomy can aid the eletrophysiologist in preprocedural planning and can be used to asses for postprocedural complications. Three-dimensional visualization of the left atrium and pulmonary venous anatomy is often used to guide the electrophysiologist in navigating the left atrial cavity during catheter ablation.
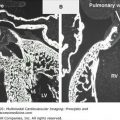
The location, size, and number of pulmonary veins need to be defined. Ostial branches, which are venous branches noted within 5 mm of the atriopulmonary venous junction, are also important to note. Commonly, there are four pulmonary veins with separate ostia into the left atrium. Knowledge of aberrant pulmonary veins (Fig. 5–11) such as accessory or conjoined veins and incidental left atrial diverticula can help guide procedures to ensure isolation of the electrical potentials arising from all the pulmonary veins and avoid potential complications from attempts to enter atrial diverticula. Diagnosis of the presence of left atrial thrombus, especially prevalent in the left atrial appendage, is important to prevent iatrogenic systemic embolism (Fig. 5–12).
Postprocedural complications of radiofrequency ablation include endocardial scarring (Fig. 5–13), pulmonary vein dissection, and perforation.57 Small pleural or pericardial effusions, small atrial septal defects, and pulmonary venous stenosis are also potential complications. Serious complications include stroke, hemopericardium, hemothorax, pulmonary vein thrombosis, and hemodynamically significant pulmonary vein stenosis, which can result in pulmonary veno-occlusive disease including focal pulmonary edema.58 Pulmonary vein stenosis may develop up to 8 months after the procedure. Current ablation techniques, however, have greatly diminished the complication rate of pulmonary venous stenosis.
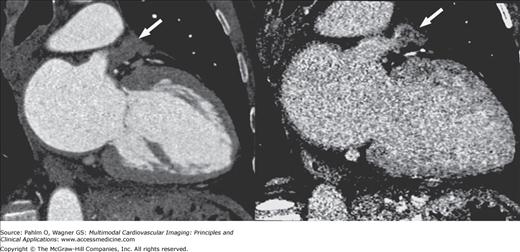
Figure 5–13.
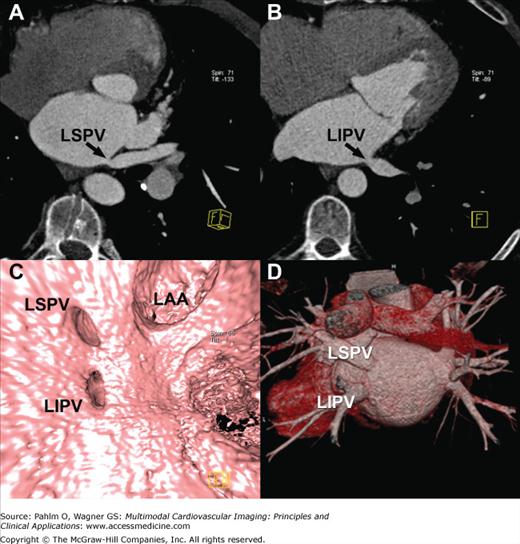
Multiplanar reformatted computed tomography images demonstrating significant stenosis of the left superior (A) and left inferior (B) pulmonary vein ostia. Three-dimensional shaded surface endoluminal view (C) and volume-rendered (D) images demonstrate the anatomy. LAA, left atrial appendage; LIPV, left inferior pulmonary vein; LSPV, left superior pulmonary vein.
Imaging of the left atrial and pulmonary venous anatomy can be performed with CT or magnetic resonance imaging (MRI). CTA imaging can be performed as a gated or nongated study and should encompass the area from the aortic arch through the apex of the heart during a single breath-hold.59 Postprocessing of the image data sets, including 2D multiplanar reconstructions of the pulmonary venous ostia and atrial appendage, and 3D volume-rendered and shaded surface displays demonstrate the complex anatomy. Depending on the software vendor, volumetric CT data sets acquired through the left atrium can be synchronized and fused with electrical mapping systems in the electrophysiology laboratory (Fig. 5–14).
Figure 5–14.
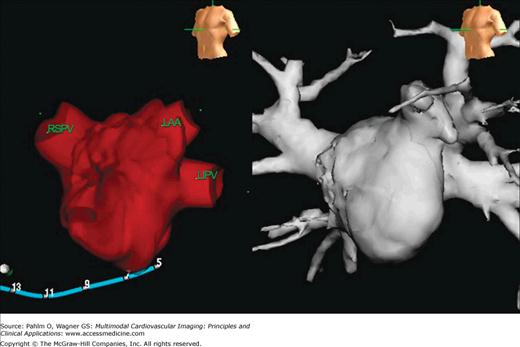
Synchronization of electrical voltage 3D map (left) and corresponding 3D volume-rendered computed tomography image (right) of the left atrium used for guiding electrophysiology intervention. LAA, left atrial appendage; LIPV, left inferior pulmonary vein; RSPV, right superior pulmonary vein.
Over the past five decades, the number of adults with congenital heart disease has grown due to the advances in cardiac surgery, intensive care, and noninvasive diagnosis.60 Approximately 85% of infants with cardiovascular anomalies can be expected to survive into adulthood, and with further advancements in surgical techniques, this number may continue to grow.61 Although surgical correction of an anomaly may reestablish a relatively normal pattern of blood flow, these adult survivors still remain at significant risk for developing complications from their operative procedures or from lingering effects of the original anomaly. Hence, these patients need to be followed closely regardless of their stage of treatment. As such, comprehensive imaging evaluation of the cardiovascular anatomy, flow, and function is important in the management of these patients. Cardiac MDCT with its fast acquisition times and capacity to obtain volumetric 3D information with high spatial resolution has often been used in the anatomic evaluation of congenital heart disease (Fig. 5–15). Advantages of CT compared with other imaging modalities such as cardiac MRI include short examination, fewer requirements for sedation, simultaneous evaluation of airways and lung parenchyma, and high spatial resolution. Disadvantages include radiation exposure, use of iodinated contrast, and lack of hemodynamic information.
Figure 5–15.
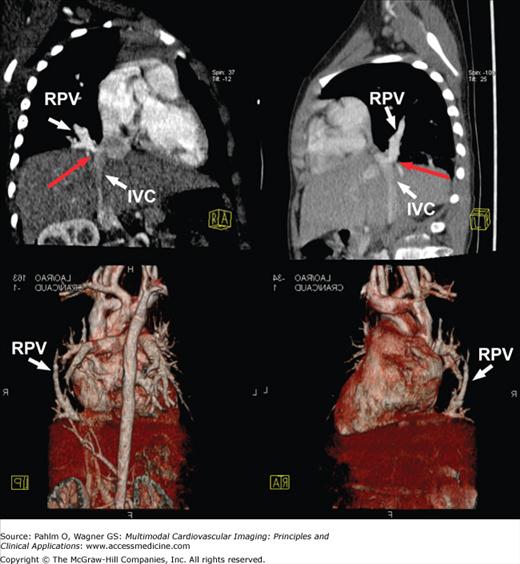
Multiplanar reformatted (top row) and three-dimensional volume-rendered (bottom row) computed tomography images demonstrating partial anomalous pulmonary venous return of the right-sided pulmonary veins (RPV) into the subdiaphragmatic inferior vena cava (IVC) with some narrowing noted at the ostium (red arrow).
CT imaging protocol is dependent on the structure of interest and information needed. For patients with abnormalities in the vascular system, image acquisition is usually started a few centimeters above the aortic arch and continued to the diaphragm. Because congenital heart disease often involves abnormalities in both the right and left heart chambers, the timing of data acquisition is set such that there is optimal contrast enhancement seen in both sides of the heart. In cases with intracardiac shunting, imaging can be performed early (within 5 seconds of contrast administration) and late (approximately 30 seconds after contrast administration) in order to determine the degree and direction of shunting.62 Images can be evaluated using multiplanar reconstructions, maximum intensity projections and 3D volume rendered image sets. Data can also be reconstructed in multiple phases through the cardiac cycle for calculation of cardiac volumes and function.
Diseases of the pericardium encompass a spectrum of disorders including congenital malformations and infection-related, infarction-related, metabolic, autoimmune, traumatic, neoplastic, and idiopathic disorders. Depending on the disease process, clinical manifestations of pericardial involvement can vary. Suspected pericardial disease is usually initially evaluated with echocardiography. However, CT imaging can also provide additional valuable information.
CT imaging has been widely accepted for the evaluation of structural changes in the pericardium. The best quality images in the evaluation of pericardial disease are obtained with the use of cardiac gating and fast imaging to minimize motion blurring, although more prominent pericardial disease findings may be evident even on conventional studies performed for other indications. On CT, the pericardium is usually well delineated from the adjacent low-attenuation fat. Anatomic features of pericardial disease such as pericardial thickening, pericardial calcification, and pericardial effusion or masses are easily detected and evaluated with CT. Limited tissue characterization of pericardial fluid/masses can make it difficult to differentiate thickened pericardium from an exudative pericardial effusion with high protein content. Functional and hemodynamic information is also limited with CT. However, CT is the most sensitive technique for detection of pericardial calcification.
The CT appearance of pericardial effusion is often not very specific for a particular etiology, and further evaluation is usually necessary to help narrow the range of differential possibilities. CT attenuation measurements can provide initial characterization of pericardial fluid. On CT, simple effusions have attenuation similar to that of water. In contrast, more proteinaceous fluid (exudates or inspissated fluid collections) will have attenuation greater than water on CT.63 CT characteristics of malignant effusions may be similar to hemorrhagic effusions, depending on blood content, and are often associated with an irregularly thickened pericardium or pericardial nodularity. In addition, because of the wide field of view, associated abnormalities of the mediastinum and lungs may also be detected during the examination.64
Acute pericarditis may or may not be accompanied by pericardial effusion and some degree of myocarditis depending on etiology. Clinical symptoms and serologic markers of inflammation can often support the diagnosis. CT imaging can be used to aid in the diagnosis, especially when other tests prove inconclusive. Structural changes of the pericardium such as thickening, inflammation, pericardial effusion, and associated myocarditis or other concomitant heart disease and mediastinal pathology can be demonstrated.
Chronic inflammation of the pericardium can lead to constrictive pericarditis, which is characterized by impaired ventricular filling. The process may extend to involve the underlying myocardium, resulting in reduced ventricular function. The etiology of constrictive pericardial disease has often been attributed to antecedent acute pericarditis due to infectious, inflammatory, or idiopathic causes. However, other etiologies such as neoplastic diseases, postradiation therapy, postcardiac surgery, and remote nonpenetrating or penetrating cardiac trauma have been frequently seen. Accurate diagnosis and differentiation from restrictive cardiomyopathy are important because curative treatment for constrictive pericarditis is possible with surgical pericardiectomy. Initial diagnostic workup usually includes 2D, Doppler, and tissue Doppler echocardiography with analysis of respiratory changes associated or not with changes of preload. However, equivocal findings may be present in up to one-third of patients with possible pericardial constriction, and further testing is usually required.
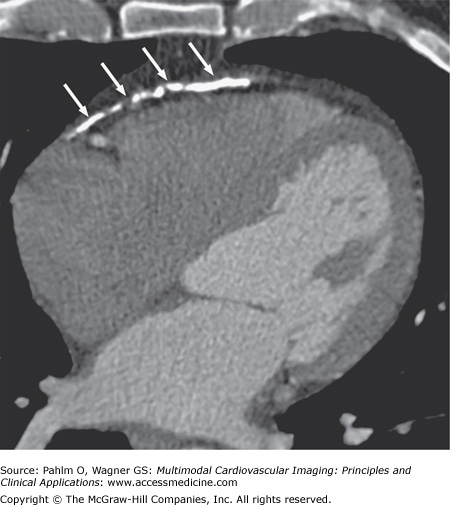
Direct visualization of the pericardium can be performed with CT for measurement of pericardial thickness. However, the finding of a thickened pericardium is not necessarily confirmatory of constrictive pericarditis. In addition, up to 20% of patients with constrictive pericarditis may present with normal-thickness pericardium on current imaging methods.65 CT can also demonstrate characteristic anatomic features for constrictive pericarditis including a conical or tubular diastolic ventricular shape, an associated pericardial effusion, pericardial calcification (Fig. 5–16), and secondary sequelae including dilated atria, hepatic veins, and pulmonary veins, which can further support the diagnosis of constrictive pericarditis.
Figure 5–16.
Related posts:


Stay updated, free articles. Join our Telegram channel

Full access? Get Clinical Tree


