Cardiac Imaging in Acquired Diseases
David K. Shelton
Gary Caputo
Cardiac disease remains among the most common problems affecting patient morbidity and mortality today, despite many important dietary, pharmaceutical, interventional, and surgical advances. Most acquired cardiac diseases can be classified under six general categories: ischemic heart disease, cardiomyopathies, pulmonary vascular disease, acquired valvular disease, cardiac masses, and pericardial disease. Use of plain film, fluoroscopy, US, CT, MR, nuclear imaging, and angiocardiography must be integrated with the knowledge of specific disease processes.
Ischemic Heart Disease
Coronary Artery Disease
Coronary artery disease is the most common cause of mortality in the United States, with approximately one American dying every minute. Six million to seven million Americans have active symptoms related to ischemic heart disease. Approximately 300,000 coronary artery bypass graft (CABG) surgeries are performed per year in the United States, with a similar number of percutaneous transluminal coronary angioplasties (PTCAs). There were 1.83 million cardiac catheterizations in the United States in 1999, and it has been estimated to reach 3 million by 2010.
Clinical presentations include (1) stable angina, (2) unstable angina (often preinfarction), (3) acute myocardial infarction, (4) congestive heart failure secondary to chronic ischemia or prior infarction sequelae, (5) arrhythmias, and (6) sudden death. Clinical symptoms are caused by luminal abnormalities of the coronary arteries including (1) atheromatous disease, (2) coronary thrombosis, (3) intraluminal ulceration and hemorrhage, (4) vasoconstriction, and (5) coronary ectasia and aneurysm. Vulnerable plaque is initiated by lipoprotein deposition into susceptible areas of the coronary walls and other arteries. Chronic inflammation elsewhere in the body, as well as in this developing plaque, is associated with cytokine and macrophage activity. A thin fibrous cap develops over the lipid core, and mechanical stress can lead to the exposure of the blood products which can then trigger the thrombotic cascade. Vulnerable plaque development, sudden rupture, and thrombosis are now known to be the leading cause of myocardial infarction.
Risk factors for the development of atherosclerotic coronary artery disease include elevated serum cholesterol and C-reactive protein, tobacco smoking, diabetes, hypertension, sedentary lifestyle, obesity, age, male gender, chronic inflammation, and heredity. Aggravating conditions include aortic stenosis ventricular hypertrophy, cardiomyopathy, coronary embolism, congenital anomalies, Kawasaki syndrome, and anemia. Noninvasive imaging is often used as a screening test. Selective coronary angiography with ventriculography and now CT coronary angiography can be utilized to determine coronary anatomy and to direct the specific therapy.
A typical imaging workup includes chest radiography, nuclear medicine myocardial perfusion scans, and consideration for coronary angiography. Indications for coronary angiography include angina refractory to medical therapy, unstable angina, high-risk occupation such as pilot, and abnormal electrocardiograms or stress perfusion tests. Coronary angiography is considered following myocardial infarction when PTCA or intracoronary thrombolysis is being deliberated. Additional indications include development of mechanical dysfunction, progressive congestive failure, refractory ventricular arrhythmias, and follow-up of IV thrombolytic agents.
Coronary artery calcification occurs in the intima and is directly related to advanced atheromatous disease and coronary narrowing (Fig. 22.1). Coronary calcification is detected at angiography in 75% of patients with 50% diameter stenosis. Only 11% of men without significant coronary artery disease have coronary calcification. In the asymptomatic population, the detection of coronary calcification has a predictive accuracy of 86%. In symptomatic patients, coronary calcification is seen in 50% of patients with single-vessel disease, 77% of those with two-vessel disease, and 86% of those with three-vessel disease. Fluoroscopically detected coronary calcification in the presence of angina-like chest pain is associated with coronary stenosis 94% of the time. Overall, fluoroscopic detection of coronary artery calcification has a 73% sensitivity and 84% specificity for symptomatic patients. Exercise tolerance testing has a sensitivity of 76% to 88% and a specificity of 43% to 77%. Exercise testing with planar thallium imaging has a sensitivity and a specificity of approximately 85%.
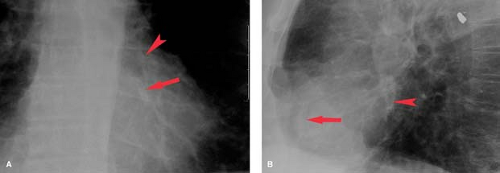 Figure 22.1. Coronary Artery Calcification—CXR. Frontal (A) and lateral (B) chest radiographs show atherosclerotic calcification in the left anterior descending (arrows) and left circumflex (arrowheads) coronary arteries. The patient had a retained bullet from a war wound in his chest. |
Use of electron-beam CT (EBCT) and MDCT has improved the sensitivity for detecting coronary artery calcification to approximately 95% (Fig. 22.2). Importantly, CT also allows the grading of the severity of coronary calcification and thus can establish scores and risk scores which can help risk stratify the patient and allow follow-up after medical intervention. The absence of coronary calcification is associated with a very low risk of significant coronary disease. On the other hand, the younger the patient and the higher the calcification score implies the higher associated risk of underlying coronary artery disease and future cardiac events. The negative predictive value of a zero calcification score is 94% to 100%. For a summed coronary score or Agatston score (see Fig. 21.38): 0 to 10 is very low to low risk, 11 to 100 is moderate, 101 to 400 is moderately high, and greater than 400 is high risk for underlying stenosis and future cardiac events. With scores greater than 400, there is a sensitivity of 82% and a specificity of 62% for predicting an abnormal myocardial perfusion SPECT scan (Table 22.1).
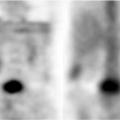
Myocardial perfusion scanning, using thallium, Tc-99m-sestamibi, Tc-99m-tetrofosmin, or Tc-99m-teboroxime, is one of the primary imaging modalities for detecting myocardial ischemia. Stress images are obtained with exercise or pharmacologic agents such as adenosine dipyridamole. SPECT has increased the sensitivity of 90% to 94% and a specificity of 90% to 95%. The hallmark for segmental ischemia is a perfusion defect on stress testing that fills in during rest examination (Fig. 22.3). A defect that appears stable during both stress and rest examinations is usually an infarction. “Hibernating” regions of viable myocardium associated with tight coronary stenosis may appear as fixed defects on sestamibi or tetrofosmin images or on redistribution thallium images obtained 4 hours after stress.
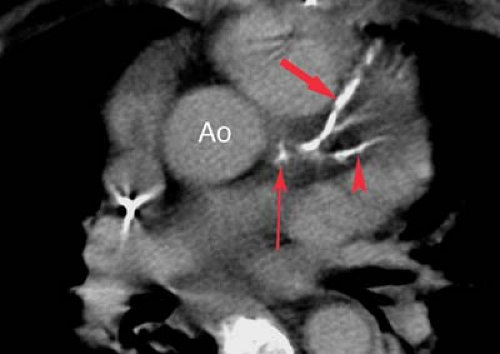 Figure 22.2. CT Coronary Calcification. MDCT of the thorax reveals calcification of the left main (skinny arrow), left anterior descending (fat arrow), and diagonal branch (arrowhead) coronary arteries. Detection and reporting of coronary artery calcification even on nongated noncoronary chest CT may lead to the opportunity to treat potentially serious heart disease before a myocardial infarction occurs. Ao, root of the aorta. |
Stress echocardiography using either exercise or pharmacologic stress modalities has also become a widely accepted method to detect significant (>50% to 70%) coronary artery stenosis. With the advent of digital image acquisition and cine-loop playback, prestress echocardiographic views can be
simultaneously compared with views taken either immediately postexercise or at peak pharmacologic doses. Development of new segmental wall motion abnormalities or worsening of resting abnormalities suggests stress-induced ischemia. One advantage of these techniques is that they also allow prior assessment of resting wall motion abnormalities that are consistent with either profoundly ischemic, stunned, hibernating, or infarcted myocardium.
simultaneously compared with views taken either immediately postexercise or at peak pharmacologic doses. Development of new segmental wall motion abnormalities or worsening of resting abnormalities suggests stress-induced ischemia. One advantage of these techniques is that they also allow prior assessment of resting wall motion abnormalities that are consistent with either profoundly ischemic, stunned, hibernating, or infarcted myocardium.
Table 22.1 Coronary Calcium Scoring | ||||||||||||||
|---|---|---|---|---|---|---|---|---|---|---|---|---|---|---|
| ||||||||||||||
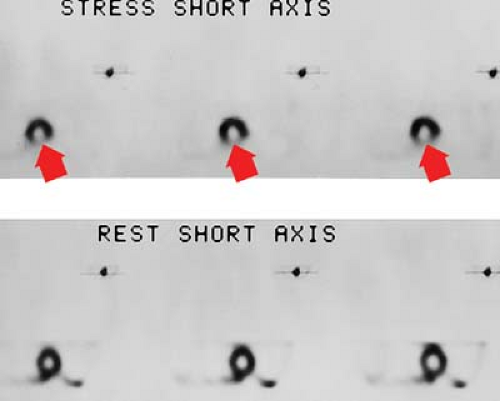 Figure 22.3. Myocardial Perfusion Scan—Scintigraphy. SPECT images of the left ventricle in short-axis projection demonstrate a defect (arrows) in the inferior wall of the left ventricle during stress, which is well perfused on the rest images. This is strong evidence of ischemic heart disease utilizing Tc-99m-sestamibi as the radionuclide and pharmacologic stress testing with dipyridamole. |
The overall sensitivity of exercise echocardiography is 76% to 97% using pharmacologic stress agents; the sensitivity is 72% to 96% with dobutamine, approximately 85% with adenosine, and 52% to 56% with standard dose dipyridamole. The sensitivities for these tests are lowest for single-vessel disease and improve incrementally for two- and three-vessel disease. Stress echocardiography has a specificity of 66% to 100%.
Gated blood pool scintigraphy will demonstrate exercise-induced wall motion abnormalities in 63% of patients with significant coronary artery disease. With exercise, the ejection fractions normally increase by at least 5%. Failure of ejection fraction to increase with exercise is an indication of myocardial dysfunction. Using these two findings, exercise-gated blood pool scintigraphy has a sensitivity of 87% to 95% and a specificity of 92% for coronary artery disease.
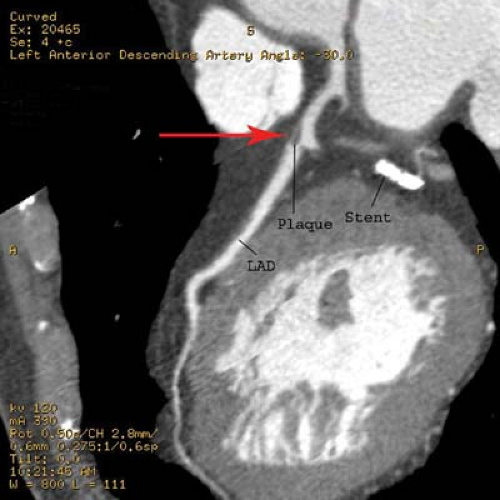 Figure 22.4. CT Coronary Angiogram of Left Anterior Descending. Left anterior oblique view of maximum intensity projection from MDCT, CT coronary angiogram demonstrates focal soft plaque in the proximal left anterior descending (LAD) coronary artery causing 70% stenosis. Percutaneous transluminal angioplasty was subsequently performed. |
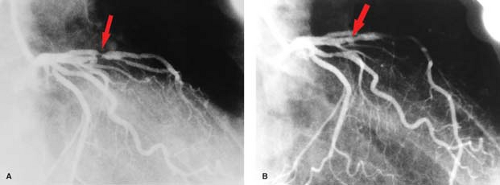 Figure 22.5. Coronary Stenosis—Conventional Angiogram. A. An 80% stenotic lesion (arrow) is identified in the left anterior descending artery (LAD) on conventional coronary angiography. The patient was experiencing classic angina. B. Marked improvement in the LAD lesion (arrow) is evident following percutaneous transluminal angioplasty. The angina symptoms resolved. |
Coronary angiograms and CT coronary angiograms (Fig. 22.4) should be evaluated for the percent of stenosis, the number of vessels involved, focal versus diffuse disease, coronary anatomy, ectasia or aneurysm, coronary calcification, and collateral flow (Fig. 22.5). Collaterals may include epicardial, intramyocardial, atrioventricular, intercoronary, or intracoronary vessels (i.e., “bridging collateral”). The angiographer must count the number of major epicardial vessels with
greater than 50% diameter narrowing. Patients are divided into one-vessel, two-vessel, or three-vessel disease on the basis of involvement of the right or left main coronary artery, left anterior descending (LAD) artery, and left circumflex artery. A 50% diameter narrowing roughly predicts a 75% cross-sectional area reduction, which is the physiologic point at which flow is restricted enough to result in ischemia under stress conditions. Reliability for estimating the percent diameter narrowing depends on the observer, projection, resolution, and presence of coronary calcification or ectasia. The degree of coronary disease may be assessed using percent stenosis of each individual coronary artery or of 5-mm segments of the coronary arteries. The right coronary artery is 10-cm long, the left main coronary artery is 1-cm long, the LAD is 10-cm long, and the left circumflex is 6-cm long for a total of 27 cm. These may be divided into fifty-four 5-mm segments. This scoring system allows the interpreter to quantify the number of 5-mm segments with stenoses in the 0% to 25%, 25% to 50%, 50% to 75%, and 75% to 100% ranges. The significance of 30% to 70% lesions is often clarified by correlation with stress-induced myocardial perfusion scintigraphy.
greater than 50% diameter narrowing. Patients are divided into one-vessel, two-vessel, or three-vessel disease on the basis of involvement of the right or left main coronary artery, left anterior descending (LAD) artery, and left circumflex artery. A 50% diameter narrowing roughly predicts a 75% cross-sectional area reduction, which is the physiologic point at which flow is restricted enough to result in ischemia under stress conditions. Reliability for estimating the percent diameter narrowing depends on the observer, projection, resolution, and presence of coronary calcification or ectasia. The degree of coronary disease may be assessed using percent stenosis of each individual coronary artery or of 5-mm segments of the coronary arteries. The right coronary artery is 10-cm long, the left main coronary artery is 1-cm long, the LAD is 10-cm long, and the left circumflex is 6-cm long for a total of 27 cm. These may be divided into fifty-four 5-mm segments. This scoring system allows the interpreter to quantify the number of 5-mm segments with stenoses in the 0% to 25%, 25% to 50%, 50% to 75%, and 75% to 100% ranges. The significance of 30% to 70% lesions is often clarified by correlation with stress-induced myocardial perfusion scintigraphy.
Percutaneous transluminal angioplasty has traditionally been reserved for localized lesions in one- or two-vessel disease (Fig. 22.5), but recent published series comparing PTCA with CABG in multivessel disease reveals no difference in the endpoints of death and myocardial infarction. The PTCA group, however, requires a significantly higher number of repeat procedures during follow-up, although this has improved with more frequent use of stents. CABG, with the use of saphenous vein grafts or internal mammary arteries, is usually reserved for more complex or longer-segment disease. CABG markers are usually placed at the anastomotic site to help the angiographer during future selective angiography. Use of the internal mammary artery has better long-term results than saphenous vein grafts and has been correlated with increased survival. Recurrence of symptoms after CABG may be because of occlusion, graft stenosis, or progression of native vessel disease. Graft stenoses and acute occlusions may be amenable to percutaneous interventional techniques. Grafts and occasionally stents can be noninvasively evaluated with CTCA (Fig. 22.6), although metallic stents can cause imaging problems.
Echocardiography is useful in detecting some of the long-term complications of ischemic disease, including ventricular aneurysm, thinning of myocardium, akinesia, or dyskinesia. Aneurysms are best seen at the apex and septum. Mural thrombi may also be diagnosed but are difficult to visualize at the apex. Stress echocardiography with either exercise or pharmacologic stress techniques is increasingly used to evaluate for ischemia.
CT coronary angiography is capable of establishing the patency of CABGs. Ultrafast CT (EBCT) and now MDCT has a 93% sensitivity, 89% specificity, and 92% accuracy for establishing patency of the CABG grafts. EBCT and MDCT have also shown to be extremely sensitive for detecting coronary calcification. EBCT and MDCT with contrast can also evaluate wall motion, thrombi, old infarcts, aneurysm, and pericardial abnormalities.
MR can be used (1) to define the location and size of previous myocardial infarctions, (2) to demonstrate complications of previous infarctions, (3) to establish the presence of viable myocardium for possible revascularization, (4) to differentiate acute versus chronic myocardial infarction, (5) to evaluate regional myocardial wall motion and systolic wall thickening (Fig. 22.7), (6) to demonstrate global myocardial function with right ventricular and left ventricular ejection fractions, (7) to evaluate papillary muscle and valvular abnormalities, and (8) to evaluate regional myocardial perfusion (Fig. 22.8). Gadolinium-enhanced T1WI demonstrate areas of ischemia and reperfusion after myocardial infarction. MR with spectroscopy targeting myocardial phosphate metabolism can distinguish acute from chronic ischemia and reperfused, infarcted myocardium from reperfused, viable myocardium. With spin-echo imaging, MR has a 78% accuracy for establishing the patency of CABGs. Cine MR with gradient echo has a sensitivity of 88% to 93%, a specificity of 86% to 100%, and an overall accuracy of 89% to 91% for patency of CABGs. Similar to
dobutamine stress echocardiography, dobutamine stress cardiac MR can also be accomplished (Fig. 22.9).
dobutamine stress echocardiography, dobutamine stress cardiac MR can also be accomplished (Fig. 22.9).
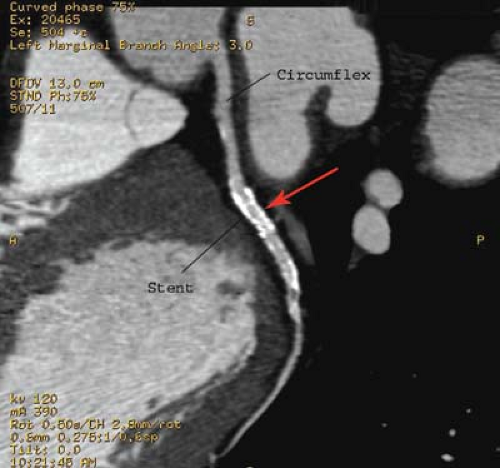 Figure 22.6. CT Coronary Angiogram (CTCA) of Left Circumflex. Left anterior oblique projection from MDCT. CTCA maximum intensity projection shows patent coronary stent (arrow) with good flow and no evidence of obstruction. Coronary calcification is also evident downstream. Metallic stents and dense calcification are often problematic because of the artifacts they may cause. |
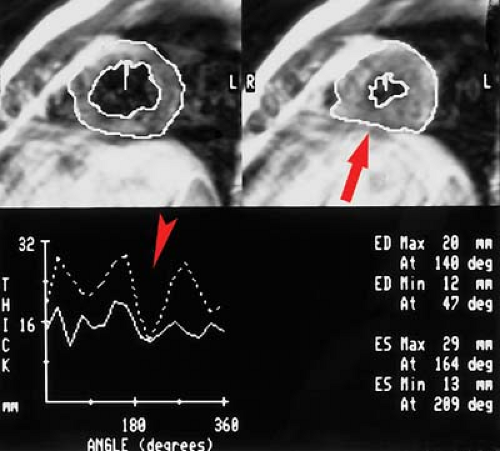 Figure 22.7. Wall Motion Evaluation—MR. Short-axis tomographic views of the LV are used for evaluation of systolic wall thickening. Regions of interest are drawn around the myocardium in diastole (left) and systole (right). The inferior wall (arrow) demonstrates hypokinesia and poor systolic wall thickening. The functional graph (below) confirms the findings (arrowhead). The patient had a previous inferior wall myocardial infarction. |
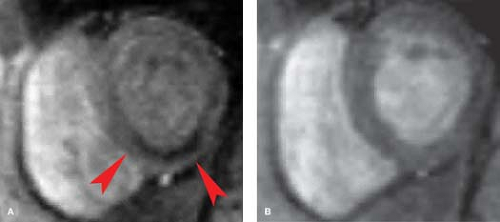 Figure 22.8. First-Pass Perfusion—MR. First-pass gadolinium-enhanced hybrid gradient-echo/echo planar perfusion images in a basal short-axis plane following adenosine stress (A) and at rest (B) demonstrate a reversible perfusion defect in the inferior wall (5:00 to 7:00 in the image) (arrowheads). The patient was later shown to have a 99% distal right coronary artery stenosis at cardiac catheterization. |
Myocardial Infarction
After acute infarction, the chest radiograph will initially show a normal heart size in 90% of cases. Cardiomegaly and congestive failure will eventually develop in 60% to 70%, more frequently with anterior wall infarction, multivessel disease, or left ventricular aneurysm. Increasing stages of pulmonary venous hypertension, particularly alveolar edema, are associated with worsened prognosis.
Complications of myocardial infarction include the following:
Cardiogenic shock implies that systolic pressure is less than 90 mm Hg and is typically associated with acute pulmonary edema and worsened prognosis.
Atrioventricular block is common especially after inferior wall infarcts resulting from either ischemia or injury to the atrioventricular nodal branch of the right coronary artery or increased vagal tone. Complete heart block occurs with larger infarcts and has a worse prognosis.
Right ventricular infarction occurs in approximately 33% of inferior wall infarctions. Symptoms are caused by the reduction in right ventricular ejection fraction, which returns to normal within 10 days in approximately 50% of cases. The diagnosis may be established using technetium pyrophosphate (PYP) radionuclide scans. Complications include cardiogenic shock, elevated right atrial pressure, and decreased PA pressure. Right precordial EKG leads can also assist in making the diagnosis.
Myocardial rupture (3.3% of infarcts) may occur 3 to 14 days after infarction. The mortality rate approaches 100% and accounts for 13% of myocardial infarction deaths.
The chest radiograph shows acute cardiac enlargement secondary to leakage of blood into the pericardium. Rupture of the interventricular septum (1%) typically occurs between days 4 and 21, usually as a complication of anterior myocardial infarction and LAD disease. Mortality is 24% within 24 hours and 90% within 1 year. Swan–Ganz catheter measurements show an acute increase in saturation in the RV, although the wedge pressures may be normal. Chest radiographs show acute pulmonary vascular engorgement and right-sided cardiac enlargement because of left-to-right shunt. Pulmonary edema is not a typical feature. Echocardiography readily demonstrates the septal defect.
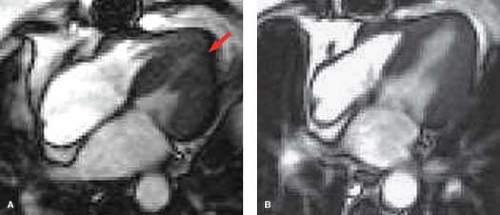
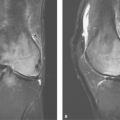
Figure 22.9. Dobutamine Cardiac Stress Test—MR. Two end-systolic steady-state free precession four-chamber long-axis image frames from a dobutamine cardiac MR stress test in a patient with chest pain 10 years following left internal mammary bypass graft to the left anterior descending artery. A. Image obtained at a low dose of dobutamine (10 μg/kg/min) and demonstrates ventricular cavity obliteration (arrow) at end-systole, implying normal systolic function. B. Image obtained during peak dobutamine dose (40 μg/kg/min) at a heart rate of 150 beats/min. At peak dobutamine, note the lack of wall thickening in the apical septum consistent with disease in the bypass graft that was proven at subsequent catheterization.
Papillary muscle rupture (1%) is suggested by abrupt onset of mitral regurgitation, with acute pulmonary edema on the radiograph. Typically, the left ventricle (LV) is only minimally enlarged, whereas the LA enlarges quickly. Inferior infarcts are associated with posteromedial papillary rupture. Anterior infarcts less commonly affect the anterolateral papillary muscle. Mortality is 70% within 24 hours and 90% within 1 year. Echocardiography confirms the diagnosis.
Ventricular aneurysm develops in approximately 12% of survivors from myocardial infarction. Ventricular aneurysms may also be caused by Chagas’ disease or trauma and are rarely congenital—usually seen in young black males. Aneurysms present with congestive failure, arrhythmias, and systemic emboli. True aneurysms are broad-mouthed, localized outpouchings that do not contract during systole (see Fig. 21.34). They are typically anterior or apical and result from LAD disease. The chest radiograph shows a localized bulge along the left cardiac border and may show rim-like calcification in the wall (Fig. 22.10). Fluoroscopy detects up to 50%, whereas 96% are detected by radionuclide ventriculography or myocardial perfusion scan. Echocardiography, contrast-enhanced CT, and MR are also accurate at detecting true aneurysms.
Pseudoaneurysms are contained myocardial ruptures, consisting of a localized hematoma surrounded by adherent pericardium. Causes include infarction and trauma. Patients are at high risk for delayed rupture. Pseudoaneurysms are typically posterolateral or retrocardiac in location and have smaller mouths than true aneurysms (see Fig. 21.16). MR is most accurate at detecting pseudoaneurysms, but they can also be seen with echocardiography.
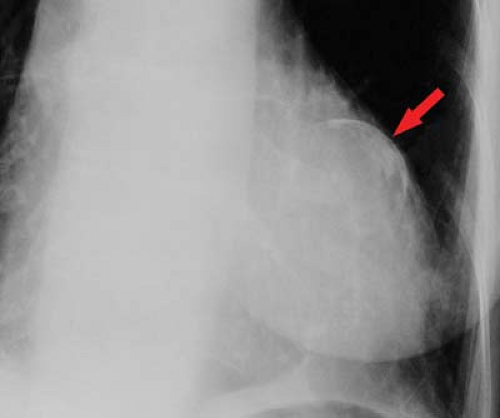
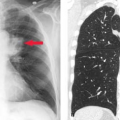
Figure 22.10. Left Ventricular Aneurysm—CXR. A localized calcified bulge (arrow) is seen along the left heart border, secondary to prior myocardial infarction complicated by left ventricular aneurysm.
Dressler syndrome (4% to 7% of infarcts) is also known as the postmyocardial infarction syndrome and is similar to the postpericardiotomy syndrome complicating cardiac surgery. Onset is typically 1 week to 3 months postinjury (peak at 2 to 3 weeks), but relapses occur up to 2 years later. Presentation includes fever, chest pain, pericarditis, pericardial effusion, and pleuritis with pleural effusion usually more prominent on the left. Dressler syndrome is considered an autoimmune reaction and responds well to anti-inflammatory medications.
Infarct Imaging
The indications for myocardial infarct imaging include late admission, equivocal enzymes, equivocal electrocardiogram, recent cardiac surgery or trauma, and suspicion of right ventricular infarction.
Radionuclide Imaging. “Cold spot” imaging is accomplished with thallium or technetium perfusion agents (Fig. 22.11). Sensitivity is more than 96% within 6 to 12 hours, but only 59% for remote infarction. Acute infarction cannot be distinguished from remote infarction on cold spot imaging. “Hot spot” infarct imaging is positive in acute infarction and uses Tc-PYP (Fig. 22.12), Tc-tetracycline, Tc-glucoheptonate, indium-111 antimyosin antibodies, or F-18 sodium fluorine. Pyrophosphate (PYP) uptake occurs in myocardial necrosis as a result of PYP complexing with calcium deposits. The Tc-PYP scans turn positive at 12 hours, have peak sensitivity at 48 to 72 hours, and revert to normal by 14 days. Persistent abnormal uptake implies a poor prognosis or developing aneurysm. Cardiomyopathies and diffuse myocarditis show diffuse increased uptake. Contusions and radiation myocarditis show increased regional uptake of Tc-PYP.
EBCT and MDCT with contrast demonstrate poor perfusion of the infarcted segment immediately after administration of contrast. After a delay of 10 to 15 minutes, the
normal myocardium washes out, leaving a contrast-enhanced periphery of the infarcted zone.
normal myocardium washes out, leaving a contrast-enhanced periphery of the infarcted zone.
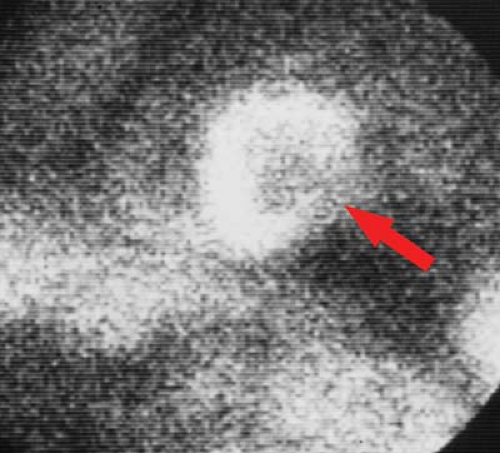 Figure 22.11. Myocardial Infarction—Scintigraphy. Resting, planar thallium image in the left anterior oblique projection demonstrates a defect in the inferoposterior wall (arrow), consistent with a myocardial infarction. Cold spot imaging can be accomplished almost immediately after the acute event. |
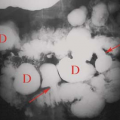
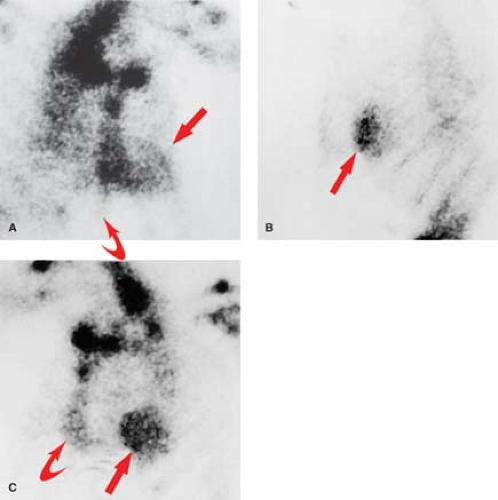 Figure 22.12. Myocardial Infarct Scan—Scintigraphy. Hot spot imaging was accomplished using pyrophosphate. Images are obtained in right anterior oblique (A), left lateral (B), and left anterior oblique (C) projections. Notice the uptake in the anterolateral wall of the myocardium (arrows), which is “hotter” than the sternum (curved arrow). |
MR demonstrates prolongation of T1 and T2 times secondary to edema of the acutely infarcted segment. Edema occurs within 1 hour after infarct and may be associated with myocardial hemorrhage. MR has a 93% sensitivity, 80% specificity, and 87% accuracy for acute myocardial infarction. The infarcted region is best delineated by high signal on T2WI; however, surrounding edema tends to overestimate the size of the infarct. T1WI with gadolinium demonstrates the acutely ischemic region and will help to differentiate reperfusion from occlusive myocardial infarction (Fig. 22.13). Regional wall thinning and lack of systolic thickening are good evidence of the size of the infarcted segment (Fig. 22.14). Scar tissue
will not contract, whereas viable myocardium (except when hibernating) will contract and thicken by at least 2 mm. Very high-grade stenotic coronary lesions may result in chronically ischemic myocardium with altered metabolism. This hibernating myocardium may act like postinfarction scar, but it remains viable and may improve in function with revascularization (Fig. 22.15). Unfortunately, it also remains at risk for acute infarction. “Stunned myocardium” describes postischemic, dysfunctional myocardium without complete necrosis, which is potentially salvageable.
will not contract, whereas viable myocardium (except when hibernating) will contract and thicken by at least 2 mm. Very high-grade stenotic coronary lesions may result in chronically ischemic myocardium with altered metabolism. This hibernating myocardium may act like postinfarction scar, but it remains viable and may improve in function with revascularization (Fig. 22.15). Unfortunately, it also remains at risk for acute infarction. “Stunned myocardium” describes postischemic, dysfunctional myocardium without complete necrosis, which is potentially salvageable.
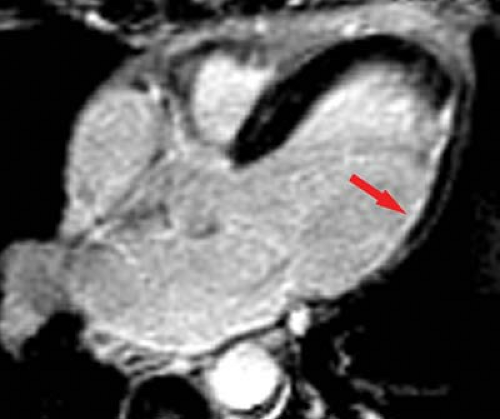 Figure 22.13. Myocardial Infarction—MR. Contrast-enhanced inversion-recovery gradient-echo image in a four-chamber long-axis plane 10 minutes following gadolinium infusion at 0.2 mM/kg in a patient with a prior lateral wall infarction. Note the area of bright enhancement (arrow) in the lateral wall that subtends the inner 50% of the wall. |
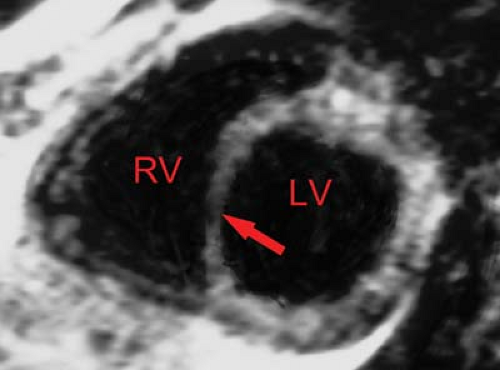 Figure 22.14. Old Septal Infarction—MR. Spin-echo image demonstrates fixed thinning of the myocardial wall (arrow) attributable to prior myocardial infarction. RV, right ventricle; LV, left ventricle. |
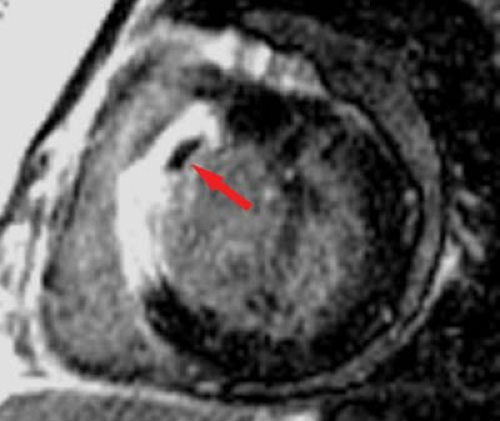 Figure 22.15. Microvascular Obstruction—MR. Short-axis late contrast-enhanced image using an inversion-recovery gradient-echo sequence 10 minutes following gadolinium infusion at 0.2 mM/kg shows infarct scar in the septum with a small hypoenhanced zone, which is consistent with microvascular obstruction (arrow). This region would be deemed nonviable based on the transmural extent of hyperenhancement and presence of microvascular obstruction. |
Echocardiography demonstrates hypokinesis, akinesis, or dyskinesis in previously infarcted myocardial segments; however, this cannot be distinguished from stunned or hibernating myocardium. Global hypokinesis can also be seen with cardiomyopathic processes. Thinned, hyperechoic walls with resting wall motion abnormalities suggest transmural scar. Use of echocardiographic microbubble contrast can enhance the infarcted region by highlighting perfused areas, resulting in a negative contrast effect at the site of the infarct.
Cardiomyopathies
The prevalence of cardiomyopathies is approximately eight cases per 100,000 population in developed countries. One percent of cardiac deaths in the United States is attributable to cardiomyopathy. The mortality rate in males is twice that in females, and in blacks is twice that of whites. In developing countries and in the tropics, the prevalence and mortality rates are much higher, probably because of nutritional deficiency, genetic factors, physical stress, untreated hypertension, and infection, especially Chagas’ disease.
Table 22.2 Causes of Congestive Heart Failure | |||||||||||||||||||||||||||
|---|---|---|---|---|---|---|---|---|---|---|---|---|---|---|---|---|---|---|---|---|---|---|---|---|---|---|---|
|
Table 22.3 Types of Cardiomyopathies | |||||||||||||||||||||||||
|---|---|---|---|---|---|---|---|---|---|---|---|---|---|---|---|---|---|---|---|---|---|---|---|---|---|
|
The cardiomyopathies are a group of anomalies with three basic features: (1) failure of the heart to maintain its architecture, (2) failure of the heart to maintain normal electrical activity, and (3) failure of the heart to maintain cardiac output. General features of cardiomyopathies include cardiomegaly; congestive heart failure, often with relatively clear lungs; dilated LV and RV with elevated end-diastolic pressures and decreased contractility; and decreased ejection fractions. These findings are only seen in the later stages of hypertrophic and restrictive cardiomyopathies. Causes of congestive heart failure are listed in Table 22.2.
The cardiomyopathies may also be divided into dilated, hyper-trophic, restrictive, and right ventricular types (Table 22.3).
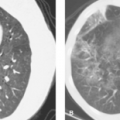
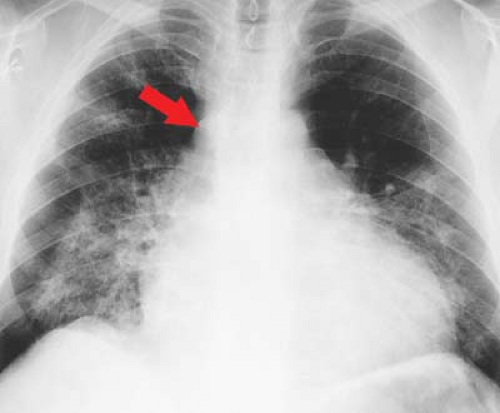 Figure 22.16. Dilated Cardiomyopathy—CXR. Chest radiograph shows the typical appearance of a dilated cardiomyopathy demonstrated with a water-bottle configuration of the heart and dilatation of the azygos vein (arrow). Pulmonary infiltrates are the result of pulmonary edema and capillary leak in this patient with viral myocarditis.
Related posts:Stay updated, free articles. Join our Telegram channel
Full access? Get Clinical Tree
 Get Clinical Tree app for offline access

|