Cardiac Magnetic Resonance Imaging in Ischemic Heart Disease: Introduction
Pathophysiology and the Ischemic Cascade
Understanding of CMR imaging in both acute and chronic IHD necessitates understanding of the sequence of pathophysiologic events that occur during ischemia. IHD is a dominating cause of death in Western countries and an emerging problem in developing countries. The development of IHD is related to both hereditary factors and lifestyle factors including smoking, diet, and lack of exercise. This section provides an overview of pathophysiology of ischemia with a focus on the mechanisms relevant to the etiology, diagnosis, and treatment of acute myocardial ischemia, stress-induced ischemia, myocardial stunning, hibernation, and infarction. These mechanisms are discussed in relation to the ischemic cascade, findings of myocardial perfusion and function at rest and stress, and the assessment of myocardial viability and the need for coronary revascularization.
The temporal sequence of events referred to as the ischemic cascade1 is illustrated in Fig. 6–1. Ischemia can be described as an imbalance between myocardial oxygen supply and demand. Ischemia can thus be conceptualized in two different ways. Reduced supply in the resting condition is exemplified by myocardial ischemia in the setting of plaque rupture, thrombus formation, and acute coronary occlusion. By comparison, a person may have adequate myocardial perfusion at rest despite having a stenosis in a coronary artery. Upon physical exertion, demand is increased, and myocardial ischemia may ensue despite unchanged supply, or rather, inability to increase supply in order to meet increased demand. In terms of treatment, a situation where myocardial oxygen supply is insufficient in relation to demand (ischemia) can be alleviated by increasing supply (ie, increased perfusion following surgical or percutaneous revascularization), but also by reducing demand (ie, β-blocker therapy). If possible, both the supply and the demand sides of the ischemic imbalance can be therapeutically targeted.
Figure 6–1.
The ischemic cascade. As ischemia progresses, information on the severity is most sensitive when using imaging modalities that depict ischemia followed by imaging modalities that depict function. Electrocardiographic changes are usually a late-stage sign of ischemia preceding chest pain.
Acute coronary syndrome2 (ACS) refers to clinical symptoms related to acute myocardial ischemia, sometimes called unstable coronary artery disease. If myocardium is affected by severe enough ischemia for a sufficient duration of time, the ultimate consequence is irreversible cell death. This is represented by infarction, seen at the top extreme of the ischemic cascade (see Fig. 6–1). During the healing process, the dead myocytes are replaced by connective tissue, forming a fibrotic scar, and myocardial contraction in the affected region cannot be restored. Furthermore, patients undergoing myocardial infarction are often subject to repeated infarction and, dependent on infarct size and location, negative left ventricular remodeling with possible dilatation and heart failure. For restoration of blood supply in ACS, either medical thrombolysis or percutaneous coronary intervention (PCI) may be used. However, the restoration of epicardial flow by PCI is not necessarily associated with restored myocardial microvascular flow, and thus, other means for restoring microvascular flow may be needed.
Major determinants of final infarct size include determinants of the severity of ischemia, which depends on the degree of collateralization, preconditioning, size of the myocardium at risk, duration of ischemia, and metabolic demand during ischemia including core body temperature. The most common cause of myocardial infarction is rupture of an atherosclerotic plaque with formation of a thrombus leading to occlusion of a coronary artery.3 The rupture of a plaque results in exposure of collagen, lipids, smooth muscle cells, and tissue factors to the blood, leading to activation of platelets and the coagulation system.4-6 Glycoprotein (GP) IIb/IIIa receptors on the surface of the platelets enable aggregation of platelets through cross-bridges of fibrinogen, and several vasoactive and procoagulative mediators are released. Treatment resulting in inhibition of these receptors is therefore of interest. A GPIIb/IIIa inhibitor is often used as adjuvant therapy in PCI because it may prevent obstruction of microvascular vessels, thus increasing microvascular blood flow after the restoration of epicardial flow.7 The same agent has previously been proven to attenuate circulating inflammatory markers,8 which are likely to take part in formation of the scar.
In ACS, the occlusion of a coronary artery results in a sudden imbalance in myocardial supply and demand. However, a more gradual development of occlusive atherosclerotic disease, as seen in many patients, may lead to recruitment of functional collateral vessels. These functional collaterals provide perfusion to myocardium that otherwise would be at risk of infarction during coronary occlusion and thus alleviate the ischemic burden on the myocardium supplied by the affected coronary artery during acute occlusion.9 In addition, the myocardium may be protected by preconditioning caused by repeated episodes of ischemia due to spontaneous closing and opening of the occluded artery during ischemia. Both collateral flow and preconditioning attenuate the ischemic injury and reduce final infarct size. Notably, the presence of native collaterals differs between species,10 which is one explanation for the diverse results from studies of the impact of duration of ischemia on final infarct size in different animal models.
Apart from collateralization and preconditioning, a major determinant of final infarct size is the size of the myocardium subjected to ischemia. This is called myocardium at risk and depends on where in the coronary arterial bed the occlusion occurs. Myocardium at risk represents the maximum amount of myocardium that might be infarcted as a result of the ischemia.
A myocardial salvage index can be calculated to estimate how much of the jeopardized myocardium (myocardium at risk) has been salvaged due to reperfusion therapy. This is calculated as follows: (myocardium at risk – final infarct size)/myocardium at risk.
Regarding salvage of jeopardized myocardium (ie, myocardium at risk), animal data have shown that the duration of ischemia needed to cause 50% of the myocardium to develop into infarction is approximately 40 minutes in pig and rat and 3 hours in dog. For humans, the corresponding time to reach 50% infarction is just under 5 hours (Fig. 6–2).11 Thus, when studying the efficiency of treatment with regard to infarct evolution, conclusions drawn from animal studies may not be directly translatable to humans, at least not with regard to time scale. This is especially important to consider when planning phase III studies, where animal research is commonly used as a basis for justifying the expected effects of a treatment in humans.
Figure 6–2.
Myocardial infarct size in relation to myocardium at risk with respect to duration of ischemia in different species. A linear and logarithmic time scale is presented in the left and right panels, respectively. A. Data from previous studies in pigs (black circle = Fujiwara et al14; white circle = Näslund et al13). B. Data from previous studies in rats (black circle = Hale and Kloner19; white circle = Arheden et al15). C. Data from previous studies in dogs (white triangle = Reimer and Jennings16; black circle = Kloner et al17; upward black triangle = Fujiwara et al14; downward black triangle = Reimer et al18). D. Human data (Hedström et al11). The brown and blue lines represent the 95% confidence intervals. MaR, myocardium at risk; MI, myocardial infarction. Reproduced from Hedström E, Engblom H, Frogner F, et al. Infarct evolution in man studied in patients with first-time coronary occlusion in comparison to different species: implications for assessment of myocardial salvage. J Cardiovasc Magn Reson. 2009;11:38.
Reimer et al12 showed in 1977 that a myocardial infarct evolves gradually during ischemia as a “wave front” that originates at the endocardium and spreads toward the epicardium as a function of time. Final infarct size is thus also related to the duration of ischemia, defined as the time from onset of occlusion to restoration of perfusion of the ischemic myocardium. The time course of infarct evolution has been well described for several species.10,13-20 In man, however, estimation of the time course of infarct evolution during occlusion of a coronary artery has been adapted from studies with physiologically diverse inclusion criteria that have been compensated for by the inclusion of large numbers of patients. The Gruppo Italiano per lo Studio della Streptochinasi nell’Infarto Miocardico 1 study (GISSI-1)21 and Second International Study of Infarct Survival (ISIS-2)22 showed that fibrinolytic therapy within 1 hour from the onset of symptoms results in a more than 50% reduction in mortality. Results from previous studies also indicate that treatment within 6 hours from onset of symptoms results in a mortality reduction twice that of treatment 6 to 12 hours after onset of pain.23 Overall, this shows that, similarly to the results from animal models, early reperfusion is of great value in patients. Recently, the infarct evolution in man was directly studied in a group of patients with strict inclusion criteria that closely mimicked an experimental setting.11 Two representative cases for early and late reperfusion in man are shown in Fig. 6–3, relating the final infarct size determined by late gadolinium enhancement CMR imaging to the myocardium at risk determined by myocardial perfusion single photon emission computed tomography (SPECT) imaging. Results from this study demonstrate that infarct evolution in man is considerably slower than in pigs, rats, or dogs11 (Fig. 6–4).
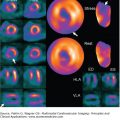
Figure 6–3.
Fusion of polar plots from myocardial perfusion single photon emission computed tomography (MPS) acquired acutely and late gadolinium-enhanced (LGE) cardiac magnetic resonance (CMR) images acquired 1 week after acute myocardial infarction (MI) in two patients subjected to ischemia for 110 and 190 minutes, respectively. The MPS polar plots indicate myocardium at risk (MaR; black) in the otherwise well-perfused myocardium (yellow). The center of the polar plot represents the left ventricular apex, and the periphery represents the basal parts of the left ventricle. Final MI size by LGE CMR is shown in white, where brightness indicates MI transmurality from 0% (black) to 100% (white). Reproduced from Hedström E, Engblom H, Frogner F, et al. Infarct evolution in man studied in patients with first-time coronary occlusion in comparison to different species: implications for assessment of myocardial salvage. J Cardiovasc Magn Reson. 2009;11:38.
Figure 6–4.
Infarct progression for different species. Comparison of the infarct progression slope (A) and the time to reach 50% myocardial infarction (MI) of the myocardium at risk (MaR) (B) for the different species. There was a significantly slower infarct evolution in man compared with pigs, rats, and dogs. Consequently, the time to reach 50% MI of the MaR was longer for humans compared with pigs, rats, and dogs. *** = P < .001; ** = P < .01. Reproduced from Hedström E, Engblom H, Frogner F, et al. Infarct evolution in man studied in patients with first-time coronary occlusion in comparison to different species: implications for assessment of myocardial salvage. J Cardiovasc Magn Reson. 2009;11:38.
The aerobic metabolism in ischemic myocardium ceases within 10 seconds of acute coronary occlusion. This initially manifests itself as impaired myocardial relaxation, otherwise known as diastolic dysfunction. Relaxation is the energy-dependent phase of the contractile cycle in the cardiac myocyte, and it is limited by the supply of energy from adenosine triphosphate (ATP). ATP is necessary during relaxation in order to pump Ca2+ from the cytosol back into the sarcoplasmatic reticulum through ATP-dependent Ca2+ channels.24 Hence, following reduction in the supply of ATP, relaxation is the first process to be influenced. Within minutes, as ischemia persists, reduced amounts of creatine phosphate25 and the free energy hydrolysis of ATP26 both contribute to the continued reduction in the amount of ATP. Thus, the accumulated ATP debt further impacts on the ATP-dependent transport of Ca2+, and contraction is impaired. Systolic dysfunction is the result of this compromised contraction in addition to compromised relaxation. In acute occlusion, anaerobic metabolism is quickly inhibited as a result of accumulation of metabolites.27 In combination with accumulation of metabolites, the myocyte cell membrane eventually ruptures, thereby defining the necrosis that is the hallmark of infarction. Rupture of cell membrane leads to inability to exclude small molecules, which is an excellent marker for cell death.28
Myocardial infarction is first seen in the endocardial layers of the myocardium. The endocardium is most sensitive to ischemia because myocardial depolarization and contraction originate in the endocardium and spread toward the epicardium. In contrast, repolarization and relaxation a short time later originate in the epicardium and spread toward the endocardium. The endocardium thereby has a shorter time span for myocardial perfusion during diastole compared with the epicardium. Furthermore, the largest-caliber coronary arteries lie on the epicardial surface of the myocardium, and the most fine-caliber arterioles are localized in the endocardium. The endocardium is preferentially subjected to the highest pressures of systolic ejection due to the ensuing pressure gradient from endocardium to epicardium. Taken together, the endocardium is the region of the myocardium that is most susceptible to the imbalances of supply and demand in ischemia and is the first to succumb to infarction. Whereas the endocardial lateral borders of infarction are established early, the transmural extent of infarction extends in a wave-front manner throughout the myocardial wall. The time course of this wave front relates to the duration of ischemia.12,16 The endocardial lateral borders of the final infarct are therefore roughly equivalent to the lateral borders of myocardium at risk. Importantly, this is not the case at earlier stages of occlusion or when infarction has been aborted.29
In the setting of chronic IHD due to slow accumulation of atherosclerotic plaque over years, a more subtle progression through the ischemic cascade may occur compared with the setting of acute coronary occlusion. Patients may present in several different physiologic states of myocardial dysfunction that have not yet led to infarction or scar in the myocardium.
The term nonviable myocardium will here be used to describe myocardium that has been irreversibly damaged by infarction. The terms viability and viable myocardium have been used extensively in the literature to selectively describe reversibly dysfunctional myocardium while excluding normally functioning myocardium, which also is alive.30 However, the term viable will be used to describe all myocardium—normal and dysfunctional—that is not irreversibly damaged.31 Consequently, the term dysfunctional but viable myocardium will instead be used to selectively describe myocardium with intact cell membranes and that is in a state of potentially reversible dysfunction. Dysfunction in this setting refers to reduced systolic function.
The first event in the ischemic cascade may often be observed as compromised perfusion. Reduced perfusion may be caused by progressive stenosis due to the development of atherosclerotic plaque.32 Diastolic dysfunction is usually thought to precede systolic function. The notion that diastolic dysfunction can exist in isolation, however, is a subject of debate.33,34 Because a reduced amount of ATP impairs relaxation and causes diastolic dysfunction, although it has not been studied, it is reasonable to assume that increasing the deficit of ATP will affect contraction as well. Studies using sensitive measures of systolic function, such as tissue Doppler imaging by echocardiography, have identified previously undetectable reduced systolic function in patients who exhibit diastolic dysfunction.33,35 Furthermore, it has also been proposed that diastolic filling is facilitated by the kinetic energy of the blood that enters from the pulmonary veins during ventricular systole.36,37 This would imply that diastolic dysfunction could be augmented by reduced function during systole.
Following the reduction of myocardial function, further ATP debt affects the ATP-dependent Na+/K+ pump in the cell membrane.38 Disturbances in depolarization and repolarization and, ultimately, failure to sustain the membrane potential can be observed as changes in the electrocardiogram (ECG). The accumulation of metabolites eventually leads to the development of chest pain, possibly due to the accumulation of adenosine.39 Finally, if ischemia persists long enough, the result is irreversible cell rupture and infarction.
In summary, the ischemic cascade (see Fig. 6–1) describes a sequence of physiologic observations that are involved in the development of dysfunctional but viable myocardium. However, subtypes of dysfunctional but viable myocardium can readily be identified based on unique combinations of physiologic characteristics and their appropriate treatment. Notably, accurate classification by necessity includes assessment of perfusion, function, and viability. By definition, it is not possible to accurately classify dysfunctional but viable myocardium from a pathophysiologic perspective if any one of these three physiologic characteristics is left out of an assessment. Dysfunctional but viable myocardium can be categorized into subtypes based on important differences with regard to presence or absence of compromised perfusion, function, cellular integrity, and need for revascularization. The characteristics of different categories of ischemically compromised myocardium are summarized in Table 6–1.
| Function | Perfusion | |||||
|---|---|---|---|---|---|---|
| Rest | Stress | Rest | Stress | Cell Death | Need for Revasc. | |
| Normal | Norm | Norm | Norm | Norm | No | No |
| Stress-induced ischemia | Norm | ↓ | Norm | ↓ | No | Yes |
| Stunning | ↓ | ↓ | Norm | Norm | No | No |
| Repetitive stunning | ↓ | ↓ | Norm | ↓ | Noa | Yes |
| Hibernation | ↓ | ↓ | ↓ | ↓ | Noa | Yes |
| Infarction | ↓ | ↓ | ↓ | ↓ | Yes | No |
Stress-induced ischemia is characterized by viable myocardium that has normal perfusion and function at rest, but where perfusion and function are compromised at stress. Stress leads to an increased oxygen demand that typically can be achieved by, for example, physical exertion, increased sympathetic discharge leading to increased heart rate, increased blood pressure, and increased wall tension.40 Stress can also be induced pharmacologically. Patients exhibiting stress-induced ischemia will benefit from revascularization, particularly those with a large extent of stress-induced ischemia.41
One should be aware that this definition of stress-induced ischemia represents a simplified definition that is presented for purposes of comparison. It should be acknowledged that situations may occur where the duration of stress-induced ischemia is short enough to only induce a reduction in perfusion, but not sufficient enough to induce a reduction in contractile function. Likewise, situations may occur where the duration or severity of ischemia due to stress may be sufficient to induce a prolonged but ultimately reversible reduction in function. The occurrence of prolonged resting dysfunction following the reversal of ischemia is called stunned myocardium.
Stunned myocardium is characterized by a prolonged post-ischemic reduction in function in the presence of normal perfusion and the absence of infarction.42 The classic definition of stunning stems from observations of a prolonged but reversible reduction in systolic function following successful restoration of perfusion in the setting of experimental occlusion and reperfusion43 and, later, acute occlusion and reperfusion in the clinical setting of ST-segment elevation myocardial infarction.44,45 In these settings, rest and stress perfusion will both have been restored to normal, and the observed reduction in function will spontaneously resolve with time. Therefore, it is not necessary to revascularize stunned myocardium according to this classical definition.
The cellular mechanisms governing stunning have not been completely elucidated. Dominant views include the influence of oxidant stress from reactive oxygen species, as well as disturbances in calcium homeostasis.46,47 There are, however, situations where stunning occurs as a result of stress-induced ischemia, and thus, these patients would require revascularization. Such scenarios can be referred to as repetitive stunning.
Reduced function at rest is an important part of the definition of dysfunctional but viable myocardium, including stunning. As discussed earlier, stress-induced ischemia of sufficient severity and duration may induce a reduction in function that persists until the next ischemic episode despite the return of normal resting perfusion between ischemic episodes. This has been observed in both experimental animals48 and patients with chest pain upon exertion.49 These patients have stress-induced ischemia, and if they are not revascularized, the risk of stunning is present whenever these patients are subjected to sufficient stress. Furthermore, such repetitive stunning cumulatively induces a greater reduction in postischemic resting function than one episode alone.50,51 In summary, myocardium exhibiting repetitive stunning is repeatedly stunned by stress-induced ischemia and should therefore be revascularized.
Hibernating myocardium52 is defined as “a state of persistently impaired myocardial and left ventricular function at rest due to reduced coronary blood flow that can be partially or completely restored to normal if the myocardial oxygen supply/demand relationship is favorably altered, either by improving blood flow and/or by reducing demand.”53 Thus, hibernating myocardium is characterized by a chronic reduction in resting function as an adaptation to reduced resting perfusion in the absence of infarction. Clinical studies have shown that myocardium with reduced function and perfusion at rest may regain function following improvement in resting perfusion by revascularization.54-58
The ultrastructural and histologic morphology of hibernating myocardium has been studied using transmural needle biopsies taken at the time of open heart surgery. In summary, the features include signs of atrophy, most notably in the contractile myofibrils, and signs of degeneration and possibly dedifferentiation, most notably in the interstitial space.59 The severity of interstitial fibrosis has been shown to increase with increased duration of the symptomatic ischemia.60 Also, the amount of myocytes with excess glycogen is exponentially related to the time required for functional recovery following revascularization.61 Importantly though, noninvasive assessment of changes in perfusion and metabolism cannot currently distinguish between myocardium of mild or severe histologic degeneration.62
Controversy exists regarding whether hibernating myocardium with reduction in both resting function and perfusion readily exists or whether the more common mechanism for resting dysfunction is repeated episodes of stress-induced ischemia due to a reduced coronary flow reserve leading to stunning in myocardium with otherwise normal resting perfusion.59
An experimental model of hibernation in swine sustained for 1 month has shown normal resting perfusion in one third of the volume of dysfunctional but viable myocardium.63 However, studies of patients with chronic IHD have shown normal resting perfusion in approximately 90% of regions of the left ventricle identified as having dysfunctional but viable myocardium.64,65 These clinical data support the notion that dysfunctional but viable myocardium is predominantly comprised of repetitive stunning. By comparison, a review of 26 studies comprising 372 patients undergoing quantitative assessment of resting myocardial blood flow in dysfunctional but viable myocardium showed that 49% of the patients were found to have significantly reduced resting perfusion in dysfunctional but viable myocardium compared with normal myocardium.59 Furthermore, others have identified hibernating myocardium in >20% of the left ventricle in as many as 30% to 40% of patients with IHD and a left ventricular ejection fraction ≤30%.66,67 It is possible that these differences in findings regarding the prevalence of hibernating myocardium reflect differences in patient selection criteria in these reports.
The notion that dysfunctional but viable myocardium with reduced resting perfusion does exist is supported by findings of serially assessed improvement in resting perfusion and function following revascularization.54-58 These data favor the concept that hibernating myocardium with some degree of reduced resting perfusion is a considerable component of dysfunctional but viable myocardium.
Of importance for the clinician, reduced perfusion at stress is prevalent regardless of whether the dysfunctional but viable myocardium is due to repetitive stunning or hibernation. Both situations merit revascularization. Reduced resting perfusion appears to be less prevalent in dysfunctional but viable myocardium but can nonetheless exist. Furthermore, it is likely that both hibernation and repetitive stunning may coexist in the same patient and even the same region of myocardium.68 This implies a downregulation in function as an adaptation to reduced resting perfusion, but also an exacerbation of the compromise in function and perfusion at stress. Hence, the exact differentiation between hibernation and repetitive stunning may be of limited clinical importance. The identification of dysfunctional but viable myocardium in need of revascularization, regardless of subtype, is of paramount importance.69
Cardiovascular Magnetic Resonance Imaging
Despite the excellent soft tissue contrast shown by CMR, some situations may benefit from increased tissue contrast. The paramagnetic CMR contrast agents predominantly affect the image contrast by shortening the longitudinal relaxation time, T1, which is measured in milliseconds. The effects induced by magnetic resonance (MR) contrast agents are typically discussed in terms of 1/T1, called R1, the relaxation rate (ms–1), which is increased in the presence of paramagnetic contrast agents.70,71 Importantly, the contrast agent itself is not visualized by CMR. Rather, CMR visualizes the relaxation-altering effect that the paramagnetic agent exerts on the hydrogen protons in its immediate vicinity. This effect depends on the number of protons available to affect, the distance to these protons, and the rotational tumbling frequency of the water-particle complex72 and is related to the contrast agent concentration and its relaxivity (ie, how “good” the contrast agent is at affecting the protons) (Fig. 6–5). The relaxivity in vitro for the agents most often used today is approximately 4 s–1 mM–1 at 20 MHz and 37°C. The contrast agent concentration in a certain tissue depends on the pharmacokinetics of the contrast agent and tissue architecture. In vitro, the contrast agent concentration is considered to be linearly related to relaxivity. In vivo, however, this is limited by additional relaxation effects.73 The signal intensity in the image is therefore not necessarily linearly related to the relaxation rate. Contrast agent concentration in a tissue, however, is proportional to the change in R1 (ΔR1), defined as the difference between R1 before and after contrast administration. Thus, R1 and ΔR1 can be quantified by using a Look-Locker sequence74 or modified Look-Locker sequence for pixel mapping of R1.75 A Look-Locker sequence uses an inversion pulse followed by multiple small flip angle excitation pulses. Thereby the longitudinal relaxation rate of the tissue can be estimated. This may be used in order to determine contrast agent concentrations in different regions within the myocardium, such as infarcted and normal myocardium.
Figure 6–5.
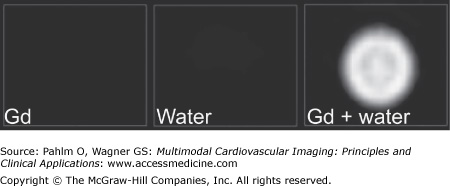
Three viability images of syringes filled with gadolinium (Gd), water, and Gd added to water. The syringe with Gd alone is dark in the image because no protons are available to affect. Also, the syringe with water alone becomes dark in the viability images. When Gd is added, the protons are affected, and the image becomes bright. This is also the case with edema and infarction where Gd affects the protons in the compartment.
The most common paramagnetic agent used today is gadolinium (Gd), which has seven unpaired electrons and thus high relaxivity.72 Because Gd is toxic, it is chelated to a ligand, such as diethylene triamine pentaacetic acid (DTPA), 1,4,7,10-tetraazacyclododecane-1,4,7,10-tetraacetic acid (DOTA), or DTPA bismethyl amide (DTPA-BMA), in order to reduce toxicity.76 Gd bound to ligands such as those mentioned distributes in the extracellular space77 in the same way as inulin78 and acts mainly on R1.
Recently, some Gd-based contrast agents have been suggested to be related to a rare but severe disease called nephrogenic systemic fibrosis (NSF).79 The disease is typically characterized by fibrosis of the skin and connective tissues. It is recommended that estimated glomerular filtration rate (eGFR) be assessed in patients above age 60 and patients with hypertension, diabetes, or hepatorenal disease. In cases of eGFR <30 mL/min, it is recommended that the examination using Gd-based contrast agents be cancelled. For patients with eGFR <60 mL/min, it is recommended that the dose be reduced to 0.1 mmol/kg. Patients with hepatorenal syndrome and patients with reduced renal function who have had or are awaiting liver transplantation should be considered at risk of NSF if eGFR is <60 mL/min. It is proposed that the value of the examination should be considered and that contrast agent may be administered, even in patients with low eGFR. Finally, there are macrocyclic contrast agents that have not been associated with NSF, and one might argue that these agents should be used preferentially. The numbers of proven cases of NSF are low in total, and the incidence may be decreased further by using adequate dose and choice of agent to be administered and using postexamination dialysis in certain cases.80,81
Intravascular MR contrast agents have been thought to overcome some of the limitations of extravascular contrast agents (eg, in angiography where the contrast stays in the vessel without extravasation). These agents have been tested for coronary artery MR imaging (MRI),82,83 infarct imaging,84-86 and determination of microvascular obstruction.87 The most promising applications are for angiography, but their clinical potential has not yet been fully explored.
Both clinical and experimental studies of treatment for acute myocardial infarction are facilitated by accurate measurement of myocardial infarct size expressed as percentage of the myocardium at risk.88,89 The number of patients needed for a certain power is significantly lower when infarct size is normalized to myocardium at risk. The reference standard in clinical research for quantifying myocardium at risk is myocardial perfusion SPECT (MPS) (see Chapter 3). Quantifying myocardium at risk by MPS, however, requires that a radioactive tracer is injected prior to opening the occluded coronary artery. The tracers technetium 99m (99mTc) -sestamibi and 99mTc-tetrofosmin both distribute in the myocardium in proportion to blood flow90 and are taken up by the viable myocytes, probably by a potential-driven transport of the lipophilic cation91 and binding to the mitochondria. Very little change in myocardial distribution is seen over time. The tracer does not redistribute and has a half-life of 6 hours. Imaging can typically be performed up to 4 hours after injection.92 Importantly, because the myocardial uptake is fast and redistribution is minimal, image acquisition will represent the perfusion of the myocardium at the time of tracer injection. Thus, if the tracer is injected during occlusion, image acquisition undertaken following reperfusion will still represent the perfusion of the myocardium as it was during occlusion.93,94 However, there are issues with using MPS to quantify myocardium at risk, such as the logistics of radiotracer availability, need for administration before opening of the occluded coronary artery, and possible interference with post-PCI care when acquiring images. Considering these limitations with MPS imaging, other clinical methods to quantify myocardium at risk are warranted.
T2-weighted CMR has been demonstrated to show myocardium at risk in experimental studies95-97 (Fig. 6–6). Similar findings in human studies have suggested that T2-weighted imaging may be related to myocardium at risk.98-101 Recently, T2-weighted short tau inversion recovery (STIR) CMR imaging was directly validated in humans using MPS imaging as reference method and demonstrated that myocardium at risk can be quantified in humans at 1 day and at 1 week after the acute event.102 T2-STIR MRI is thus a promising tool for measuring myocardium at risk simultaneously with final infarct size 1 week after the acute event (Fig. 6–7).
Figure 6–6.
Agreement between areas at risk (AAR) determined by microspheres and T2-weighted (T2W) magnetic resonance imaging in an experimental model of myocardial infarction. LV, left ventricle; SD, standard deviation; SEE, standard error of estimate. Reproduced with permission from Aletras AH, Tilak GS, Natanzon A, et al. Retrospective determination of the area at risk for reperfused acute myocardial infarction with T2-weighted cardiac magnetic resonance imaging: histopathological and displacement encoding with stimulated echoes (DENSE) functional validations. Circulation. 2006;113:1865-1870.
Figure 6–7.
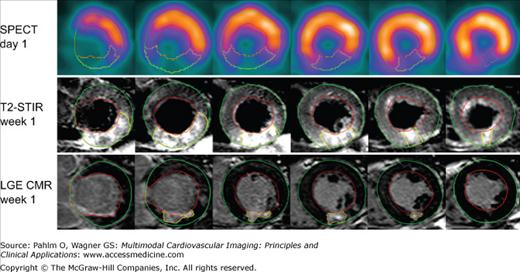
Myocardium at risk by single photon emission computed tomography (SPECT) and T2-weighted short tau inversion recovery (T2-STIR) cardiac magnetic resonance (CMR) and final infarct size by late gadolinium-enhanced (LGE) CMR in one typical patient. Short axis slices at the same ventricular level of SPECT on day 1, T2-STIR at week 1, and LGE CMR at week 1 in a patient with reperfused right coronary occlusion resulting in an inferior infarct. The epicardium is traced in green, the endocardium is traced in red, and the affected region is traced in yellow. Note the similarity in size of the perfusion defect during coronary occlusion by SPECT and by T2-STIR CMR 1 week later, which demonstrates that T2-STIR at week 1 can be used to quantify myocardium at risk. Reprinted from Carlsson M, Ubachs JF, Hedstrom E, Heiberg E, Jovinge S, Arheden H. Myocardium at risk after acute infarction in humans on cardiac magnetic resonance: quantitative assessment during follow-up and validation with single-photon emission computed tomography. JACC Cardiovasc Imaging. 2009;2:569-576. Copyright 2009, with permission from Elsevier.
The brightness in T2 images is believed to be mainly related to increased free-water content caused by edema, which prolongs T2 relaxation.103 This prolongation has been suggested to be related to the duration of ischemia.104 The increase in T2 following acute ischemia is relatively small. Thus, images may only show subtle signal intensity changes. As a result, surface coil intensity correction and through-plane motion need to be compensated for. Recent enhancements include black-blood T2-STIR,102,105 single-shot, bright-blood, T2-prepared steady-state free precession (SSFP) during free breathing,99 and hybrid T2 bright-blood turbo spin echo (TSE) SSFP techniques with high signal-to-noise ratio and contrast-to-noise ratio97 and single breath-hold T2 mapping.106 The bright-blood sequences may help solve the issue of difficulties differentiating slow-flowing blood from edema of the myocardial wall, whereas T2 mapping provides the ability for absolute quantification of tissue T2.
In a recent study, quantification of myocardium at risk with contrast-enhanced SSFP MRI was demonstrated and validated using MPS imaging as reference method107 (Fig. 6–8).
Figure 6–8.

Corresponding left ventricular short axis views from a patient with anterior ST-segment elevation myocardial infarction. Myocardium at risk determined by (A) myocardial perfusion single photon emission computed tomography, (B) gadolinium-enhanced steady-state free precession (SSFP) at end-diastole, (C) infarct size images with late gadolinium enhancement, and (D) gadolinium-enhanced SSFP at end-systole. Reproduced from Sorensson P, Heiberg E, Saleh N, et al. Assessment of myocardium at risk with contrast enhanced steady-state free precession cine cardiovascular magnetic resonance compared to single-photon emission computed tomography. J Cardiovasc Magn Reson. 2010;12:25.
It has been argued that the endocardial extent of infarction can be used as a surrogate measure of myocardium at risk.108,109 However, there are clinical situations with early reperfusion and a high degree of salvage or aborted infarction when the endocardial extent of infarction cannot be measured or is inaccurate.29 Thus, in these situations, salvage should not be calculated based on the endocardial extent of infarction because it is not a reliable quantitative measure of myocardium at risk (Fig. 6–9).
Figure 6–9.
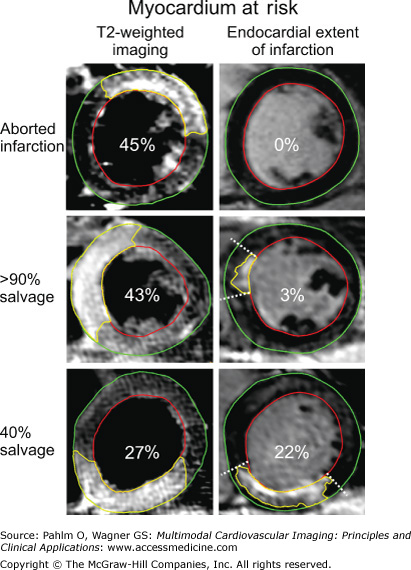
Myocardium at risk by T2-weighted imaging and endocardial extent of infarction. Short axis slices at the same ventricular level of T2-weighted imaging and late gadolinium-enhanced (LGE) cardiac magnetic resonance (CMR) for endocardial extent of infarction in three patients after reperfusion of an acute coronary occlusion. The endocardial borders are traced in red, the epicardial borders are traced in green, and the affected region is traced in yellow (myocardium at risk [MaR] for T2-weighted imaging and infarction for LGE CMR). The borders of the endocardial extent of infarction are indicated by dashed lines. Within each image, the total MaR is given as a percentage of left ventricular wall. The upper panel shows a patient with an aborted infarction, the middle panel shows a patient with >90% myocardial salvage, and the lower panel shows a patient with 40% myocardial salvage. Note the difference in size of the MaR by T2-weighted imaging and endocardial extent of infarction for the patient with an aborted infarction and the patient with >90% myocardial salvage. Reproduced from Ubachs JF, Engblom H, Erlinge D, et al. Cardiovascular magnetic resonance of the myocardium at risk in acute reperfused myocardial infarction: comparison of T2-weighted imaging versus the circumferential endocardial extent of late gadolinium enhancement with transmural projection. J Cardiovasc Magn Reson. 2010;12:18.
In vivo and ex vivo experiments have demonstrated that infarct size can be accurately assessed using late Gd-enhanced (LGE) CMR (Figs. 6–10 and 6–11).110-112 Depiction of myocardial infarction relies on the pharmacokinetics and biodistribution of Gd chelate (ie, Gd-DTPA, Gd-DOTA, or Gd-DTPA-BMA). Importantly, the Gd chelates are small enough to readily pass across the vessel wall into the interstitial space but large enough that they will not pass across the cell wall. Thus, these Gd chelates are referred to as extracellular contrast agents. Healthy cells have intact cell membranes and exclude the tracers. Thus, extracellular MR contrast media distributes in proportion to the extracellular space.77 Animal experiments using echoplanar MR with isotope validation indicate that the extracellular space is approximately 20% in normal myocardium, 30% in myocardium at risk or salvaged myocardium, and 90% in necrosis where cells with ruptured sarcolemmas can no longer exclude the contrast agent15 (Fig. 6–12).
Figure 6–10.
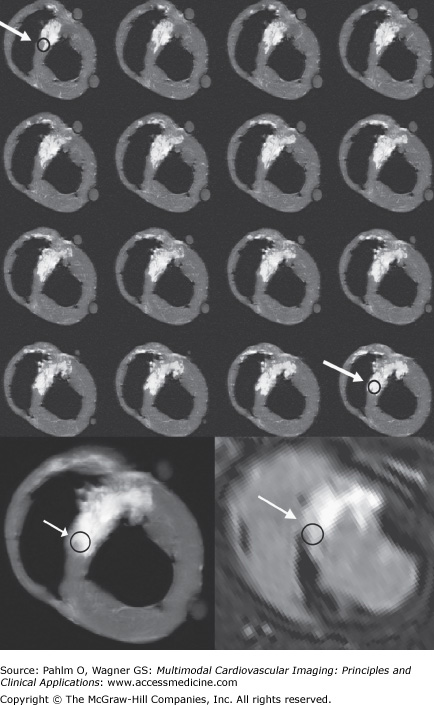
Comparison between ex vivo and in vivo viability images. Top four rows: T1-weighted short axis ex vivo cardiac magnetic resonance (CMR) images (repetition time/echo time, 20 ms/3.2 ms; flip angle, 70°; number of signal averages, two; isotropic resolution, 0.5 mm) in an image stack of 16 consecutive thin 0.5-mm thick ex vivo sections. Sections are arranged from base to apex starting at upper left and advancing left to right, then top to bottom. The arrow with circle shows a region that is not completely infarcted in the top row and almost completely infarcted in the bottom row. Bottom left: Image shows average of 16 thin ex vivo sections corresponding to one 8-mm thick section. Bottom right:
Related posts:


Stay updated, free articles. Join our Telegram channel

Full access? Get Clinical Tree


