Introduction
Most diagnostic methods used in clinical electrocardiography (ECG) are statistically based forms of pattern recognition. Over the years, the selection of the signal features used in these methods, such as timing, amplitude, and duration of wavelets, has been guided by knowledge gathered through linking clinical observations with ECG waveforms, along with insight gained from invasive electrophysiology. These methods have reached a diagnostic accuracy of up to 90% in some categories of cardiac disease. However, in other categories, the performance is much lower. Moreover, the manifestation in the ECG of some types of abnormality remains poorly understood. Examples of these problematic domains are the diagnosis of left ventricular hypertrophy, the interpretation of ST changes during acute ischemia, the electric manifestation of the Brugada syndrome, and the long QT syndrome. What these examples have in common is that the major features that play a role in the related ECG analysis are their waveforms, which are the result of the electric depolarization and repolarization processes of the membranes of cardiac myocytes, rather than rhythm abnormalities. Since Einthoven’s day (late nineteenth century/early twentieth century),1,2 the development of diagnostic ECG criteria has been accompanied by the development of biophysical models aimed at linking the electrophysiology of cardiac function with the waveforms of the ECG signals observed on the body surface. In such an approach, two aspects of the bioelectric generator need to be specified—a source model of the cardiac electric activity, and a volume conductor model, which is a model for describing the passive effects on the observed data of the body tissues that surround the active electric sources.
This chapter focuses on these model-based explanations of ECG morphology, in particular on the ECG components that reflect the electric activity of the ventricles. It does not include an analysis of cardiac rhythm. The emphasis of the approach lies on the ventricular activity. However, it applies in a similar manner to the electric activity of the atria.
The topic is illustrated by simulations from a computer program ECGSIM,3 which allows the user to interactively change the major source parameters: the timing of depolarization and repolarization on the ventricular surface and the local source strength. The program is available, free of charge, from the Web site http://www.ecgsim.org. The program was designed specifically to serve both as a tool in teaching the basic link between electrophysiology and ECG morphology and as an instrument in research applications.
In ECGSIM, the expression of the cardiac sources in terms of electric potential fields and signals (the handling of the so-called forward problem) is worked out in a realistic volume conductor model that accounts for the spreading out of the electric currents in a three-dimensional (3D) representation of the tissues surrounding the heart. Images are presented of the distribution of these parameter values over the ventricular surface as well as those of the accompanying potentials on the ventricular surface and on the body surface.
The theory behind the forward computation is outlined only briefly, focusing on the most essential part of it—a description of the nature of the source and of the source parameters that can be changed interactively. The remaining part of the chapter discusses a selection of the applications of this tool, summarized as “the ECG according to ECGSIM.”
The Source Model
The cardiac electric source in ECGSIM is the equivalent double layers (EDL) model. It expresses the entire electrical activity within the ventricular walls by means of a double layer source situated on the closed surface Sh bounding the mass of all ventricular myocytes: endocardium, epicardium, and their connection at the base. Referring to the surface as closed expresses the fact that any ant moving about inside such a surface would be able to reach all interior points but not be able to make its way out.
The EDL can be viewed as a generalization of the classic uniform double layer (UDL) source model, the model based on the analysis of Wilson et al4 in 1933. This source model has been shown to be very effective in describing the sources at the depolarization wave fronts.5 The link between the UDL and the EDL models, explained in detail in van Oosterom,6 is summarized here to facilitate the introduction of the EDL concept.
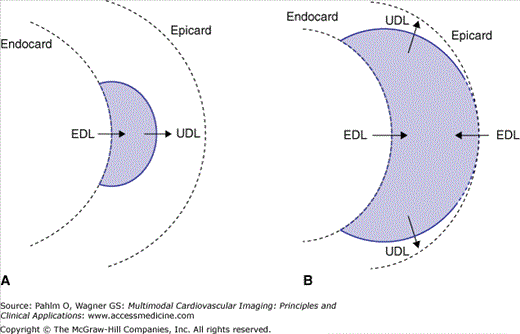
To this end, in Fig. 15–1, a schematic diagram is presented of the activation of the ventricular wall initiated at a single site on the endocardium, shown in a transmural cross-section. The heavy solid lines mark the wave fronts (ie, the boundaries between activated tissue [in grey] and the regions that are still at rest). The wave front propagates along the local normals, marked by UDL. The gradients of the intracellular potential of the myocytes across the wave fronts (≈100 mV/mm) act as the dominant electric forces for the potential field generated in the medium outside the myocardium. In the UDL source model, the sources are taken to be an electric double layer of uniform strength. The double layer can be viewed as an infinite number of current dipoles of uniform (infinitesimally small) strength that are evenly distributed over the activation boundary, each oriented normal to its local surface and pointing toward the tissue still at rest, the direction of the arrows marked UDL in Fig. 15–1. In an infinite medium, the potential at any point that is exterior to the myocardium generated by the UDL source is proportional to the solid angle subtended by the wave front at the observation point. The sign of the potential, with reference to the potential at infinity defined as zero, is positive if the observation point faces the approaching side of the wave front; elsewhere, it is negative.4,7-9
Figure 15–1.
Schematic representation of a cross-section of the ventricular wall. The heavy solid lines mark the wave fronts—the boundaries between activated tissue (in purple) and regions that are still at rest. The wave front propagates in the direction of the local surface normals, marked by uniform double layer (UDL). A. Early stage, single wave front. B. Later stage, breakthrough has occurred at the epicardium; the wave front (in this cross-section) has split up into two parts. The intersections of the wave fronts with the tissue boundaries, marked by heavy dashed line segments, constitute the locations of active parts of the equivalent double layer (EDL) on endocardium and epicardium.
In Fig. 15–1A, the intersection between the wave front and the ventricular wall is marked by a heavy dashed line segment. This borders the depolarized zone of the (closed) ventricular surface. At an exterior observation point, the solid angle subtended by this zone is identical to the one subtended by the wave front, because their rim is identical.10 As a consequence, instead of the source distribution at the wave front, the potential field in the exterior medium may be described by a virtual double layer, acting as an equivalence surface source distribution all over Sh. In order to apply this to the situation shown in panel A, the strength of the EDL over the depolarized part of Sh is taken to be nonzero, equal to the UDL strength at the wave front. Over the remaining part of Sh, the strength is zero. Note that for an exterior observation point close to the depolarized zone, the sign of the potential is negative, in agreement with measured electrophysiologic data (electrograms).
The situation depicted in Fig. 15–1B represents a later stage of the depolarization process, following epicardial breakthrough. Here, the EDL can be introduced in the same manner: For any exterior observation point, the potential generated by the UDL source(s) at the complete wave front(s) is the sum of the potentials generated by each of the subsections of the wave front. As before, the strength of the EDL is taken to be equal to the UDL strength (at the wave front) over any depolarized part of Sh, and to be zero elsewhere. The addition of the contributions of subsections is justified by the nature of the EDL. Just like that of the UDL, the nature of the EDL is that of a current source, specified by a current dipole surface distribution (see next section), for which the superposition (addition) principle holds true.
The EDL, just like the UDL, has the nature of an electric double layer. It differs from the UDL in that its strength is nonuniform over Sh. In the preceding introduction, the strength of the EDL is taken to be uniform over the depolarized parts of Sh and zero over the remaining parts. In this manner, the EDL may serve to explain the potential field during the depolarization phase only. At the end of this phase, the entire Sh borders depolarized tissue, and the EDL covers this closed surface. As a consequence, at this time, the contribution to the exterior potential field is zero because the solid angle subtended by any closed surface at any exterior observation point is zero.
In its generalization, the true electric source—the second-order spatial derivative of the transmembrane potential field throughout ventricular mass—is replaced by an equivalent source—an equivalent dipole surface density at the surface Sh bounding the myocardium. The time course of the local EDL strength is taken to be proportional to the local transmembrane potentials (TMP), Vm(t), of the myocytes near Sh, with a proportionality constant set by the local values of the electric conductivity of the tissue. Its background can be found in the literature.11 Its complete validity rests on an assumed spatial uniformity throughout the myocardium of the anisotropy ratio of intracellular and extracellular electric conductivities.12 Although this assumption represents a so-called first-order approximation only, the EDL is currently the only model available with a direct link to cardiac electrophysiology that is able to describe the most prominent aspects of the genesis of the ECG. This applies in particular to the cardiac sources during the repolarization phase (ie, for describing the genesis of the T wave of the surface ECG).13
Prior to depolarization, all ventricular myocytes are polarized, with a resting potential Vm(t) ≈ −80 mV. This creates a uniform EDL strength over Sh and, hence, a zero contribution to the external potential field and zero potential differences in all ECG leads. This is analogous to the situation of a single cell in its fully polarized state. By the time all myocytes have been activated, normally say 80 ms later, all values of the TMPs Vm(t), which set the EDL strength at Sh, are close to a state having reversed polarity, Vm(t) ≈ +10 mV, a state generally referred to as the depolarized state. If all Vm(t) values were uniform over Sh, the external potential field would, once again, be zero. In fact, close to the parts of Sh where depolarization started, the Vm(t) values will already have progressed more toward their resting value than at the parts activated last. This causes a nonuniform distribution of Vm(t) values over Sh and, hence, produces a nonzero external field, causing nonzero values at the end of the QRS interval, with higher magnitudes the nonuniformity is greater. In the same manner, the nonuniformity in the Vm(t) values over Sh values throughout the repolarization phase acts as the (EDL) source of the T wave voltages of the ECG. Significantly, if the time course during repolarization of Vm(t) of all myocytes was the same, the T wave amplitudes in all ECG lead signals would be zero. Finally, if the myocardium is fully repolarized, and if all resting state values of Vm(t) values are uniform, the external field is once more zero, accompanied by a return to zero baseline values of all ECG lead signals.
By using the EDL, the potential field in the external medium following the initiation of depolarization can be computed by splitting up Sh into numerous small patches. Individual source strengths proportional to the local value of Vm(t) are assigned to each patch, weighted by the signed, individual solid angle that it subtends at the field point. Adding up the contributions of all patches (superposition theorem) then results in the value of the potential at the field point.
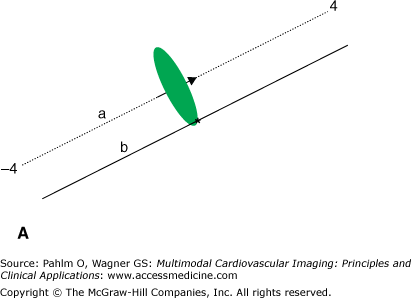
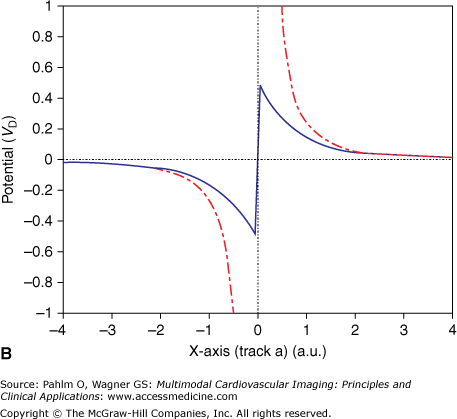
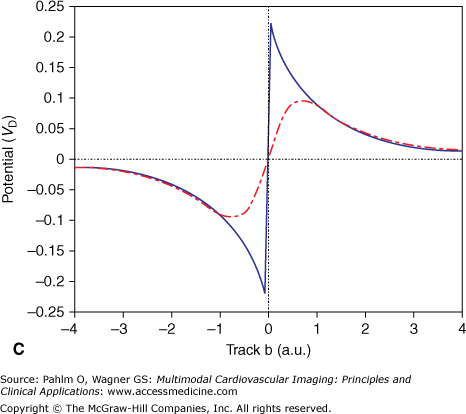
Any small membrane patch of a single cell acts as an elementary EDL that contributes to the extracellular field.4,14 The most particular nature of this type of source is emphasized in the following example, illustrated in Fig. 15–2. Figure 15–2A shows the projection of a disk-shaped patch carrying a uniform strength situated at x = 0 along an x-axis in 3D space (line segment a). The surface normal of the patch (ie, the direction of the double layer) is directed along the x-axis. In Fig. 15–2B, the solid trace depicts the potential profile along the x-axis, which is proportional to the signed solid angle subtended by the disk at different positions of the observation point along the x-axis. Note the abrupt change in the sign of the potential and the accompanying jump (discontinuity) in the potential when crossing the double layer,4 similar to the voltage jump observed when penetrating an active cellular membrane. The jump is the most characteristic feature of the double layer source. It occurs, with identical magnitude, irrespective of the angle at which the patch is crossed and irrespective of the point of intersection. The magnitude of the generated voltage jump, VD, can be used to specify the local double layer strength. When skimming the edge of the disk, as along line b on the upper panel, the discontinuity is still visible (Fig. 15–2C), but the magnitude is halved; potential profiles along lines that do not intersect the disk do not exhibit such discontinuities.
Figure 15–2.
A. Projection in three-dimensional space of a circular disk with unit radius, carrying a double layer source with strength D (A/m) placed in an infinite medium with electric conductivity σ (siemens/m). The arrow marks the surface normal of the disk, as well as the single dipole approximation of the double layer source. B. Solid line indicates potential profile generated by the disk along line a, expressed in units VD = D/σ (V); dash-dot line indicates potential profile generated by a single (equivalent) dipole as represented by the arrow on the upper panel. C. Potential profiles similar to the ones on panel B, but now along line b. The scaling of the x-axis is in arbitrary units, with the value 1 being equal to the radius of the disk. Note that at distal observations points, for example at distances greater than 2, (the diameter of the disk) the potential profiles of the single dipole closely approximate those of the double layer.
At sufficiently large distances from the patch (as a rule of thumb, greater than twice the size of the patch), the potential field generated by the EDL is closely approximated by the field generated by a current dipole that is directed along the normal of the patch, as can be seen in Fig. 15–2. However, close to the patch, the potentials generated by the single dipole deviate greatly from the ones generated by the double layer. Note that in close proximity to the dipole location (track a; x = 0), the magnitude of the potential generated by the dipole tends to become infinite, which is a completely unphysiologic value.
The current dipole is probably the best known model of the cardiac electrical generator; it is the basis of vectorcardiography. In Einthoven’s papers, as well as in his correspondence with Lewis and Wilson,15 we see it appearing as an arrow drawn on a plane, representing the “electromotive force” of the heart. At the side of the head of the arrow (see Fig. 15–2), current is injected into the surrounding medium. The location is referred to as the source of the dipole; just below it (at the side of the tail of the arrow), exactly the same current is withdrawn from the medium; the location is referred to as the sink of the dipole. The nature of the current dipole can be likened to that of a circulation pump inside an aquarium.
The single current dipole as used in vectorcardiography can be viewed as the vector sum of the current dipoles, approximating the EDL of all patches of the heart surface Sh. It is a gross approximation of the full complexity of the cardiac electric activity (a so-called equivalent generator) that can be used during the entire QRST interval. In this application, a single dipole performs surprisingly well; it accounts for approximately 80% (representation power) of the potentials observed on the body surface. This holds true irrespective of whether a detailed volume conductor model is involved. However, the dipole cannot be interpreted directly in terms of the underlying electrophysiology. Some limited physiologic interpretability of the single dipole is present in situations where the electric activity is restricted to a small part of the myocardium. Examples are sources during the time interval directly following activation (eg, Wolff-Parkinson-White syndrome, ectopic beats) or during very late phases in depolarization.
The Thorax Model
In Einthoven’s papers, at first sight, the implied volume conductor model appears to be a large planar sheet of conductive paper. Inspected more closely, it is seen to relate to an infinite medium of homogeneous conductivity, at whose center the electric sources are situated. Unrealistic as this volume conductor model may be, it proves to be highly valuable in the appreciation of the most significant characteristics of the potential fields generated by bioelectric sources.
For a spherical volume conductor with uniform internal electric conductivity and zero external conductivity (a somewhat more realistic volume conductor), a current dipole at its center produces potentials on the boundary of the sphere that are three-fold those in the infinite medium.
Since Einthoven’s day, volume conductor models have grown increasingly more realistic. Initially, the relationship between source strength and the resulting potentials was derived from measurements taken from physical phantoms (torso tank models). Later, following the pioneering work by Gelernter and Swihart,16 Lynn and Timlake,17 Barnard et al,18 and Barr et al,19 the model-based analysis moved on to computations using digital computers. At present, after vast improvements in computing power and numerical algorithms, such computations can be performed easily. In the thorax model implemented in ECGSIM, the individual geometries of the relevant conductivity interfaces are used, measured by means of magnetic resonance methods. The model takes into account the relatively low conductivity of the lungs and the relatively high conductivity of blood in the cavities.20,21
Matrix Formulation of the Forward Problem
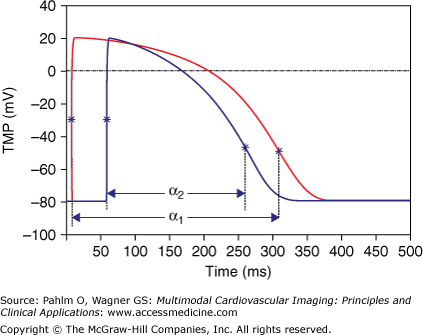
In ECGSIM, the simulation of the ECG is carried out by discretizing the EDL strength around N nodes of the numerical representation of the surface Sh at T subsequent time intervals of 1 ms. This is expressed by a matrix, S, having as its elements Sn,t, n = 1…N; t = 1…T. The temporal aspect of the source strength is described by a stylized version on a TMP wave form Vm(t). Two examples of these wave forms are shown in Fig. 15–3. These are generated as the product of a number of S-shaped curves, known as the logistic functions.22 Among the parameters involved in the specific variant of the wave forms, one is used for setting the local EDL strength at any node n, and two are used to specify the timing of local depolarization and repolarization, δn and ρn, respectively. The interval between these markers is the activation recovery interval (ARI), denoted here as αn = ρn – δn. This interval reflects the absolute refractory period of the tissue.23
Figure 15–3.
Two examples of stylized transmembrane potentials (TMP) at different patches of Sh, with activation recovery interval values α1 and α2, respectively. The asterisks mark the timing of the maximal slopes, in the upward slope taken as markers of local depolarization and in the downward slope as markers for the timing of local repolarization.
The transfer between sources and resulting potentials is described by a single, precomputed matrix A, with elements Al,n, l = 1…L; n = 1…N, with L
Stay updated, free articles. Join our Telegram channel

Full access? Get Clinical Tree


