Abstract
This chapter describes the various radiopharmaceuticals, equipment, and protocols used for imaging the heart, as well as relevant anatomy and physiology. Both SPECT and PET imaging are included. Images and their interpretation of myocardial perfusion, myocardial viability, and ventricular function are presented.
Keywords
cardiac SPECT, cardiac PET, myocardial perfusion, myocardial viability, ventricular function
Chapter Outline
SPECT Myocardial Perfusion Imaging
Conventional and Dedicated Cardiac SPECT and SPECT/CT Cameras
Myocardial SPECT Image Processing and Display
SPECT With Gated Acquisition (G-SPECT)
Radionuclide Imaging of Cardiac Function
Clinical nuclear medicine studies play a pivotal role in the noninvasive evaluation of cardiac physiology and function. Their widespread use permits the sensitive detection and functional consequences of numerous cardiac abnormalities. About 50% of all nuclear medicine studies done in the United States are for cardiac imaging.
In general, radionuclide imaging procedures are designed to assess:
- •
Myocardial perfusion and viability
- •
Regional and global ventricular function.
Anatomy and Physiology
Because the heart functions predominantly as a pump, it is important to examine the physiology and anatomy related to this function. The volume of each chamber may be expressed as end-diastolic volume (EDV), which is the volume of the chamber when it is completely filled with blood. Although the EDVs of the left and right ventricles are different, under normal circumstances, the stroke volumes (volume of blood ejected by each ventricle during systole) must be equal and normally range from 80 to 100 mL. Cardiac output is the volume of blood pumped by either ventricle over 1 minute. It can be obtained by multiplying stroke volume by heart rate. The ejection fraction of a chamber is the measurement commonly used clinically because it takes into account the EDV and the stroke volume. The ejection fraction is the percentage of EDV that is ejected by a ventricle during systole.
During systole, the LV normally shortens at least 20% along its long axis and 40% along the short axis as the walls of the LV move inward. The apical portion of the LV moves inward the least. The anterior wall moves the most and is the largest contributor to LV pump function. The septum thickens and moves slightly toward the center of the LV. Assessment of wall motion by nuclear medicine techniques depends largely on viewing ventricular wall segments in tangent. Regional wall motion abnormalities are classified as hypokinetic (diminished wall motion), akinetic (absent wall motion), or dyskinetic . Dyskinesia indicates that a particular segment moves paradoxically outward rather than contracting inward during systole. It is associated with prior myocardial injury and often indicates the presence of a cardiac aneurysm.
In the diastolic phase of the cardiac cycle, the myocardium first relaxes without a change in volume but with an exponential decline in LV pressure. This is referred to as isovolumetric relaxation. As the ventricular pressure falls below that of the left atrium, the mitral valve opens, and the early, rapid-filling phase is initiated. This is followed by diastasis , the third and final phase of diastole, which begins with the decline of passive filling and ends with the onset of an atrial “kick” that concludes diastole ( Fig. 5.1 ).

The heart muscle is supplied by the right and left coronary arteries. The major branches of the left coronary artery are the left anterior descending (LAD) and circumflex coronary arteries ( Fig. 5.2 ). The LAD branch supplies the interventricular septum anteriorly, predominantly through the first septal perforator branch, and the large anterolateral wall of the LV, primarily by multiple diagonal branches. The left circumflex branch supplies the left atrium and the posterolateral wall of the LV, primarily through its obtuse marginal branch. The right coronary artery has an acute marginal branch and often terminates as the posterior descending artery. It supplies the right atrium, the right ventricle (RV), the inferior wall of the LV, and a variable portion of the interventricular septum. In 80% of people, the right coronary artery is dominant even though it is usually smaller. Dominance is determined by which main coronary artery, right or left, gives rise to the posterior descending coronary artery, which supplies the inferior wall of the heart.

Myocardial blood flow is greatest during diastole because, at this time, the blood flows fastest through vessels that are not being constricted by the surrounding cardiac muscle. The normal coronary blood flow at rest is about 0.8 mL/min per gram of myocardium, representing about 5% of cardiac output. With exercise or pharmacologic stress, however, the coronary flow may increase fourfold to sixfold due to dilatation of normal coronary arteries
SPECT Myocardial Perfusion Imaging
Imaging of myocardial perfusion with radiopharmaceuticals is the most commonly performed cardiac examination in clinical nuclear medicine practice and, as such, it is important to know when the test is appropriate ( Box 5.1 ). The primary goal of MPI is to determine the adequacy of blood flow to the myocardium, especially in conjunction with exercise or pharmacologic stress for the detection and evaluation of coronary artery disease (CAD). Significantly, MPI is able to detect abnormalities early in the course of ischemic coronary disease before the onset of mechanical (echocardiographic) or electrical (electrocardiography [ECG]) abnormalities or the onset of clinical symptoms (pain).
Appropriate
Evaluation of Patients With Nonacute Chest Pain or Ischemic Equivalent a
a Ischemic (angina) equivalent defined as chest pain syndrome, anginal equivalent (chest tightness, burning, shoulder or jaw pain, palpitations), or nonchest symptoms including dyspnea or worsening effort tolerance.
Low or intermediate pretest probability with ECG uninterpretable OR patient unable to exercise
Intermediate pretest probability of CAD with ECG interpretable AND able to exercise
High pretest probability of CAD regardless of ECG or ability to exercise
Patients With Acute Chest Pain
Acute chest pain and possible ACS b
b Acute coronary syndrome (ACS) defined as unstable angina, myocardial infarct without ST elevation (NSTEMI) or with ST elevation (STEMI).
and high or low TIMI risk score c
c TIMI score: Thrombolysis In Myocardial Infarction Study Group score for risk of cardiac death or future adverse cardiac events.
with negative or equivocal ECG or troponin levels
Acute chest pain and possible ACS with recent or ongoing chest pain episodes, negative troponin and ECG without ischemic changes or with LBBB or electronic pacer rhythm (rest MPI study only)
Asymptomatic Patients Without Chest Pain or Ischemic Equivalent
High risk of CAD (ATP risk criteria) d
d ATP III risk criteria: multifactorial calculation of risk of coronary heart disease derived and updated from the Framingham study (Adult Treatment Panel).
New onset or diagnosis of heart failure with LV systolic dysfunction
Ventricular tachycardia
Syncope with intermediate or high CAD risk (ATP III risk criteria)
Elevated troponin without ACS
Risk Assessment of Patients With Known CAD
Post revascularization (CABG or PCI) evaluation in symptomatic patient for ischemia evaluation
Risk assessment with prior abnormal coronary angiogram or stress imaging study and or known chronic stable CAD with new or worsening symptoms
Risk assessment with prior results and/or known chronic stable CAD with intermediate- or high-risk Duke treadmill score
Risk assessment within 3 months of ACS and no prior coronary angiography, to evaluate for inducible ischemia
Evaluation of left ventricular function as routine use with rest/stress ECG gating with SPECT or PET MPI
Evaluation of left ventricular function with radionuclide angiography for baseline and serial evaluation of cardiotoxic therapy
Asymptomatic coronary calcium Agatston score 100 to 400 high CHD risk
Asymptomatic coronary calcium Agatston score > 400
May Be Appropriate
Asymptomatic Patients Without Chest Pain or Ischemic Equivalent
Detection of CAD without ischemic equivalent, asymptomatic, intermediate CHD risk, and ECG uninterpretable
Detection of CAD without ischemic equivalent, new onset atrial fibrillation, unclear etiology
Asymptomatic coronary calcium Agatston score 100 to 400 and low to intermediate CHD risk
Risk Assessment of Patients With Known CAD
Post-revascularization (CABG or PCI) evaluation in asymptomatic patient
Risk assessment with prior test results and/or known chronic stable CAD, asymptomatic or stable symptoms, normal prior stress imaging study, intermediate or high risk for CHD, last imaging study done ≥ 2 years ago
Risk assessment post revascularization (CABG or PCI), asymptomatic < 5 years after CABG or ≥ 2 years after PCI
Risk assessment with prior normal coronary angiography or stress imaging study and/or known chronic stable CAD with new or worsening symptoms
Inappropriate
Evaluation of Patients With Nonacute Ischemic Equivalent a
Low pretest probability, ECG interpretable, AND able to exercise
Definite ACS
Patients Without Chest Pain or Ischemic Equivalent
Asymptomatic low CAD risk (ATP III risk criteria)
Asymptomatic intermediate CAD risk with interpretable ECG
Syncope with low CAD risk
Risk Assessment of Patients With Known CAD
Asymptomatic or stable symptoms with normal prior stress imaging study unless intermediate to high risk and prior stress imaging study > 2 years ago
Asymptomatic coronary calcium Agatston score < 100 e
e Agatston score: measure of degree of coronary calcification by unenhanced, low-dose CT.
Preoperative evaluation for non-cardiac surgery (unless clinical risk factor ≥ 1 and poor functional capacity [less than 4 METs])
Risk assessment within 3 months of ACS (unless to evaluate for inducible ischemia and no prior coronary angiogram)
Risk assessment post CABG or PCI prior to cardiac rehabilitation (as a stand-alone indication)
ACS , Acute coronary syndrome; ATP , adult treatment panel ; CABG, coronary artery bypass graft; CAD , coronary artery disease; CHD , congenital heart disease; ECG , electrocardiogram; LBBB , left bundle-branch block; LV , left ventricular; PCI , percutaneous coronary intervention; TIMI , thrombolysis in myocardial infarction.
Although the basic principles of MPI are similar, protocols for imaging vary among the radiopharmaceuticals used. SPECT MPI may be performed by using one of several technetium-99m ( 99m Tc)-labeled agents, thallium-201 ( 201 Tl)-chloride, or positron-emitting radiopharmaceuticals. The state of the art for MPI is SPECT or SPECT/CT with electrocardiogram (ECG) gating (G-SPECT). This procedure is capable of producing excellent tomographic images of the myocardium, reflective of regional perfusion in addition to LV functional parameters, which, taken together, provide enhanced physiologic assessment of the heart. In rare patients who are not suitable for imaging with SPECT (e.g., those with claustrophobia, large size, inability to remain still on the scanning platform), planar imaging may be successfully performed, although with some loss of sensitivity. For purposes of discussion, the technical and interpretative aspects of perfusion and functional G-SPECT are presented separately.
Principle
In the simplest terms, radionuclide MPI consists of administering a radiopharmaceutical that distributes in the myocardium to provide a snapshot of regional coronary artery perfusion. The diagnosis of occlusive coronary disease is made by the visualization of relatively decreased myocardial deposition of the radiopharmaceutical in the myocardium distal to the site of vascular obstruction, compared to adjacent myocardium supplied by normal coronary arteries. However, because coronary perfusion in resting patients may remain at near normal levels at coronary artery narrowing of up to 90%, evaluation of patients at rest is insensitive for detecting even significant coronary artery disease. To increase the sensitivity of the examination, some form of stress, either exercise or pharmacologic stress to produce coronary blood flow greater than resting levels, is usually needed to render a flow differential between normal and abnormal coronary arteries that can be seen or digitally detected on myocardial perfusion images.
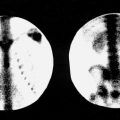
Physical exercise is one of the simplest and most common methods of rendering the condition needed to visualize a myocardial perfusion deficit. Because the myocardium is so efficient in extracting oxygen from the blood to meet metabolic demands, there is little room for improvement in extraction as metabolic demands increase during exercise. Thus, the heart satisfies increased oxygen requirements primarily by augmenting coronary blood flow, through the rapid dilatation of the vessels in response to oxygen deficit. This ability to increase blood flow from resting baseline to maximal levels is termed coronary reserve. In the presence of a fixed coronary stenosis, the ability of the vessel to dilate and thus the coronary reserve are diminished during conditions of stress. Under such circumstances, the myocardium supplied by the stenosed artery becomes apparent as a relative defect on myocardial perfusion images because perfusion to the involved area increases less than in the neighboring, relatively normally perfused tissue. As noted, stenoses of up to 90% of the arterial diameter may not produce a decrease in blood flow significant enough to be detected at rest ( Fig. 5.3 ). However, stenoses of 50% or more are reliably detected with MPI under conditions of maximal myocardial stress. By comparing myocardial perfusion at rest (baseline perfusion) to perfusion under conditions of stress (maximal perfusion), areas of reduced coronary reserve indicative of stenoses and resultant stress-induced ischemia can be identified. These principles are the same regardless of the radiopharmaceutical or method of stress used. Alternatives to exercise are commonly used to increase the sensitivity of the technique. These include drugs that mimic exercise by increasing the heart rate and blood pressure to place physical demands on the heart, as well as pharmaceuticals eliciting coronary artery vasodilation which produces relative perfusion deficits through the inability of stenosed arteries to dilate sufficiently to match the increased blood flow in adjacent normal coronary arteries, which retain their ability to dilate. These agents and their relative properties are discussed in more detail below.

Radiopharmaceuticals
Although 201 Tl-chloride was the first clinically successful MPI agent and is still used in some clinical settings, 99m Tc-labeled radiopharmaceuticals are now preferred. While the basic underlying physiologic principles and rationale for performing MPI remain the same, imaging protocol design, including the timing and acquisition of image sequences, is strongly influenced in almost every aspect by the radiopharmaceutical used and the method of stress employed. In this respect, whether the administered radiopharmaceutical remains fixed in the myocardium, washes out, or redistributes in the myocardium over time, and whether stress is achieved through physical exercise, pharmacologic agents, or a combination of the two, are important determinants. Thus, an understanding of the in vivo behavior of the radiopharmaceutical and available pharmacologic stress agents used to perform MPI is critical in determining the examination protocol and in the interpretation of the resulting images. Major characteristics of myocardial perfusion radiopharmaceuticals for both SPECT and PET MPI are summarized in Table 5.1 .
| Single-Photon Emission Computed Tomography | ||||||
| Radiopharmaceutical/Administered Activity | T 1/2 | Energy | Mechanism | First Pass Extraction | Redistribution | Primary Excretion Route |
99m Tc Sestamibi
| 6 hr | 140 keV Gamma | Passive diffusion into myocardial cells (90% binds to mitochondria) | 65% (1.0%–1.4% of administered activity localized in myocardium) | Essentially none (very slow clearance from myocardium without redistribution) | Hepatobiliary (highest dose: gallbladder) |
99m Tc Tetrofosmin
| 6 hr | 140 keV Gamma | Nearly identical to 99m Tc sestamibi | 54% (1.0%–1.4% of administered activity localized in myocardium) | Essentially none (very slow clearance from myocardium without redistribution) | Hepatobiliary (highest dose: gallbladder) |
201 Thallium ( 201 Tl)
| 73 hr | 68–80 keV (x-rays of mercury daughter) | Active cell membrane transport via Na + –K + pump (K + analog) | ~ 90% (3%–4% of administered activity localized in myocardium) | Rapid myocardial washout with redistribution in the myocardium | Renal/gastrointestinal (highest dose: kidneys) |
| Positron Emission Tomography | ||||||
| Radiopharmaceutical/Administered Activity | T 1/2 | Energy | Mechanism | First Pass Extraction | Redistribution | Primary Excretion Route |
82 Rubidium ( 82 Rb) Cl
| 76 s | 511 keV (annihilation photons) | Active cell membrane transport via Na + –K + pump (K+ analog) | 50%–60% | T 1/2 too short to detect redistribution | Renal (highest dose: kidneys) |
13 N-Ammonia (NH 3 )
| 10 mn | 511 keV (annihilation photons) | Passive and active cell membrane passage | 100% (60%–80% retained in myocardium as glutamate) | Minimal redistribution | Renal (highest dose: bladder wall) |
Technetium-99m Labeled Radiopharmaceuticals
The development of several classes of 99m Tc-labeled radiopharmaceuticals that overcome some of the technical limitations of 201 Tl has led to their widespread use in MPI. These include principally isonitriles and diphosphines. Compared with 201 Tl, the technetium label confers the favorable characteristics of ready availability; larger administered activity for better statistics, with reduced patient radiation doses per unit administered activity; and advantageous photon energy of 140 keV, producing higher-resolution SPECT images. The larger administered activity leading to higher myocardial count rates allows shorter acquisition times, with resultant decrease in patient motion and improved patient tolerance for the examination. The higher 140-keV photon of 99m Tc also helps minimize attenuation artifacts from the breast or diaphragm. In addition, good statistics and reasonably long retention in the myocardium of 99m Tc-labeled radiopharmaceuticals optimize G-SPECT acquisition for evaluation of LV function and wall motion. Thus, myocardial perfusion and function can be assessed by using a single tracer. Whichever 99m Tc agent is used, the overall sensitivity for the detection of CAD is comparable to thallium but the specificity is improved, resulting in part from fewer attenuation artifacts.
In addition to the technetium label, a major distinction between the most commonly used 99m Tc agents and 201 Tl is their behavior once taken up by the myocardium. After entering the myocardial cells, thallium does not remain static but undergoes significant washout from the myocardium back into the blood with reuptake into myocardium over time. This dynamic process, called redistribution, means that a single dose of thallium injected at stress may be immediately imaged to reflect perfusion at stress, but also imaged later when the redistribution of thallium presents an image ultimately reflective of a resting state. In contrast, the technetium agents remain in an essentially fixed myocardial distribution reflecting regional perfusion at the time of injection. There is no significant redistribution over time. Thus, when using the technetium agents, imaging at rest and after stress requires two separate injections, one at rest and one at peak stress. Because both the rest and stress images are obtained with the same 140 keV 99m Tc radiopharmaceutical, the activities of the injections must be adjusted so that a lower activity is administered for the first study and a higher activity for the second so that differences in perfusion at rest and stress can be distinguished.
Although thallium localizes in the myocardium by active transport through the cell membrane and the lipophilic technetium agents enter the cells by passive diffusion, their deposition in the myocardium is proportional to regional blood flow, with regions of lower blood flow accumulating less of the radiopharmaceutical and thus presenting as areas of decreased activity (defects) compared with adjacent normal areas of relatively higher flow. Thus, the diagnostic information obtained is the same.
Technetium-99m Sestamibi
Technetium-99m sestamibi (Cardiolite) is the most commonly used radiopharmaceutical for MPI. It is a lipophilic cationic isonitrile that is extracted by the myocardium with a first-pass efficiency of 65% and with lengthy myocardial retention primarily through binding to cytoplasmic mitochondria. Unlike thallium, there is minimal redistribution (< 20%) over time in the myocardium. Advantages to this fixed distribution include the convenience of delaying imaging when necessary, without loss of sensitivity, and the ability to reimage in case of equipment malfunction, positioning error, or patient motion. However, lack of significant redistribution also means that imaging of myocardial perfusion under stress and rest conditions requires two separate injections of radiopharmaceutical.
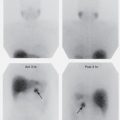
After intravenous (IV) injection, initial concentration of sestamibi is highest in the heart and liver. Approximately 1% to 2% of the activity localizes in the heart at rest. Accumulation of sestamibi in the myocardium is directly proportional to blood flow at physiologic levels. However, at high flow rates (greater than about two to three times baseline flow), such as those achieved during pharmacologic stress, blood flow may be underestimated. Although there is minimal change in concentration in the heart over time, there is progressive clearance of liver activity through biliary excretion (~35%) into the bowel and ultimately into the colon, which receives the highest absorbed dose. There is also some (~25%) renal excretion ( Fig. 5.4 ). Because adjacent or overlapping liver activity may interfere with cardiac imaging, enhanced clearance of activity from the liver and gallbladder may be facilitated by having the patient drink 8 ounces of milk or eat a fatty meal about 15 minutes after sestamibi injection. However, this may result in an increase in interfering bowel activity, especially when imaging is sufficiently delayed to allow passage of the radiopharmaceutical into the transverse colon and splenic flexure. When sestamibi is administered with the patient at rest, hepatobiliary clearance is slower but usually sufficient to permit imaging about 30 to 60 minutes after injection. Accumulation of sestamibi in the liver and gallbladder is relatively lower with maximal exercise than at rest, so postexercise imaging may generally be obtained 15 to 60 minutes after injection.

Technetium-99m Tetrofosmin
Technetium-99m tetrofosmin (Myoview) is a cationic diphosphine with good myocardial uptake (1% to 2% of the injected dose with a first-pass extraction efficiency of ~50%) and retention with little redistribution from the myocardium over time. Tetrofosmin underestimates myocardial blood flow at high flow rates (about two times baseline flow). There is rapid clearance of background activity from the blood pool. Similar to sestamibi, its cellular localization involves binding to cytoplasmic mitochondria. Its biokinetics are also in many ways similar to those of 99m Tc-sestamibi. However, less hepatic uptake and more rapid clearance from the liver after exercise make imaging possible within 30 minutes of IV injection and minimize the likelihood of artifacts associated with overlapping hepatic activity.
Thallium-201 Chloride
Although less commonly used for MPI than the Tc-labeled radiopharmaceuticals, the use of 201 Tl can play an important role as an alternative imaging agent at times when shortages of 99 Mo and thus 99m Tc limit or interrupt MPI using Tc-based agents. Further, 201 Tl also has properties that make it valuable in assessing myocardial viability and in distinguishing postinfarction scarring from chronically ischemic myocardium.
Thallium-201 is a cyclotron-produced radionuclide that decays by electron capture, with a half-life of about 73 hours. On decay, the major emissions are characteristic x-rays of the daughter product, mercury-201 ( 201 Hg), with an energy range of 69 to 81 keV. These are the primary photons used in myocardial imaging. Thallium-201 also emits smaller numbers of gamma rays at energies of 135 keV and 167 keV. The relatively long physical half-life of 201 Tl is advantageous, providing convenient shelf storage and successful imaging over a period of hours. The long half-life, however, also increases absorbed dose to the patient and limits the amount that can be administered. The relatively low administered activity requires longer imaging acquisition times and results in lower-count densities with inferior contrast resolution compared to 99m Tc-labeled radiopharmaceuticals. Further, soft-tissue absorption of the low-energy emissions of 201 Tl increases the likelihood of attenuation artifacts from overlying breasts and diaphragm, producing spurious defects that decrease the specificity of the study.
Thallium has biokinetic properties similar, but not identical, to potassium. Like potassium, thallium crosses the cell membrane by active transport mechanisms, especially the adenosine triphosphate–dependent Na + -K + pump. After IV administration, it ultimately has a mainly intracellular distribution. Thallium localizes in the myocardium in two phases: (1) initial distribution based on blood flow and cellular extraction by viable myocardium, and (2) delayed redistribution in the myocardium mediated by a dynamic equilibrium based on the continued extraction of thallium from the blood and ongoing washout of previously extracted thallium from the cells.
The extraction of thallium from the blood by viable myocardial cells is rapid, approaching 90% extraction efficiency. However, the total amount of thallium ultimately accumulating in the normal heart is limited by the concentration of thallium circulating through the coronary blood supply. Therefore, only about 3% to 5% of the total injected dose is localized in the heart.
Under resting and normal stress conditions, regional myocardial uptake of 201 Tl is linearly related to the regional coronary perfusion. Decreased perfusion to an area of myocardium results in a decrease in thallium accumulation in that region, compared with adjacent areas of relatively normal activity. A flow differential between normally perfused and poststenotic ischemic myocardium of about 2 : 1 is required before a definite defect is noted on thallium imaging.
After the rapid initial uptake of 201 Tl by the normal myocardium, there begins a slower process of washout of the thallous ion from the myocardial intracellular compartment back into the vascular compartment. At the same time, however, there is representation of additional bloodborne thallium to the myocardial cells for reextraction provided by the large pool of the injected radioisotope that was initially held by other organs of the body. These simultaneous processes of thallium washout and reextraction across the cell membrane provide a means for a dynamic equilibrium between intracellular and extracellular thallium, which defines the phenomenon known as redistribution. The washout component of redistribution depends strongly on coronary perfusion, with ischemic areas demonstrating much slower washout than normal regions.
Because of the more rapid washout of thallium from normally perfused tissue and the slower washout from myocardium that became ischemic at stress, the delayed redistribution images show an ultimate equalization of activity between the normal and ischemic tissue under most circumstances. Thus, on postexercise thallium images, a defect indicative of relatively decreased perfusion should disappear on later redistribution images if the initial defect was caused by transient reversible stress-induced ischemia. Because this redistribution may occur rapidly in some patients, post-stress images should be obtained early (usually in 15 to 20 minutes) to ensure a snapshot of myocardial perfusion at peak stress and so that an ischemic defect will not be missed. A nonreversible (“fixed”) defect carries other implications and frequently indicates an area of scarring.
Conventional and Dedicated Cardiac SPECT and SPECT/CT Cameras
Excellent diagnostic SPECT MPI studies can be obtained using conventional sodium iodide (NaI) crystal detectors, usually with two rotating camera heads to provide higher counting efficiency. However, more recent dedicated SPECT systems with even higher sensitivity have been developed for cardiac imaging. These employ hardware innovations as well as improved image reconstruction algorithms to provide higher-sensitivity (potentially a 5- to 10-fold increase), which allows for more rapid imaging (as low as 2 to 4 minutes) and/or reduction in administered activity and thus lower patient absorbed doses, while maintaining or improving image quality in terms of spatial and contrast resolution. There is a trade-off, however, with lower administered activity requiring longer imaging times, and if imaging times exceed several minutes there can be significant patient motion.
A notable hardware innovation is the replacement of traditional NaI crystal photomultiplier tube systems with solid-state detectors using cesium (CsI), and cadmium-zinc-telluride (CZT) detectors incorporating semiconductors provide improved image resolution. Scan times may be reduced from 10 to 15 minutes per acquisition to 2 to 5 minutes. Some designs have departed from the traditional orbiting SPECT cameras to introduce arrays of detectors which may be fixed (as in PET cameras) or with limited rotation allowing new acquisition geometries. Further, novel collimator designs have been recently introduced to maximize the detection of photons in the myocardial region. In conventional cameras, less than 0.01% of photons pass through high-resolution collimators. Therefore, improvements in the collimator sensitivity will likely play an important role in improving image quality (see Chapter 2 for more details on solid-state detector cameras). In addition to new hardware, advances in image reconstruction software specific to the properties of camera design, known as resolution recovery algorithms, have allowed reduction in image noise and an improvement in spatial resolution. These programs use iterative reconstruction techniques, instead of traditional filtered back projection, to correct for the factors in SPECT imaging that inherently degrade image quality, especially in settings of shorter imaging times and reduced counting statistics. Although more complex, iterative back projection may allow for production of transaxial images of equal or superior quality to those of traditional SPECT imaging.
Imaging Protocols
SPECT with gated acquisition using 99m Tc-labeled radiopharmaceuticals is the standard for routine MPI, although 201 Tl may be used in some settings. Planar imaging is rarely performed in patients in whom SPECT is not possible. As expected, SPECT imaging acquisition and processing protocols differ significantly depending on the radiopharmaceutical and instrumentation used, as well as whether exercise or pharmacologic stress is employed. Care should be taken to select the appropriate protocol and radiopharmaceutical appropriate to a patient’s clinical presentation and likelihood of CAD.
Specific SPECT acquisition protocols vary among laboratories and depend largely on available instrumentation and the preferences of the imaging physician. For conventional SPECT image acquisition, the patient is typically placed supine on the imaging table with the left arm over the head to avoid attenuation artifacts. Prone positioning may be used if necessary. For cameras designed for upright imaging the arms must be appropriately positioned out of the field of view. In some facilities, potentially attenuating breast tissue may be uniformly compressed over the chest or elevated to minimize potential attenuation artifacts. Because the position of the patient during cardiac SPECT imaging is somewhat uncomfortable, and patient motion during image acquisition may severely compromise image quality, preference may be given to shortening acquisition times. Specific protocols vary with respect to the number of detectors and type of detectors used, as well as the architectural design of the camera. For conventional orbiting SPECT cameras, a 180-degree orbit (45-degree right anterior oblique to 45-degree left posterior oblique) to avoid attenuation by the spine is typical. Regardless, care is taken to reproduce the positioning of the patient so that it is as similar as possible to that used during postexercise imaging, especially with regard to breast and arm location.
SPECT imaging is a technically demanding procedure. Strict compliance with SPECT quality-control measures and familiarity with study protocols established in each laboratory are essential for the standardization of the procedure and for achieving consistently accurate results. Some sources of error are listed in Box 5.2 .
Sources of False-Positive Examinations
True Defects
Coronary anomaly
Coronary spasm (variant angina)
Noncoronary disease
Mitral valve prosthesis
Cardiomyopathies
Aortic stenosis
Myocardial bridge
Idiopathic hypertrophic subaortic stenosis
Conduction defects
Left bundle-branch block (LBBB)
Long-distance runners
Ischemia of noncoronary origin
Apparent Defects and Artifacts
Chest wall artifacts
Breast tissue or pectoral muscles
Breast prosthesis
Electrocardiogram leads
Braces
Items in pockets, pendants, etc.
Obesity
High left hemidiaphragm
Excess patient motion (deep respiration)
Misinterpretation of normal variants
Overappreciation or underappreciation of apical defects
Variant activity at cardiac base, proximal septal area, and posterolateral walls
Papillary muscle attachments
Small ventricular cavity
Sources of False-Negative Examinations
Early redistribution
Submaximal exercise
Noncritical stenoses (< 50%)
Small ischemic area
Isolated right coronary lesion
Coronary collaterals
Multivessel disease (balanced)
Overestimation of stenosis on coronary angiogram
Interfering medication
Technetium-99m Radiopharmaceutical SPECT Rest and Stress Imaging Protocols
In patients with a moderate- to high-risk of CAD, known coronary artery disease, or a history of myocardial infarction, both rest and stress images are usually obtained to distinguish myocardial scars from salvageable ischemic myocardium. The requirement of separate stress and rest injections of 99m Tc-sestamibi or 99m Tc-tetrofosmin to differentiate fixed from reversible defects has given rise to several different imaging protocols. These may be summarized as 1- and 2-day protocols ( Fig. 5.5 ).

One-Day Rest–Stress Protocol (“Low-Dose Rest, High-Dose Stress”)
For reasons of patient convenience and timeliness of results, the one-day protocol is the most frequently used. Because of the long retention of sestamibi/tetrofosmin in the myocardium, it is necessary to adjust the administered doses so that activity from the first study does not interfere with the second. In the rest–stress, same-day protocol, a lower activity of 8 to 12 mCi (296 to 444 MBq) of 99m Tc-sestamibi/tetrofosmin is administered at rest, with imaging performed about 30 to 60 minutes after injection, followed 1 to 2 hours later by post-stress G-SPECT by using a higher administered activity 24 to 36 mCi (888 MBq to 1.33 GBq) injected at peak stress, for a total administered activity of about 32 to 48 mCi (1.18 to 1.78GBq). Post-stress images may be obtained 15 to 60 minutes after injection.
Although the rest–stress protocol is more common, the stress study may be performed first if needed or desired. If a stress–rest protocol is selected, then the dosages are reversed with 8 to 12 mCi (296–444 MBq) administered at peak stress and 24 to 36 mCi (888 MBq–1.33 GBq) administered at rest approximately 1 to 2 hours later, to allow any stress-induced perfusion differences to return to resting baseline. If the stress study is determined to be normal, then no rest study is needed, with a resultant decrease in patient dose.
Two-Day Protocol
In this protocol the stress and rest examinations are performed on two separate days. It is often reserved for patients with high body mass index so that a larger administered activity providing better imaging statistics may be used for both the rest and stress studies, with time for adequate decay of the first dose between studies. This allows the use of a full imaging dose of 24 to 36 mCi (888 MBq to 1.33 GBq) for each study to provide better imaging statistics, with time for adequate decay of the first dose to avoid interference of residual myocardial activity in the subsequent study.
Stress-Only Protocol
In an effort to diminish absorbed doses to patients, stress-only protocols using a single administered activity of 25 mCi (925 MBq) of 99m Tc-sestamibi/tetrofosmin have been introduced. Such protocols are suitable for patients with no history of myocardial infarction and a low likelihood of CAD. If the stress study is normal, the rest study is deemed unnecessary. If abnormal, a resting study may be performed the following day. The stress-only protocol has been shown to be comparable to normal stress–rest protocols for risk stratification in appropriately selected low-risk patients.
Thallium SPECT Stress–Rest Imaging Protocol
The use of 201 Tl for MPI has decreased over the years in favor of 99m Tc agents, largely due to the less than ideal imaging characteristics and greater absorbed doses. However, in certain instances, it can be very useful. These include (1) clinical situations in which myocardial viability assessment is needed, (2) when used in combination with 99 Tc radiopharmaceuticals for so-called “dual isotope” studies, allowing for shorter study times since the relative isotope energies do not interfere with each other and waiting time between rest and stress studies can be considerably shortened, and (3) in times of shortage of 99 Mo, limiting availability of 99m Tc radiopharmaceuticals for MPI.
The SPECT thallium exercise test consists of an initial post-stress set of myocardial images and an identical set of delayed redistribution images. An outline of the procedure is presented in Fig. 5.6 .

Thallium-201 Postexercise Imaging
When using 201 Tl, a dose of 2 to 3 mCi (74 to 111 MBq) is administered intravenously at peak stress. Because redistribution of thallium within the myocardium begins immediately at the termination of exercise and may be very rapid in some patients, imaging should commence as soon as possible, ideally within the first 10 to 15 minutes after exercise. This helps ensure that the initial images reflect as nearly as possible the distribution of coronary perfusion at peak stress. In patients who exercise especially vigorously, a full delay of 15 minutes may be prudent to allow for respiration to calm so that artifacts from changes in the extent of diaphragmatic excursion are minimized.
Thallium-201 Redistribution Imaging
Redistribution images are obtained 3 to 4 hours after the initial set and reflect the status of myocardial perfusion at rest. Whereas the single initial injected dose of 2 to 3 mCi (74 to 111 MBq) may be sufficient to complete the entire study, the administration of an additional dose of 1 mCi (37 MBq) may be helpful to ensure that adequate ambient thallium is available for redistribution. In some laboratories, 24-hour repeat imaging may be performed in patients who exhibit nonreversible defects on the 4-hour redistribution images to determine with greater certainty any degree of reversibility, and thus viability, of the postexercise defects.
Dual Isotope Imaging: 201 Tl- 99m Tc Sestamibi/Tetrofosmin Protocol
A dual isotope protocol using 201 Tl at rest and 99m Tc perfusion tracers during stress has been used as a variant of the 1-day, rest–stress all- 99m Tc protocol. In this protocol ( Fig. 5.7 ), a rest study using about 3 mCi (111 MBq) of 201 Tl is first obtained, followed shortly by a stress 99m Tc sestamibi or tetrofosmin study (24 to 36 mCi [888 MBq to 1.33 GBq]), so that the entire examination can be completed within 90 minutes, although at a higher patient absorbed dose. The rest study is performed first with the lower-energy 201 Tl (68 to 80 keV) so that there is no interference with the higher-energy 99m Tc (140 keV) acquisition. Because attenuation defects are generally more prominent on thallium imaging than with technetium agents, stress imaging is subsequently performed with 99m Tc sestamibi or tetrofosmin to minimize false-positive stress examinations caused by such artifacts. Further, post-stress G-SPECT using 99m Tc radiopharmaceuticals may increase the specificity of any perfusion defects. Extra care should be taken in processing the two different sets of images because different parameters need to be used to optimize the image quality of each data set.

Patient Absorbed Dose Considerations
Imaging physicians should be aware that MPI studies impose a relatively high radiation dose. This places an added responsibility for them to be used in accordance with established appropriateness criteria. Patient doses from MPI may be lowered by selection of the protocol used. The patient effective doses for the commonly used protocols are given in Table 5.2 . Dual-isotope rest–stress imaging using 201 Tl and 99m Tc-sestamibi may increase patient throughput, but they are associated with notably greater radiation doses than other protocols. Protocols using only 99m Tc radiopharmaceuticals typically reduce doses to half that of dual isotope imaging. Further, protocols limited to stress-only acquisitions, such as foregoing the rest study if the stress images are normal, offer a significant dose reduction, as may lowering the administered doses used in standard rest–stress protocols. Performance of MPI using newer SPECT instrumentation incorporating innovations in acquisition and image reconstruction technologies offer even lower dose alternatives without loss of image quality.
| Radiopharmaceutical | Protocol | Administered Activity b mCi (MBq) | Effective Dose c (mSv) d | ||
|---|---|---|---|---|---|
| Rest | Stress | ||||
| 99m Tc sestamibi | Rest–stress | 10 (370) | 30 (1110) | 9.4 | |
| Stress only | 0 | 30 (1110) | 7.0 | ||
| 2-day | 30 (1110) | 30 (1110) | 11.9 | ||
| 99m Tc tetrofosmin | Rest–stress | 10 (370) | 30 (1110) | 8.8 | |
| Stress only | 0 | 30 (1110) | 6.3 | ||
| 2-day | 30 (1110) | 30 (1110) | 13.1 | ||
| 201 Tl | Stress–redistribution | 0 | 4 (148) | 15.1 | |
| Stress–reinjection | 1.5 (55.5) | 3.0 (111) | 16.9 | ||
| 201 Tl/ 99m Tc sestamibi | Rest–stress | 3.5 (130) | 30 (1110) | 20.3 | |
| 82 Rb chloride | 2D PET | 50 (1850) | 50 (1850) | 9.1 | |
| 3D PET | 15 (555) | 15 (555) | 2.7 | ||
| 13 N ammonia PET | 15 (555) | 15 (555) | 2.6 | ||
| 18 F FDG PET | 10 (370) | 0 | 6.3 | ||
| 99m Tc-RBC ventriculogram | Rest | 20 (740) | 8.2 | ||
a Published values of effective dose vary somewhat; the main purpose for use of effective dose is to roughly compare the radiation from various examinations.
b Typically lower administered activities when using high-efficiency cardiac gamma camera.
c Using ICRP Publication 103 weighting factors and ICRP/ICRU voxel phantom. Modified from Anderson M. Erratum to: Effective dose to adult patients from 338 radiopharmaceuticals estimated using ICRP biokinetic data, ICRP/ICRU computational reference phantoms and ICRP 2007 tissue weighting factors. EJNMMI Physics 2015;2:22.
d The addition of a CT scan to a SPECT or localized PET scan adds about 3 mSv, and the addition of a CT scan to a whole body PET scan adds about 10 mSv.
Strategies for reducing patient doses from MPI include use of:
- •
99m Tc radiopharmaceuticals.
- •
Lower administered activity protocols, especially in smaller patients.
- •
Stress-only protocols in low-risk patients with normal post-stress images.
- •
Lower x-ray tube current in SPECT/CT and PET/CT protocols.
- •
Adequate patient hydration and encouragement of frequent bladder emptying.
- •
Advanced, dedicated cardiac camera and image reconstruction technologies.
Myocardial SPECT Image Processing and Display
Image Processing
After acquisition, the post-stress and rest (redistribution) images are reformatted in oblique planes. For structures with an oblique axis of symmetry in the body, such as the heart, the standard reconstructed cross-sectional views referencing the body are inadequate. Thus image reconstruction of cardiac tomograms is performed in three planes that are perpendicular to or parallel with the long-axis of the heart and oblique to the axis of the body; these include (1) short-axis, (2) vertical long-axis (VLA), and (3) horizontal long-axis (HLA) images ( Figs. 5.8 to 5.10 ). Generally, the primary operator input required for reconstruction is the identification of the long axis of the heart and rough delineation of the myocardial limits. This allows the appropriate reconstruction of tomographic images in three orthogonal planes relative to the orientation of the heart in the chest. The displayed reconstructed myocardial images are typically ~ 3 to 6 mm in thickness when 64 × 64 (pixel size ~ 6 mm) or 128 × 128 (pixel size ~ 8–9 mm) matrices are used.


The quality of SPECT images is greatly enhanced by computer processing and display. The most frequent maneuvers applied to the raw data are background subtraction, contrast enhancement, and image filtering. These processes are meant to make the images more pleasing to the eye and to improve contrast by removing distracting, unwanted activity and statistical noise. A wide choice of image filters is available for image manipulation, commonly including Butterworth, Hamming, and Hanning filters. The specific filtering processes used vary greatly among laboratories and depend on the preferences of individual interpreters. Care must be taken not to overprocess images such that the data are distorted and artifacts are induced ( Fig. 5.11 ).

SPECT Image Display
After processing is completed, the myocardial slices must be displayed in a fashion that facilitates comparison of the stress and redistribution/rest image sets. It is attendant on the interpreter to ensure that corresponding slices between the two sets of images are displayed so that an accurate comparison is made. The orientation of the images obtained in each reconstruction plane is standardized to the generally accepted convention ( Fig. 5.12 ). This is usually automatically performed by using the user software supplied by the equipment manufacturer. Generally, only tomographic sections that represent slices through both the myocardium and the cavity of the heart are used, to avoid partial-volume artifacts. Subsequent interpretation is best performed by manipulation of the image intensity and contrast on the computer screen or the viewing station of a picture archiving system.

Bull’s Eye (Polar Map Display)
In addition to the conventional display of tomographic slices, the entire three-dimensional perfusion distribution of a set of exercise or rest images may be condensed into one two-dimensional display by using a so-called polar or “bull’s eye” map ( Fig. 5.13 ). This display may be thought of as the heart viewed from its apex and opened up like an umbrella. Semiquantitative methods are applied to this bull’s eye display of the SPECT perfusion data that compare the radiopharmaceutical distribution for each patient to a gender-matched normal database of distribution. Thus regional activity less than that expected in a normal population identifies a perfusion deficit and is displayed as such on the polar map. The actual visual appearance of this deficit based on its severity is determined by the gray or color scale used. When using this display, however, the interpreter should be aware that perfusion defects at the base of the heart (outer circumference of the polar map) tend to be overemphasized, whereas centrally located defects, such as the LV apex, tend to be underrepresented. The bull’s eye representations of stress and rest (redistribution) myocardial perfusion can easily be visually compared in a third bull’s eye display that shows the differences in activity. This defines the reversibility or fixed nature of a perfusion defect. These bull’s eye plots are a convenient tool to be used as an adjunct to standard visual image interpretation and to summarize a patient’s perfusion pattern in a single image.

Image Interpretation
Approach to Interpretation
Visual interpretation principles are virtually the same regardless of the myocardial perfusion radiopharmaceutical used. Consistent interpretation of SPECT myocardial perfusion images is best ensured by a systematic approach that includes the following elements:
- •
Raw projection SPECT images are reviewed for patient motion, attenuation patterns, extracardiac activity, subdiaphragmatic activity, and position of the arms
- •
Proper alignment (coregistration) of the post-stress and rest tomographic slices
- •
Perusal of the images for obvious patient motion and attenuation artifacts, with review of sinogram or rotating cine images as needed
- •
Evaluation of the LV myocardium for the presence of perfusion defects and classification regarding size, severity, location, and degree reversibility, if any
- •
Estimation of LV cavity size and any transient enlargement
- •
Assessment of lung activity on thallium scans
- •
Assessment of RV activity
- •
Recognition of interfering adjacent splanchnic (liver, spleen, or bowel) activity
- •
Correlation with adequacy of stress and any ECG findings
- •
Correlation of findings with ancillary patient information, including history and clinical findings, prior coronary angiography or revascularization procedures, and previous myocardial perfusion studies
- •
On G-SPECT studies: evaluation of LV ejection fraction (LVEF) and correlation of LV wall motion with any perfusion abnormalities noted on the tomographic slices
Alignment of Images
An initial task of the interpreter is to assess the two series of processed images consisting of reconstructed stress and rest (redistribution) slices to ensure that they are properly aligned. Such coregistration of the slices in all three planes is essential for accurate comparison of perfusion in corresponding regions of the myocardium. Misalignment of the image sets may lead to a false impression of the fixed or reversible nature of areas of relative hypoperfusion and significantly reduce the accuracy of the examination.
Artifacts
Because tomographic images are composed of highly processed data, the interpreter should ascertain that the acquisition and resulting processed images are artifact free. Artifacts most frequently encountered are related to either the specific technology employed or to the patient. If an artifact is suspected, careful examination of the raw data in a rotating cine display of the sequential planar projections aids in detecting gross patient motion, areas of significant soft-tissue attenuation by overlapping tissue or pacing devices, and any superimposed liver or spleen activity. Other means for detecting patient motion, such as a sinogram (an abrupt break in the otherwise continuous sinogram stripe signifies patient motion), or a summed display of all the projections may be generated and viewed as needed. A thorough knowledge of common SPECT imaging artifacts is critical in SPECT image interpretation ( Table 5.3 ).
| Artifact | Cause | Appearance | Prevention/Resolution |
|---|---|---|---|
| Scaling artifact | Suppression of normal activity representation as a result of scaling image to a very hot pixel | Apparent defects in myocardium–often adjacent to or between papillary muscles–best seen on short-axis views | Defects are not substantiated in other planes. Rescale images. |
| Breast attenuation | Photon attenuation by overlying breast tissue | Fixed or sometimes reversible defects (if breast overlies on the myocardium only on the post-stress view); usually anterior, anterolateral, or anteroseptal walls | Review rotating raw images to confirm offending breast tissue. Review gated SPECT cine to determine whether a fixed defect shows wall motion and thus is not a scar. Use attenuation correction program. |
| Diaphragmatic attenuation | Photon attenuation by overlying diaphragm | Fixed inferior wall defect | Review rotating raw images to confirm attenuation by diaphragm. Review gated SPECT cine to determine whether the fixed defect shows wall motion and thus is not a scar. Use attenuation correction program. |
| Chest wall attenuation (obesity) | Photon attenuation by fat in chest wall | Fixed lateral wall defect | Review rotating raw images to confirm offending chest wall fat. Review gated SPECT cine to determine whether the fixed defect shows wall motion and thus is not a scar. |
| Left bundle branch block | Altered septal perfusion proportional to elevated heart rate | Reversible septal or anteroseptal defect | Use pharmacologic stress instead of treadmill exercise stress. Review ECG before study. |
| Wall thinning: apex, base of inferior wall or septum | Anatomic variants | Fixed defects in areas of thinning | Review gated SPECT cine to determine whether the fixed defect shows wall motion and is thus not a scar. |
| Reconstruction/ramp filtration artifact | Focus of increased abdominal activity adjacent to inferior LV wall | Inferior wall defect in post-stress and/or rest image; usually reversible, but may be fixed | Reimage patient after clearance of activity away from inferior wall. |
| Abdominal activity (liver, gallbladder, spleen, bowel, including reflux into stomach) | Activity in the liver or refluxed into the stomach which overlaps the inferior wall | Can mask an inferior wall defect and make a fixed defect appear reversible if overlap present only on resting images | Perform prone imaging (which may produce an anterior wall defect), or reimage patient after activity is cleared away from inferior wall. |
| Upward creep of the heart | Increased post-stress lung volumes diminishing during imaging | Reversible inferior or inferolateral wall defect | Delay post-stress imaging until normal respiration is restored (15–20 min). Reimage patients suspected of upward creep artifact. |
| Patient motion artifact | Patient movement during imaging: vertical, horizontal, or rotational | Vertical: anterior and/or inferior defects; others variable Image blurring with “tails” of activity extending from myocardial walls | Review rotating raw planar images or static sonogram to confirm motion. Use motion correction algorithm to realign planar images. |
Attenuation Artifacts
Significant soft-tissue attenuation by large breasts or breast implants may produce spurious fixed anterior or lateral wall defects ( Fig. 5.14 ), and considerable accumulation of adipose tissue in the lateral chest wall in obese patients may give rise to fixed lateral wall myocardial defects if the patient is imaged identically in the postexercise and subsequent rest (or redistribution) studies. Significant changes in positioning of the patient or of the patient’s breasts in the rest images that make the attenuation defect less apparent than on the postexercise images, however, may give rise to apparent reversible abnormalities.

Patients with left hemidiaphragmatic elevation may have spurious inferior wall defects because of focal attenuation. In addition to attenuation, intense liver, spleen, or bowel activity overlying the inferior wall of the LV may mask areas of decreased perfusion or may paradoxically produce an inferior wall defect ( Fig. 5.15 ). This latter artifact is thought to be related to an inherent effect of filtered back projection on myocardial segments immediately adjacent to such areas of intense activity.

In addition to indirect approaches, such as review of the raw data as a rotating display of frames in a cine loop format, regional and wall motion data available with G-SPECT often allow differentiation of true fixed defects, substantiated by locally diminished wall motion, from attenuation artifacts with regionally preserved wall motion.
Attenuation Correction and SPECT-CT Image Misregistration Issues
Direct attenuation correction methods can greatly improve the specificity of SPECT imaging by eliminating or minimizing soft-tissue attenuation artifacts ( Fig. 5.16 ). Advances in instrumentation, especially SPECT/CT (or PET/CT) hybrid scanners have allowed considerable strides in this maneuver. However, misregistration of the CT and SPECT images during this process is one of the most common causes of artifacts on SPECT/CT or PET/CT images and thus of errors in semiquantitative data displays.

Attenuation correction is a recommended but optional procedure performed by using a transmission scan (CT portion of SPECT/CT) to assess relative tissue density differences in the patient to create an “attenuation map,” used to correct for areas of attenuation of the radionuclide (emission) that would otherwise appear as a relative perfusion defect on the images. If performed successfully, a defect due to attenuation on the uncorrected images will “disappear” or be less apparent on the corrected images. In order for the technique to be successful, comparable positioning of the CT and radionuclide images and near exact coregistration of the two is imperative. Because the CT scan is performed in a matter of seconds (8 to 12 seconds) and the cardiac SPECT scan is performed over a period of minutes (5.12 minutes), cardiac motion caused by respiration is averaged over substantially different time intervals, and significant differences between the two regarding the position of the heart may occur, preventing the precise coregistration needed for successful attenuation correction. Further, misregistration of the images introduces artifacts of its own. It is not uncommon for artifactual defects to occur in the anterior and lateral LV walls when the SPECT emission and transmission (attenuation map) images are misregistered. Experience suggests that protocols using shallow tidal breathing (rather than breath-hold) with averaging of respiratory motion for both the CT (or PET) and radionuclide scans is the best technique to increase chances of better cardiac alignment and more accurate attenuation correction. SPECT/CT cameras allowing low-dose CT scans obtained over longer periods may be another option to improve the technique. Further, patient body movement during the longer SPECT scan also presents an opportunity for misregistration. However, because of frequent patient motion between the separately acquired MPI and computer tomography attenuation correction (CTAC) studies, which can be difficult to detect by patient observation, or if the patient is moved between the rest and stress MPI, a separate CTAC for the rest and stress MPI study may be used (optional). For SPECT MPI, separate CT scans for post-stress and rest attenuation mapping are typically necessary for the rest and stress MPI studies. If considerable motion between rest and stress images occurs, display of both corrected and uncorrected images for comparison during interpretation may be advisable. Consideration of various acquisition protocols depending on specific instrumentation used and patient presentations may be necessary to optimize coregistration in a particular clinical laboratory. Additionally, apparent myocardial defects may occur when the transmission and emission images are performed sequentially rather than simultaneously with patient movement between the two image sets. In general, shallow tidal breathing during both CT and SPECT or PET acquisitions is recommended.
Motion Artifacts
Patient motion is a significant cause of artifactual myocardial defects, and the appearance of the scan artifact depends on the direction and degree of motion and whether it is abrupt or gradual. Motion-correction software may be used in many instances to salvage studies in which motion is not extreme. In patients who exercise vigorously, exaggerated diaphragmatic respiratory motion that persists after exercise and subsequently returns to normal may induce an artifact that mimics inferior wall ischemia if the patient is imaged during this interval. This is produced as the diaphragm, and thus the heart, subsequently “creep” upward as respiratory effort returns to normal during image acquisition. To avoid this cardiac creep artifact, a delay in acquisition of immediate postexercise images for about 15 minutes to allow for hyperventilation to subside and the depth of respiration to return to normal is recommended.
Technical Artifacts
Artifacts during image reconstruction may occur if the long axis of the LV or the limits of the myocardium are incorrectly selected during processing. This generally results in overestimation or underestimation of activity at the apex. As expected, breaches in quality control of the imaging system, such as center of rotation malalignment and flood-field nonuniformity, may also produce significant image artifacts.
Normal Appearance and Variants
In the normal myocardial perfusion study, there is often slightly diminished activity at the LV apex, and in areas of anatomic thinning at the base of the intraventricular septum (membranous portion) and in the base of the inferior wall. Thinning at the base of the septum and inferior walls may be distinguished from true perfusion defects in that they are limited to the base of the heart and do not extend distally to the apex. These anatomic variants should not be mistaken for fixed perfusion defects. Defects that extend from the base toward the apex should be considered abnormal. Furthermore, the lateral myocardium normally demonstrates more activity than do other myocardial territories, especially when compared with the septum in the short-axis slices. This likely results from the lateral wall being closest to the camera during much of the usable acquisition.
Areas of focally increased activity in and at the insertions of the papillary muscles frequently can be seen, especially on the short-axis images at about the 2-o’clock and 7-o’clock positions. These “hot spots” may give a false impression of a defect adjacent to or between them, owing to relative differential in activity, when in actuality the intervening activity is normal. The apparently diminished perfusion is often accentuated by the scaling of relative intensities in the displayed images, based on the most intense pixel in the images (the markedly increased activity in the papillary muscles). This may artificially suppress activity in the normal but relatively less intense regions. These apparent differences in relative activity must be interpreted with caution. Generally, review of these areas in the long-axis slices, in which the papillary muscles are not as well seen, will demonstrate a homogeneous normal distribution in these regions, confirming a scaling artifact rather than a real perfusion deficit. However, significant perfusion defects that are also evident on the long-axis slices and are not attributable to artifact may be viewed as a positive finding.
Abnormal Scans
Visual Analysis of Myocardial Activity
Two distinct patterns of abnormal radiopharmaceutical distribution in the myocardium provide the basis for the detection and differential diagnosis of stress-induced ischemia and permanent myocardial damage. These patterns are referred to as (1) reversible (transient) defects and (2) nonreversible (fixed) defects . Defects may also be partially fixed with a reversible component. A third pattern, called reverse perfusion defects, is well documented but its significance is less well defined.
True defects usually are visible on at least two of the three standard sets of reconstructed slices. In addition to the short-axis views, defects are often best seen on the long-axis image set in which the axis of the slices is perpendicular to the involved wall (i.e., the anterior or inferior wall on VLA images and the septum or posterolateral wall on HLA images).
Reversible (Transient) Defects
A reversible defect is virtually synonymous with stress-induced ischemia in patients with CAD. The abnormality is identified on the initial post-stress images as an area of relatively decreased radiopharmaceutical activity that disappears or becomes significantly less apparent on the rest or redistribution views ( Fig. 5.17 ).

Nonreversible (Fixed) Defects
Fixed defects demonstrate no significant change in activity between the post-stress and rest or redistribution studies ( Fig. 5.18 ). They most frequently indicate areas of scarring or fibrosis, usually after myocardial infarction, with loss of contractile function. Some fixed lesions identified on the initial post-stress images may be partially reversible. Ischemia associated with a previous myocardial infarction with scarring (peri-infarct or “flanking” ischemia) commonly presents in this manner.

This straightforward approach to myocardial perfusion scan interpretation is complicated by the recognition that some nonreversible, fixed defects may actually represent primarily viable myocardium rather than postinfarction scarring. In patients with severe coronary stenoses, these defects frequently represent chronically ischemic, but viable, “hibernating” myocardium that remains poorly perfused at rest with loss of functional wall motion. Differentiating scar tissue from viable, but hibernating myocardium can be critical as the latter may be reversed by revascularization interventions resulting in restoration of regional contractile function.
To differentiate hibernating myocardium from scar in patients with fixed myocardial perfusion defects, PET imaging with 18 F-fluorodeoxyglucose ( 18 F-FDG) is the procedure of choice (described later in this chapter). However, thallium imaging also offers an effective method to confirm myocardial viability in this setting because thallium uptake in myocardial cells serves as an indicator of preserved cell membrane function. Thallium uptake in a fixed perfusion defect with accompanying myocardial dysfunction predicts improvement of function after revascularization. If a stress–redistribution thallium imaging protocol was initially used, additional thallium, additional time for redistribution, or both is required. Reinjections of patients with additional thallium (1 mCi [37 MBq]) before 4-hour redistribution imaging and/or further delayed 18- to 24-hour imaging are common approaches.
If the initial study was performed by using a technetium labeled agent, a thallium rest–redistribution protocol may be used on a separate day (to allow for radioactive decay). In this protocol, the patient is injected with thallium at rest and imaged immediately and again after a variable delay of 4 to 24 hours to image the chronically ischemic myocardium.
Reverse Perfusion Defects (Reverse Redistribution)
Reverse perfusion defects occur when a scan appears normal or with only a slight defect on the post-stress views and shows a new or worsened defect on the rest or redistribution images ( Fig. 5.19 ). Although initially reported on 201 Tl imaging, the phenomenon may also be seen when 99m Tc radiopharmaceuticals are used. The exact mechanisms that produce this pattern and its significance are uncertain. In many instances, the effect is simply related to a worse attenuation artifact on the post-stress images than on the rest images. However, reverse redistribution has been associated with prior myocardial infarction, especially after revascularization or thrombolytic therapy. This is likely to be the result of some residual tissue viability and some postulate that the regional hyperemic response to exercise may mask resting hypoperfusion in these areas. The finding is uncommon and does not indicate stress-induced ischemia.