Fig. 8.1
68-year-old male patient with recent ischaemic neurological symptoms, B-scan shows a hard plaque of the common carotid artery (CCA)

Fig. 8.2
Duplex ultrasonography depicted no high-degree stenosis of the CCA

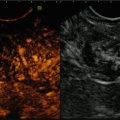
Fig. 8.3
VTIQ velocity colour overlay displayed relative shear wave velocities according to the adjacent colour spectrum, red areas corresponding to higher values and blue areas corresponding to lower values. Shear wave velocity was measured in the plaque between v = 3.13 and 3.58 m/s

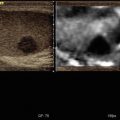
Fig. 8.4
Same patient as Fig. 8.3. The low-quality shear wave signal area representing the fluid parts of the carotid artery in dark yellow, the background tissue provides a high-quality signal as indicated by green area in the shear wave quality display in the same image


Fig. 8.6
In VTI mode elastography, the plaque appears in dark grey as an indicator for stiff tissue

Fig. 8.7
In sonoelastography, the plaque appears in dark grey as an indicator for a stiff tissue and confirmed the finding from Fig. 8.6

Fig. 8.8
75-year-old male patient with recent ischaemic neurological symptoms. B-scan shows a high-degree internal carotid artery (ICA) stenosis with hard plaques on both sides of the vessel

Fig. 8.9
Duplex ultrasonography depicted a high-degree stenosis of the ICA with overwriting artefacts of the vessel wall

Fig. 8.10
VTIQ velocity colour overlay displayed relative shear wave velocities according to the adjacent colour spectrum, red areas corresponding to higher values and blue areas corresponding to lower values. Shear wave velocity was measured in the plaques on both vessel walls between v = 3.04 and 3.28 m/s

Fig. 8.11
Same lesion as Fig. 8.10. The low-quality shear wave signal area representing the fluid parts of the vessel coded in yellow, the background tissue and the plaques provide a high-quality signal as indicated by green area in the shear wave quality display


Fig. 8.13
In VTI mode elastography, the plaques appear in red, as an indicator for stiff tissue

Fig. 8.14
In VTQ mode, the shear wave velocity could not be measured in the plaque v = XXX m/s

Fig. 8.15
In VTQ mode, the shear wave velocity was measured in the ventral carotid wall; no velocity could be measured v = XXX m/s

Fig. 8.16
In sonoelastography, the plaques appear in dark red as an indicator for a very stiff tissue. The borders of the plaques are displayed well in this technique

Fig. 8.17
67-year-old woman patient with ischaemic neurological symptoms. B-scan shows a high-degree internal carotid artery (ICA) and external carotid artery (ECA) stenosis with hard plaques on both vessel walls

Fig. 8.18
Duplex ultrasonography depicted a high-degree stenosis of the internal carotid artery (ICA) and external carotid artery (ECA) stenosis with hard plaques