Key words
common carotid artery, internal carotid artery, flow separation, intima-media thickness, carotid bulb, flow divider, tortuosity
B-Mode Ultrasound of the Normal Carotid Artery Wall
The carotid artery wall is composed of three layers: the intima, the media, and the adventitia. The intima is the innermost layer abutting the lumen. It is thin and is covered with a lining of endothelial cells. The media is the middle layer. It contains a preponderance of elastic and connective tissues in the common carotid artery (CCA), an elastic artery, whereas in the internal carotid artery (ICA), a muscular artery, there is a large proportion of smooth muscle cells intermixed with connective tissue. The transition zone in between, the carotid bulb, is the site predisposed to plaque formation with mixed morphometric components. The adventitia is the outermost layer. It densely composed of fibroblasts and connective tissue.
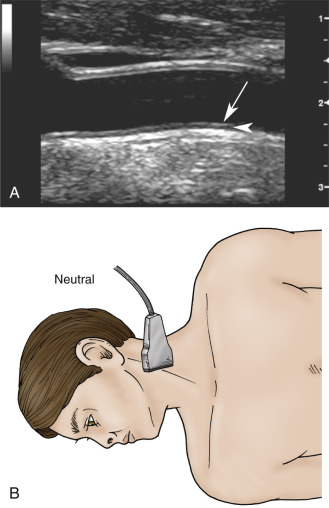
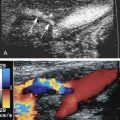
The three layers are discernable on B-mode (gray-scale) ultrasound images of the carotid arteries ( Fig. 5.1A and B ). In normal arteries, the interfaces between the lumen-intima and media-adventitia produce two parallel echogenic lines, with an intervening zone of low echoes that corresponds to the media. The echogenic line seen at the transition between the media and the adventitia corresponds to the location of the external elastic lamina as seen on pathologic studies, while the internal elastic lamina is not discernable. The thickness of the intima cannot be directly imaged on the B-mode ultrasound image because it typically measures 0.2 mm or less and is below the resolution of transcutaneous ultrasound, and the intima-media interface corresponding to the internal elastic lamina is not consistently visualized. What is seen is as a result of the reflection of the ultrasound beam at the lumen-intima interface, with the thickness corresponding roughly to the spatial resolution of the ultrasound probe. In most instances, the lumen-intima interface is better appreciated on the far wall than for the near wall of the CCA, although this is likely ultrasound device dependent. There is a close correlation between histology and ultrasound-based measurements of the intima-media thickness (IMT).
In disease-free arteries, the intimal reflection should be straight, thin, and parallel to the adventitial layer. Significant undulation and thickening of the intima-lumen interface indicate advanced changes due to atherosclerosis (see Chapter 6 ) or, rarely, fibromuscular hyperplasia.
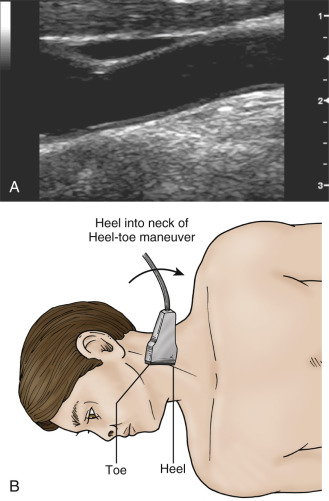
On transverse sections, clear visualization of the lumen-intima interface indicates that the image plane is perpendicular to the vessel axis. The lumen-intima interface is best seen on longitudinal images when the image plane passes through the center of the artery and the ultrasound beam forms an incident angle of 90 degrees with the wall interfaces (see Fig. 5.1A and B ). These interfaces are lost if the transducer is not centered on the artery or if it is angled with respect to the long axis of the artery by a heel-toe maneuver ( Fig. 5.2A and B ).
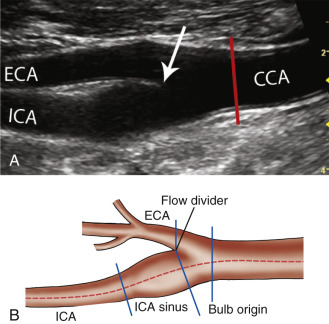
The carotid bulb is described as the widened portion of the distal CCA extending to the junction of the external carotid arteries (ECAs) and ICAs (the flow divider; Fig. 5.3 ). The ICA sinus originates along the wall adjacent to the external carotid artery (ECA) at the flow divider. The carotid bulb extends from the CCA to the junction of the ICA and ECA and blends into the dilation of the internal carotid sinus opposite the flow divider. The true ICA has parallel walls above (distal to) the sinus. The degree to which the carotid arteries widen at the carotid bulb varies from one individual to another. Usually the widening is slight, but some individuals have capacious carotid bulbs that may harbor large plaques in the absence of significant carotid stenosis. The CCA is an elastic artery, whereas the ICA is a muscular artery. The region of the ICA sinus has features of both a muscular and an elastic artery.
Normal Blood Flow Characteristics
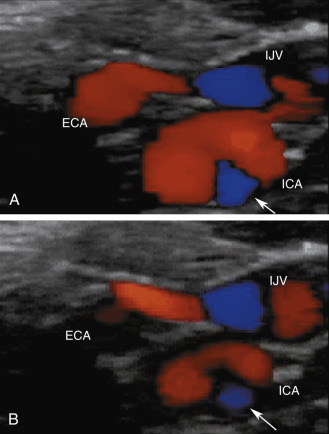
In normal CCAs that are relatively straight, blood flow is nearly laminar , meaning that blood cells move in parallel lines with the central blood cells moving faster than the more peripheral blood cells. The distribution of blood flow velocity across the diameter of the artery follows a parabolic pattern (see Chapter 1 ) with slowest velocity near the vessel wall and the fastest velocity near the center. Blood flow is not always laminar in normal vessels because the arterial segment has to be straight over a relatively long distance in order for the conditions of laminar flow to apply. Tortuous segments, kinks, or areas of branching disrupt the normal laminar flow pattern. The most noteworthy flow disturbance occurs at the carotid bifurcation ( Figs. 5.4 and 5.5 ; see Chapter 1 ), where a zone of blood flow reversal is established in the CCA bulb and proximal ICA opposite the ECA. The size of the zone of flow separation appears to be related to anatomic factors, including the diameter of the artery lumen and the angle between the ICA and the ECA.
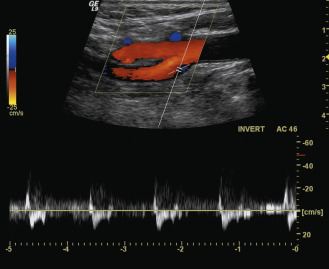
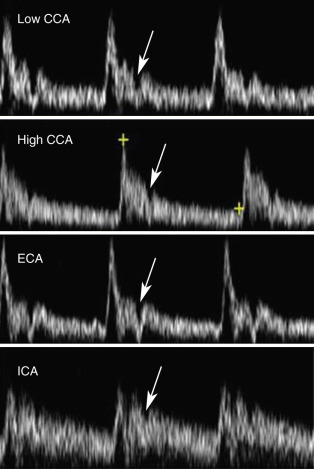
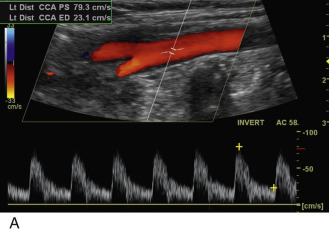
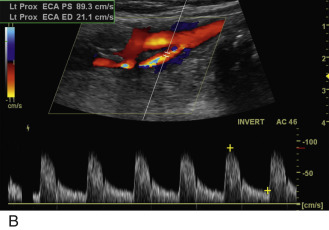
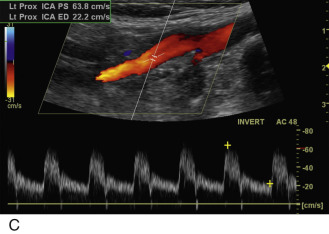
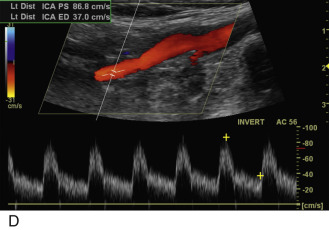
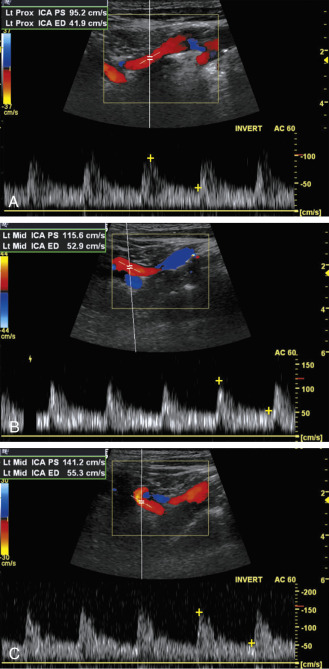
The features of the common, external, and internal carotid spectral Doppler waveforms are distinct from each other ( Fig. 5.6 ), and changes in the Doppler tracings can offer clues to the presence of occlusive disease. The pulsatile contour of Doppler waveforms can be used to distinguish the ICA and ECA. The ECA has a very pulsatile appearance during the second half of systole extending to the dicrotic notch that is due to reflected arterial waves from its branches. The appearance of the ICA is less pulsatile. The diastolic components of the waveforms also show typical differences with the ICA having a persistent and dominant diastolic component, while the ECA may show little or no blood flow during diastole (see Fig. 5.6 ). The CCA shares the characteristics of both arteries: it maintains some pulsatility that is less than the ECA and has forward diastolic flow that is greater than the ECA but less than the ICA. These features (illustrated in Fig. 5.6 ) are considered to be classic findings for each carotid artery. However, there can be overlap in the normal waveforms obtained from the carotid branches. The CCA waveform may not be very pulsatile ( Fig. 5.7A ) and the ECA waveform can sometimes resemble the ICA waveform, particularly in the setting of significant ICA disease (internalization of the ECA) (see Fig. 5.7B ). The typical appearance of the ICA waveform is not always seen in the proximal ICA but should be identified with sampling of the ICA further downstream (toward the head) from the bifurcation (see Fig. 5.7C and D ).
The normal range of velocities in the carotid branches varies as a function of age. Internal carotid artery velocities decrease with age, reaching typical values between 60 and 90 cm/s for ages 60 years and older. However, recent guidelines suggest that the velocity ranges might be lower. Younger patients have higher blood flow velocities, likely a reflection of a higher cardiac output. Blood flow velocities also vary with the physiologic state of the individual, being higher with exercise than at rest. For this reason, the carotid examination should be conducted after the patient has been at rest for 5 to 10 minutes. Peak systolic velocities in the CCA tend to parallel the values in the ICAs. In addition, on average, the common carotid blood flow velocity in the low neck is 10 to 20 cm/s higher than near the bifurcation. This observation is of considerable importance, as the measured peak systolic velocity ratio (ICA peak systolic velocity/CCA peak systolic velocity; see Chapters 3 and 7 ) will depend on where velocities are sampled in the CCA. The CCA peak systolic velocity should therefore be obtained 2 to 4 cm below the carotid bulb or bifurcation. Because the linear array transducer footprint is typically 4 cm, its distal edge can be placed at the beginning of the bulb and the sampling site selected to be approximately 2 to 4 cm below the beginning of the bulb. The average peak systolic velocity in the ECA is reported as 77 cm/s in normal individuals, and the maximum velocity does not normally exceed 115 cm/s. Considerable patient-to-patient variability occurs in ECA flow velocity in normal individuals because pulsatility varies considerably from one person to another. Some individuals have a sharply spiked systolic peak, whereas others have a more blunted peak (compare Figs. 5.6 and 5.7 ). As discussed in Chapter 1 , the Doppler spectral waveforms are almost always altered in the region of the bulb (see Fig. 5.4 ), a reflection of the complex flow dynamics that occur at this location.
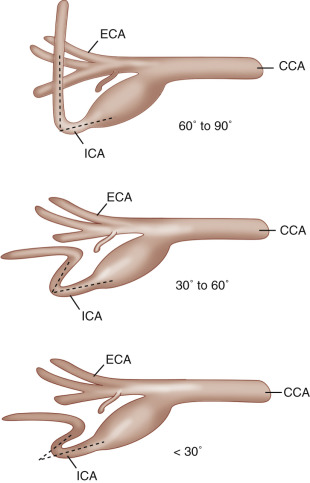
Peak systolic ICA velocities as high as 120 cm/s can be seen in normal individuals, but these values are uncommon, and an ICA velocity exceeding 100 cm/s should be viewed as potentially abnormal except if the patient is younger than 30 years of age. Elevated ICA velocities can be seen in normal carotid arteries that diverge from a straight line and become curved. Elevated velocities are also associated with different degrees of coiling of the artery, ultimately leading to kinking. Examples of carotid kinks are shown in Fig. 5.8 , with the sharp kinks (30 degrees or less) more likely to cause marked and therefore pathologic pressure drops. Blood flow velocities can therefore be elevated as the blood flows into and out of the curved segment. Values up to 150 cm/s can be seen despite the absence of a distinct plaque ( Fig. 5.9 ). Carotid coils causing an S-curve (see Fig. 5.8B and C ) are likely associated with genetic factors and can be linked to fibromuscular dysplasia. However, with time and exposure to elevated blood pressures, these artery segments may develop worsening kinking and require surgical intervention. It is not clear whether the kinks and coils lead to the development of complex lesions such as aneurysms and stenosis.
In summary, sources of elevated velocities in the carotid arteries include: young age, atherosclerotic or other stenotic lesions, artery curvature, and increased cardiac output. Elevated blood pressure, by itself, should not significantly elevate carotid artery blood flow velocities ( Table 5.1 ).
- •
The carotid artery wall is composed of three layers: the intima, the media, and the adventitia.
- •
The distribution of blood flow velocity across the diameter of the artery follows a parabolic pattern with slowest velocity near the vessel wall and the fastest velocity near the center.
- •
The ICA has a typical low-resistance waveform that reflects the low resistance of the cerebral circulation. Normal velocities range from 60 to 90 cm/s.
- •
The ECA has a higher resistance pattern because it supplies the soft tissues of the face and neck.
- •
Doppler spectral waveforms are almost always altered in the region of the bulb, a reflection of the complex flow dynamics that occur at this location.
Related posts:
 Doppler Flow Imaging and Spectral Analysis
 Ultrasound Diagnosis of Lower Extremity Venous Thrombosis
 Evaluating Carotid Plaque and Carotid Intima-Media Thickness
 Assessment of Upper Extremity Arterial Disease
 Ultrasound Assessment Following Endovascular Aortic Aneurysm Repair
 Evaluation of Organ Transplants
Stay updated, free articles. Join our Telegram channel

Full access? Get Clinical Tree


