Fig. 1
Example of a whole slide image of breast tissue. Digital images of whole tissue sections are very large. This particular tissue section has been acquired at 20X resolution and the resulting image size is  pixels. While pathologists are trained on what areas of the tissue they need to focus, it is very difficult to construct analysis methods that mimic this process. As it is necessary to assess morphological properties of individual cells, it is, clear that the analysis of such tissue samples needs to take several different resolutions into account
 pixels. While pathologists are trained on what areas of the tissue they need to focus, it is very difficult to construct analysis methods that mimic this process. As it is necessary to assess morphological properties of individual cells, it is, clear that the analysis of such tissue samples needs to take several different resolutions into account
The field of digital microscopy is relatively new and it can be seen as a one of the key technologies that researchers use to increase our understanding of cancer. It promises to bring precision medicine to regular clinical practice with the goal of improving early detection, prognosis, and treatment [3, 4]. It is now possible to capture very rich information from tissue samples and cancer biopsies in form of high resolution images that can be reviewed on any computer rather than a dedicated microscope. This has already redefined clinical workflows and enabled methods of collaboration that have not been possible before [5, 6]. The impact of this digitization process will go beyond the way in how histology and cytology images are stored, viewed, analyzed and shared. Like Computer Assisted Diagnosis (CAD) enabled by advanced algorithms revolutionized certain radiology tasks, the evolving field of computational pathology will enable new methods of fully automated and user assisted diagnosis [4, 7, 8].


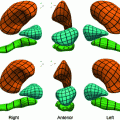
Fig. 2
Tissue analysis challenges. Most traditional histology methods are based on thin tissue sections. In that sense the histology slide is only a sample of the overall three dimensional tissue block. The graphic on the left (a) illustrates how this sampling process affects the appearance of individual cells. It is, for example, clear that not every cellular region needs to contain a nucleus. The tissue sections on the right give an example how disease can effect tissue architecture. Morphology of (b) breast cancer and (c) breast normal tissue
Guidelines like the Gleason Score [9] or the Nottingham Prognostic Index [10] include measurements such as the shape and size of nuclei. For example, in breast cancer nuclei size and mitotic features are diagnostic indicators. While anatomical atlantes [11] can greatly enhance our understanding of disease at the organ level, such prior knowledge is not available for analyzing the complex tumor heterogeneity at the microscopic scale. One of the major challenges in current pathology is human subjectivity in clinical assessment. Among the major benefits of integrating automated image analysis in clinical workflows are: objective quantification, study reproducibility, and consistency. The structure and appearance of the tumor microenvironment varies greatly according to the function of each specific organ [5, 12–14]. The major challenges towards a comprehensive framework in computational pathology and histopathology can be summarized as:
As part of a novel fluorescent multiplexing method, referred to as MultiOmyx and described in detail by Gerdes et al. [13], we have developed a single cell segmentation framework for tissue images. The hallmark of the MultiOmyx
 process is the ability to image a large number of protein targets in a single tissue section. The overall goal of this segmentation framework is the detection and precise delineation of individual cells. This information is then compiled into a map of the tissue. Subsequently this tissue map is used to quantify the expression of the set of protein markers at a single cell level.
Complex cell morphology. Cells are three-dimensional objects, and the corresponding microscopy image captures are two-dimensional projections which correspond to the slice of the tissue. Figure 2a illustrates examples of partial cell volumes at different focal planes.
Tissue architecture. Tissue morphology varies greatly from organ to organ. Different organs and tissue types exemplify different tissue parenchymal architecture and stromal components. Cancer tissue shows very different morphological features from normal tissue even in their original organs. Figure 2b and c show different tissue architectures in breast cancer and normal tissue respectively.
Process variability. There are a number of sources of variability including pre-analytical variables such as how tissues are fixed, processed, stored, and sectioned and analytical variables such as staining protocol, image acquisition and instrumentation.
 and described in detail by Gerdes et al. [13], we have developed a single cell segmentation framework for tissue images. The hallmark of the MultiOmyx
 process is the ability to image a large number of protein targets in a single tissue section. The overall goal of this segmentation framework is the detection and precise delineation of individual cells. This information is then compiled into a map of the tissue. Subsequently this tissue map is used to quantify the expression of the set of protein markers at a single cell level.
As part of different preclinical studies, this new imaging process is being applied to a large morphological variations of different tissue types and disease states. Hence our segmentation framework needs to handle a broad range of morphological variations. The concrete example of a lung and colon cancer dataset will be presented. In order to achieve more robust and reliable segmentation results, we have explored the utility of a shape ranking algorithm. Our focus here is the review of algorithm development, the discussion of the merits of the proposed method in context of a concrete study, and the presentation of some recent performance improvements.
The organization of this Chapter is the following. In Sect. 2, we will review relevant methods for data tissue analysis based on pattern recognition approaches and tissue morphological reconstruction. In Sect. 3, we will outline the GE MultiOmyx imaging for acquiring immunohistochemistry (IHC) multiplexing imaging, in Sect. 4 we will present our cell shape segmentation algorithm. Results and discussion will be presented in Sects. 5 and 6 respectively. Finally in Sect. 7 we will present our future work.
 imaging for acquiring immunohistochemistry (IHC) multiplexing imaging, in Sect. 4 we will present our cell shape segmentation algorithm. Results and discussion will be presented in Sects. 5 and 6 respectively. Finally in Sect. 7 we will present our future work.
2 Related Literature
As part of this Chapter we review a set of methods that enhance the ability of extracting the local tissue architecture in order to construct a tissue map. The limited space available does not permit a comprehensive review of relevant literature as many of the established image segmentation approaches have been adopted to cell and tissue image analysis. For a detailed review of image analysis methods in tissue histopathology we direct the reader to Gurcan et al. [8]. Here we would like to differentiate between approaches that focus on the extraction of disease specific patterns or signatures and methods that apply model-based algorithms to reconstruct the architecture of the tissue. In Sect. 2.1 we summarize recent research [7, 15–22] that makes extensive use of sophisticated feature extraction techniques and machine learning algorithms. The second group, related to the model-based approaches for reconstructing the tissue morphology at the individual cell level [23–30] are reviewed in Sect. 2.2.
2.1 Pattern Recognition Methods
Doyle et al. [18, 19] presented a Bayesian multi-resolution classification method for prostate cancer tissue from whole slide histopathology images. The approach is based on extracting a number of intensity and texture based statistics at different resolution levels and deriving a Bayesian classification method. In Basavanhally et al. [16] a learning-based method for detection and grading lymphocytic infiltration in breast cancer tissue using histopathology images was proposed. The method automatically segments lymphocytes using region growing and Markov random field algorithms. A graph representation then is constructed from the segmented lymphocytes, defining fifty features used for lymphocytic classification. The method was applied to approximately one hundred images obtained from fifty eight patients. Monaco et al. [15] used a Markov Random Field to train a model for identifying glands from training data. While the model effectively deals with the wide variety of shapes, it focuses on segmenting and labeling regions and does not highlight individual cells.
Kaynig et al. [17] introduced an energy function that incorporates the probability output from a random forest classifier. The goal of this approach is to improve the segmentation of elongated structures (e.g., membranes) in electron microscopy images. Their model combines a discriminative model for membrane appearance learned from training data with perceptual grouping. The effectiveness of incorporating additional shape priors [31] that are identified through supervised training has been demonstrated recently. A graph-based method for mitosis identification in breast cancer in whole tissue slides is proposed by Roullier et al. [22]. The approach consisted of decomposing the whole image at multiple resolution levels and performing a graph-based clustering approach using a number of image features at different resolution levels.
2.2 Model-Based Methods
Typically, cell detection relies on structural markers that include nuclei and membrane markers [32, 33]. A variation of the watershed segmentation was presented by Na and Heru [33] to segment milk somatic cell images. The proposed method addresses the typical over-segmentation obtained from the watershed algorithm. Srinivasa et al. [34] proposed an active mask algorithm for cell segmentation in fluorescence microscope images based on punctate patterns. Their method is inspired by active-contour methods and multiresolution methods. The authors demonstrated their method in HeLa cells.
In Xiao et al. [35], a method for segmenting stem cells is proposed. The algorithm uses a morphological descriptor for cellular shapes in terms of a “symmetry axis transformation”. The method accounts for morphological changes that are induced by cell growth. A method for segmenting cells for in-situ microscopy is presented in Martinez et al. [36]. Here the instrument is positioned inside a bioreactor in order to monitor cell culture processes. The method relies on a bubble segmentation algorithm which is based on shape from shading. Cells are segmented based on closed boundaries that are extracted from thresholding a depth map by applying Bichsel and Pentland’s original shape from shading algorithm. A framework for supervised cell-image segmentation and a touching-cell splitting method is proposed by Kong et al. [37]. In this work cells are segmented by classifying the image pixels into either cell or extra-cellular category. The classification algorithm uses the color-texture extracted at the local neighborhood of each pixel. Local features utilized by the classification algorithm rely on a local Fourier transform from a color space.
Recently, a number of learning-based techniques have been suggested. Xiaong [38] proposed the use of computer generated models to provide synthesized images of healthy red blood cell populations. In order to develop cell segmentation and counting algorithms, learning-based techniques were used. The estimation of average cell shape and deformation was inferred from the synthetic models. Park [39] presented a watershed-based algorithm for the segmentation of clustered cells. The method incorporates specific image color-knowledge using the watershed transform with iterative shape alignment to segment the cell shape. Extensions to 3D segmentation include segmenting the spots in cDNA microarray images [40]. The segmentation is represented in a three-dimensional (3-D) space by a 3-D spot model posed via an optimization problem, which is solved by a genetic algorithm. The 3D segmentation is provided by contours of the 3-D spot models.
Given a set of training images Lempitsky and Zisserman [41] proposed to learn a linear classifier that allows cell counting. This approach is very general and has been applied to live cell data. The concept of learning from dot annotations has been applied by Arteta et al. [42] to detect cell like structures from a broad number of candidate regions that have been scored with a learning based measure such that the solution is globally optimal. Their approach has been successfully applied to different microscopy techniques. The major limitation of both approaches is that the segmentation does not use morphological assessment of individual cells. In a similar path, hierarchical segmentation schemes have been suggested to splitand merge cells [24, 26]. These models use supervised learning and enforce spatialconsistency through Markov random fields [26].
Here we are building on both of these developments to formulate an unsupervised cell segmentation method for epithelial cells that incorporates shape clues to dynamically adapt the segmentation to the cell shape and morphology. Based on statistical shape analysis we propose a framework for simultaneous cell classification and detection in tumor tissue with very heterogeneous morphology. The key idea is to optimize the cell segmentation according to the tumor tissue morphology via cell shape descriptors. This process is equivalent to solving in non-polynomial time an optimization problem, and here we propose an efficient solution via sparse random sampling.
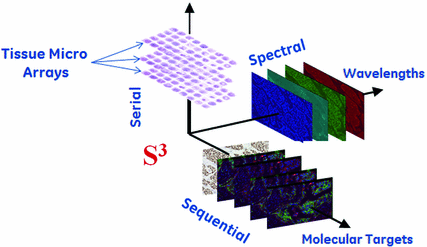

Fig. 3
3 Multiplexed Fluorescence Microscopy
Sequential multiplexed immunofluorescence is a powerful technique for understanding the complex interaction of different proteins in tissues while keeping the tissue morphology in context. We describe a novel image analysis method for an extended panel of biomarkers on a single, formalin-fixed paraffin embedded tissue section. We will provide a brief overview of the GE MultiOmyx methodology, for more details, we refer the reader to a more detail presentation in Gerdes et al [13]. We utilize a novel technology for simultaneous co-localization of multiple protein biomarkers on a single formalin-fixed paraffin embedded tissue section or core biopsy. The core of this technology is denoted as MultiOmyx
 and it has been developed at GE Global Research (Niskayuna, NY; USA). It comprises of a repeated stain-image-bleach and de-stain sequence using direct antibody-fluorophor conjugation [43–46]. Figure 3 illustrates the concept of applying MultiOmyx
 in Tissue Micro-Arrays (TMAs).1 This technology allows the simultaneous detection of multiple protein expressions at the individual cell level, revealing not only the complex morphology of the cancer tissue but the expression patterns of different molecules in each individual cell.
 methodology, for more details, we refer the reader to a more detail presentation in Gerdes et al [13]. We utilize a novel technology for simultaneous co-localization of multiple protein biomarkers on a single formalin-fixed paraffin embedded tissue section or core biopsy. The core of this technology is denoted as MultiOmyx
 and it has been developed at GE Global Research (Niskayuna, NY; USA). It comprises of a repeated stain-image-bleach and de-stain sequence using direct antibody-fluorophor conjugation [43–46]. Figure 3 illustrates the concept of applying MultiOmyx
 in Tissue Micro-Arrays (TMAs).1 This technology allows the simultaneous detection of multiple protein expressions at the individual cell level, revealing not only the complex morphology of the cancer tissue but the expression patterns of different molecules in each individual cell.
We have applied the MultiOmyx to two TMAs using two different tissue types: lung and colon with approximately 100 images in each tissue type. Images were acquired at 20X magnification, a numerical aperture of 0.75, a pixel size of 0.37
  m. We used a customized Olympus
 microscope with filters tuned to the emission wavelength of three dyes: cyanine3 (Cy3, emits at 570 nm); cyanine5 (Cy5, 670 nm); and 46-diamidino-2-phenylindole (DAPI, 460 nm). Image size was set to 2048
  2048 pixels, using 12-bit digital camera. Tissue sections were 4
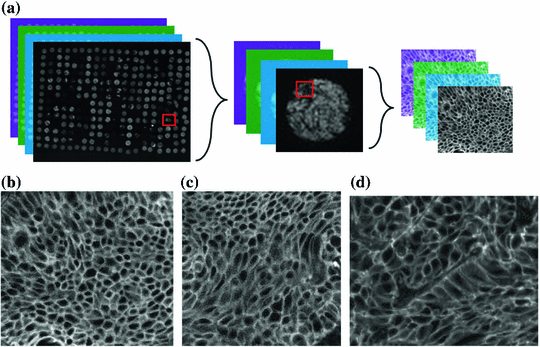
  m thick and they were fixed in paraffin. Modeling the inherent variability of the biological specimen combined with the image-to-image variation is the major challenges through robust tissue processing and analysis. Biomarker abundance, fixation methods, sectioning, and storage could affect the staining process. Different tissue types and, more importantly, different disease states exhibit vastly different morphology and architecture. In order to design computational tools that can, for example, effectively support the quantification of cell phenotypes, algorithms need to capture minute details and tissue specific morphological variations. Figure 4a presents a conceptual representation of the information content in TMA’s. On the left we show a tissue micro-array, in the center a single tumor biopsy, and on the right a selected region of interest corresponding to epithelial tissue. The color images in the back, represent different excitation wavelengths corresponding to DAPI, Cy3, Cy5 channels and they target different molecular protein targets. Figure 4b–d present representative examples of epithelial cells in lung tissue exhibiting very different cell morphology. Cells in Fig. 4b, c show relatively uniformity in cell size and shape, whereas cells in Fig. 4d the show heterogeneous shape and size. Here we are combining general purpose segmentation with unsupervised machine learning techniques to construct algorithms that are robust while capturing phenotypically relevant information.
 to two TMAs using two different tissue types: lung and colon with approximately 100 images in each tissue type. Images were acquired at 20X magnification, a numerical aperture of 0.75, a pixel size of 0.37
  m. We used a customized Olympus
 microscope with filters tuned to the emission wavelength of three dyes: cyanine3 (Cy3, emits at 570 nm); cyanine5 (Cy5, 670 nm); and 46-diamidino-2-phenylindole (DAPI, 460 nm). Image size was set to 2048
  2048 pixels, using 12-bit digital camera. Tissue sections were 4
  m thick and they were fixed in paraffin. Modeling the inherent variability of the biological specimen combined with the image-to-image variation is the major challenges through robust tissue processing and analysis. Biomarker abundance, fixation methods, sectioning, and storage could affect the staining process. Different tissue types and, more importantly, different disease states exhibit vastly different morphology and architecture. In order to design computational tools that can, for example, effectively support the quantification of cell phenotypes, algorithms need to capture minute details and tissue specific morphological variations. Figure 4a presents a conceptual representation of the information content in TMA’s. On the left we show a tissue micro-array, in the center a single tumor biopsy, and on the right a selected region of interest corresponding to epithelial tissue. The color images in the back, represent different excitation wavelengths corresponding to DAPI, Cy3, Cy5 channels and they target different molecular protein targets. Figure 4b–d present representative examples of epithelial cells in lung tissue exhibiting very different cell morphology. Cells in Fig. 4b, c show relatively uniformity in cell size and shape, whereas cells in Fig. 4d the show heterogeneous shape and size. Here we are combining general purpose segmentation with unsupervised machine learning techniques to construct algorithms that are robust while capturing phenotypically relevant information.
Fig. 4
Morphological heterogeneity in lung cancer tissue. Illustration of tissue micro-arrays and example of different size and morphology of epithelial cells from lung cancer tissue. a Regions of interest in tissue micro-arrays. Color images correspond to different excitation wavelengths corresponding to different molecular protein targets. Cells exhibiting: b smaller size, c medium size, and d larger size. Note the homogeneity of cell morphology and shape in b and c but the cell hetero- geneity in d
4 Cell Segmentation via Shape Ranking
The image analysis workflow of the MultiOmyx process has been presented in more detail in [47]. In this chapter we focus on improving the robustness and fidelity of the cell segmentation algorithm. The current version of the single cell segmentation framework is based on a variant of a hierarchical watershed segmentation. For the purpose of this discussion, the reader can assume that any standard implementation the watershed segmentation can be utilized.
 process has been presented in more detail in [47]. In this chapter we focus on improving the robustness and fidelity of the cell segmentation algorithm. The current version of the single cell segmentation framework is based on a variant of a hierarchical watershed segmentation. For the purpose of this discussion, the reader can assume that any standard implementation the watershed segmentation can be utilized.
This approach is inspired by the idea of capturing the shape distribution for a given image class. Assuming that the available segmentation results are of reasonable quality, (i.e., the majority is correct) regions that correspond segmentation errors will be outliers of this shape distribution. Here we use a shape descriptor to capture the tissue’s shape distribution. Based on this ranking function it is then possible to identify the regions in the hierarchical segmentation that rank high with respect to the given shape model.
4.1 Shape Ranking
The main idea of cell ranking is that abnormal objects can be consider to be outliers and they are likely the outcome of an error during the segmentation process. Assuming that the cell shape distribution is Gaussian-like, we aim to optimize the segmentation from a family of known parameters by minimizing the number of outliers during multiple segmentations. We presented a ranking method that maximizes the shape similarity using the k-nearest neighbors in [48]. While computing object similarity using k-nearest neighbor is computationally efficient, estimating a similarity matrix for a very large number of objects can be computationally very expensive. In this work, we propose to increase the efficiency of the cell ranking algorithm while preserving the fidelity of the shape ranking metric. Rather than estimating the object-to-object shape similarity from k-nearest neighbors, we propose to select an uniformed distributed sub-sample of the population.
Let  be a set of points, and
  a uniformly distributed sample, for
  , let
, let  represents the k-nearest neighbors within
  . We then define the cost of every element of
  within
  as:
as:

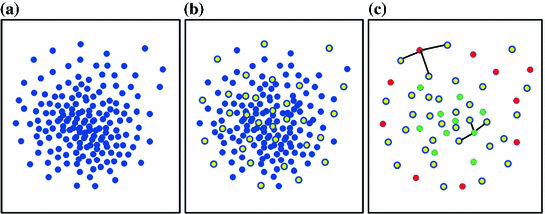
where  is a distance metric. Figure 5 illustrates the idea of the of the sub-sampling and ranking. Figure 5a and b shows all points in
  (blue) and
  (yellow). Figure 5c shows outliers (red) and normal (green) points. Note that according to our definition of similarity, the ranking of
  is obtained from the cost
  and indicates the degree of “abnormality”; that is, top candidates in the ranking have a high probability of being segmented correctly.
 be a set of points, and
  a uniformly distributed sample, for
  , let
, let  represents the k-nearest neighbors within
  . We then define the cost of every element of
  within
  as:
as:
(1)
 is a distance metric. Figure 5 illustrates the idea of the of the sub-sampling and ranking. Figure 5a and b shows all points in
  (blue) and
  (yellow). Figure 5c shows outliers (red) and normal (green) points. Note that according to our definition of similarity, the ranking of
  is obtained from the cost
  and indicates the degree of “abnormality”; that is, top candidates in the ranking have a high probability of being segmented correctly.

