This article outlines a practical imaging approach to CNS infection and reviews 5 basic imaging patterns commonly seen: (1) extra-axial lesion, (2) ring-enhancing lesion, (3) temporal lobe lesion, (4) basal ganglia lesion, and (5) white matter abnormality. Opportunistic infections in the setting of HIV are also discussed within the context of these 5 basic imaging patterns. Characteristic imaging features in conjunction with clinical history are also highlighted in order to narrow the differential diagnosis or suggest a specific diagnosis in some cases.
Infections of the brain and its linings pose a growing, worldwide health problem. Widespread immigration, the emergence of multidrug-resistant strains, and HIV infection have all served to change the face of the diagnosis and imaging of central nervous system (CNS) infections.
The radiologist plays a crucial role in identifying and narrowing the differential diagnosis of CNS infection. This article aims to outline a practical imaging approach, which begins with recognizing 1 of 5 basic imaging patterns: (1) extra-axial lesion, (2) ring-enhancing lesion, (3) temporal lobe lesion, (4) basal ganglia lesion, and (5) white matter abnormality.
Within these broad imaging categories, a thorough understanding of the characteristic imaging features of specific pathogens and clinical history, including patient immune status and geographic location, are essential to narrow the differential considerations and propose a more specific diagnosis.
Neuroimaging also plays a pivotal role in diagnosing and monitoring the therapeutic response in opportunistic infections in the setting of HIV. This subset of infections will also be discussed within the context of the 5 basic imaging patterns.
Imaging modalities
CT is often the first imaging study for the evaluation of suspected CNS infection because of its widespread availability and rapid assessment of complications such as hydrocephalus, mass effect/herniation, and hemorrhage. CT is critical in the emergency room setting to identify these neurosurgical emergencies. However, MRI is the study of choice for further characterization of CNS infection, and it is more sensitive for the identification of leptomeningitis, empyema, ventriculitis, and complications, such as cerebral infarction. The most important MR sequences in this setting include the following:
- •
Diffusion-weighted imaging (DWI)
- •
Fluid attenuated inversion recovery (FLAIR)
- •
T2-weighted (T2W)
- •
T1-weighted post-gadolinium (GAD)
- •
Magnetic resonance spectroscopy (MRS).
Diffusion-weighted imaging (DWI) plays an important role in differentiating a pyogenic abscess from other ring-enhancing lesions. Pyogenic abscesses classically have reduced diffusion (“light bulb bright diffusion”), which is thought to reflect the high viscosity of inflammatory cells. However, reduced diffusion is not specific to pyogenic abscess, and it may be present in other ring-enhancing lesions, including hypercellular tumor, subacute hematomas, and nonpyogenic infections. DWI is also useful in detecting and characterizing extra-axial collections, as subdural empyemas typically have reduced diffusion.
Fluid attenuated inversion recovery (FLAIR) imaging uses an inversion recovery pulse after an inversion time to nullify the high signal of cerebrospinal fluid (CSF). FLAIR is sensitive in detecting leptomeningeal disease because elevated protein in the subarachnoid space (SAS) causes a decrease in T1 relaxation time and resultant hyperintensity. In spite of the high sensitivity of FLAIR images in the detection of abnormal SAS hyperintensity, this finding is not specific for leptomeningitis; it may also be encountered with leptomeningeal tumor, subarachnoid hemorrhage, supplemental O 2 administration, and severe arterial occlusive disease with slow flow in leptomeningeal collaterals.
T2-weighted (T2W) imaging is most helpful for evaluation the core signal intensity of ring-enhancing lesions, and to define the extent of surrounding vasogenic edema. T1-weighted post-gadolinium (GAD) imaging is critical to evaluate the enhancement characteristics of infectious etiologies. Specific patterns are discussed in the section on imaging patterns to follow.
Magnetic resonance spectroscopy (MRS) shows increases in lactate (1.3 ppm), acetate (1.92 ppm), and succinate (2.4 ppm) in pyogenic abscesses, presumably from the enhanced glycolysis and fermentation of the organism. Amino acids, including valine and leucine (0.9 ppm), are also known to be the end products of proteolysis by enzymes released by neutrophils in pus. Detection of resonance peaks from acetate, succinate, and such amino acids as valine and leucine is suggestive of abscess, as they have not been reported in proton MR spectra of brain tumors.
Imaging patterns
Extra-axial
With this imaging pattern, it is key to search the paranasal sinuses, middle ear, and mastoid air cells for a source. It is also very important to look for complications including brain abscess, dural sinus thrombosis, infarction, and hydrocephalus.
Epidural empyema
An epidural abscess and/or empyema most commonly extends from the paranasal sinuses, especially the frontal sinus. Extension may be via direct bony erosion or retrograde flow via valveless bridging veins. Other etiologies include recent surgery, trauma, and mastoiditis. This purulent collection localizes outside the dura, which protects the underlying brain parenchyma. Therefore, patients with an epidural empyema tend to have a more benign, insidious course than those with a subdural empyema. Patients often complain only of a fever and headache.
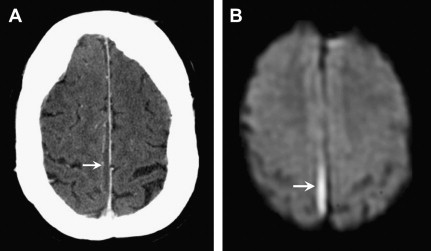
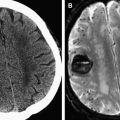
On imaging, epidural abscesses are lentiform in shape, tacked down at the sutures, but they can cross the midline, unlike subdural collections ( Fig. 1 ). The MR signal characteristics include T1 hypointensity, which is brighter than pure CSF given its proteinaceous content and inflammatory debris, and T2 hyperintensity, approaching CSF intensity. On post-GAD images, there is profound enhancement of the inflamed dura, often more than seen in subdural empyemas. Another important imaging feature of epidural empyemas is the relatively normal appearance of the underlying brain parenchyma in contrast to subdural empyemas. Empyemas classically have reduced diffusion. However, the DWI signal characteristics can be more complex in epidural as opposed to subdural empyemas. Because epidural empyemas tend to have a more prolonged course, portions of the lesion may become less viscous, allowing for mixed intensity on DWI. Please refer to “ Acute Neuro-Interventional Therapies ,” elsewhere in this issue, for additional imaging information.

Key Imaging Features: Epidural Empyema
- •
Lentiform collection
- •
Reduced diffusion
- •
Look for source in paranasal sinuses or mastoid air cells.
Subdural empyema
The source of most subdural empyemas is also sinusitis or mastoiditis, with frontal sinusitis accounting for most cases. Other etiologies include prior trauma with a superinfected subdural hematoma, postcraniotomy, or a complication of meningitis. Patients may present with fever, headache, seizures, and focal neurologic deficits. The subdural empyema is a medical emergency and usually requires neurosurgical intervention.
Neuroimaging plays a key role in early diagnosis and characterization. CT is often used acutely because of its speed and widespread availability. It is most useful in defining the extent and degree of mass effect and herniation; however, small subdural empyemas can be missed on CT, especially when located along the inner table of the skull. MRI is helpful in diagnosing and differentiating a subdural empyema from other subdural collections, including a subdural effusion, chronic subdural hematoma, and a subdural hygroma that may mimic an empyema on CT ( Fig. 2 ). Subdural empyemas have similar T1 and T2 signal characteristics to epidural empyemas, and classically show reduced diffusion, identified as high signal on DWI and low signal on the apparent diffusion coefficient (ADC) map.
Key Imaging Features: Subdural Empyema
- •
Reduced diffusion
- •
Look for source in paranasal sinuses or mastoid air cells
Leptomeningitis
Meningitis refers to acute or chronic inflammation of the pia-arachnoid layers and the adjacent CSF. It may be viral, bacterial, or fungal. The diagnosis usually is based on clinical history, physical examination, and CSF analysis, with imaging playing a limited role. The clinical presentation is often characteristic, with fever, headache, neck stiffness, vomiting, and photophobia being most common.
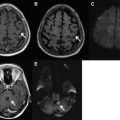
Imaging is most useful to evaluate the complications of meningitis, including vascular thrombosis, infarctions, brain abscess, ventriculitis, hydrocephalus, and extra-axial empyemas. Post-GAD and FLAIR sequences are most sensitive for detecting abnormal meningeal enhancement and SAS disease, respectively. DWI is particularly helpful in the identification of complications, such as infarction or subdural empyema. Acute bacterial or viral meningitis typically shows enhancement over the cerebrum and interhemispheric fissure, whereas chronic tuberculous or fungal meningitis classically shows enhancement in the basal cisterns ( Fig. 3 ).
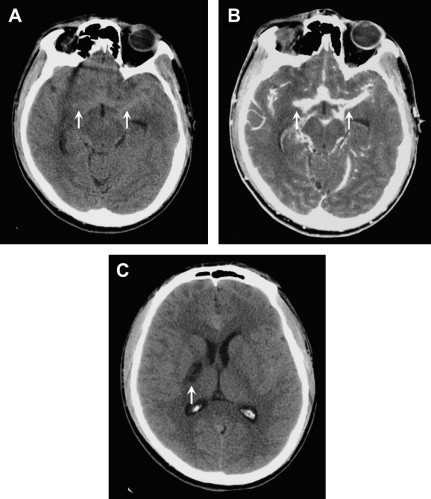
Tuberculous meningitis, the most common presentation of neurotuberculosis, occurs predominately in young children and adolescents. It usually presents as a long-standing insidious process with exuberant inflammation of the basilar meninges and an obliterative vasculopathy of the basal penetrating vessels. Most infarcts are thus seen in the basal ganglia and internal capsule (see Fig. 3 C). The common imaging triad consists of basal meningeal enhancement, hydrocephalus, and cerebral infarction. Leptomeningeal enhancement is not specific for infectious meningitis, and can also be seen with carcinomatous meningitis, sarcoidosis, or chemical meningitis.
Key Imaging Features: Leptomeningitis
- •
SAS hyperintensity on FLAIR
- •
Leptomeningeal enhancement
- •
Look for hydrocephalus and infarctions as complications.
Ring-enhancing Lesions
This imaging pattern is the classic mimicker, and there is a long list of differential considerations. Frequently, the primary differential can be narrowed to infection versus neoplasm; however, close attention to the imaging features is critical to recognize nonoperative ring-enhancing lesions such as tumefactive demyelination, subacute infarct, and subacute hematoma. The imaging characteristics that favor infection over neoplasm include a thin, smooth, ring-enhancement, “daughter cysts,” a thinner ring of enhancement toward the ventricular surface, and, of course, the “light bulb bright DWI” of a pyogenic abscess.
Pyogenic abscess
Pyogenic abscesses can arise from hematogenous dissemination, direct inoculation (trauma or surgery), contiguous extension (paranasal sinus, middle ear, mastoids), or complicating meningitis. The evolution of a pyogenic abscess progresses through 4 stages over approximately 2 weeks: (1) early cerebritis, (2) late cerebritis, (3) early abscess/capsule, and (4) late abscess/capsule. The MRI features of cerebritis and abscess depend on the stage of this infectious process.
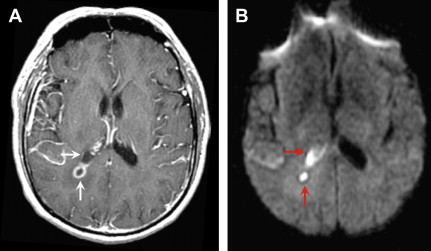
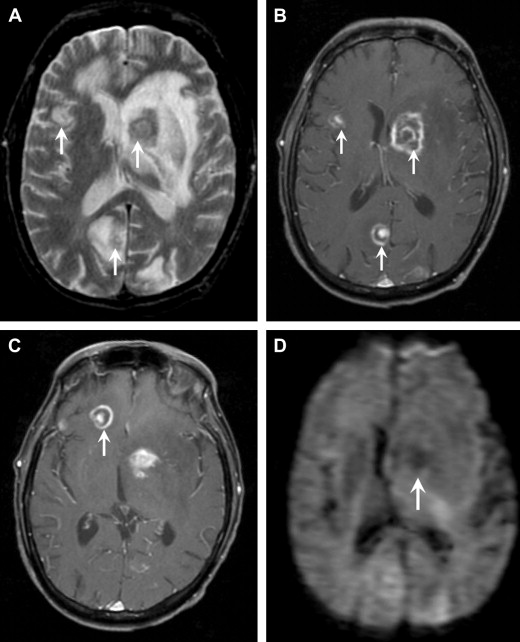
In the early cerebritis stage, ill-defined T1 hypointensity and T2 hyperintensity are noted, with mottled heterogeneous enhancement. As the infection matures, the necrotic debris accumulates centrally and the body attempts to isolate the infection with a collagenous capsule. Centrally, the abscess cavity is T1 hypointense (but slightly higher than CSF) and T2 hyperintense ( Fig. 4 ). The abscess capsule is iso- or slightly hyperintense on T1-weighted images and markedly hypointense on T2-weighted imaging; this is thought to be secondary to paramagnetic hemoglobin degradation products or free radicals in macrophages. On post-GAD images, a thin, smooth ring is characteristic, in contrast to necrotic tumors, which typically have a thick nodular ring enhancement ( Fig. 5 ). Another important feature of a brain abscess is its tendency to “grow toward the white matter,” resulting in an oval configuration with a thicker enhancing capsule toward the more well-vascularized cortex. The thinner capsule abutting the white matter helps explain the propensity for intraventricular rupture and subsequent ventriculitis. Imaging features of ventriculitis/ependymitis include enhancement of the ventricular wall and reduced diffusion ( Fig. 6 ). Ventriculitis is rarely isolated and usually occurs in the setting of abscess rupture, meningitis, or shunting and increases mortality to 80%.

DWI is extremely useful in identifying a brain abscess. As mentioned previously, the pyogenic brain abscess typically has “light bulb bright” diffusion signal intensity with corresponding low ADC values. Although some tumors can have low ADC values because of hypercellularity, the necrotic or cystic portions are usually less cellular and therefore do not show the same reduced diffusion.
Key Imaging Features: Pyogenic Abscess
- •
“Light bulb bright” DWI
- •
Central T2 hyperintensity
- •
T2 hypointense capsule.
Tuberculoma
A global increase in the incidence of tuberculosis (TB) can be attributed to increased immigration, AIDS, and multidrug-resistant strains. CNS infection with Mycobacterium tuberculosis can present as either of the following:
- •
Diffuse form (eg, basal exudative leptomeningitis, as discussed previously)
- •
Localized form (eg, tuberculoma, abscess, or cerebritis).
The most common parenchymal form of CNS TB is tuberculous granuloma (tuberculoma). In some countries, TB represents up to 10% to 30% of all focal intracranial masses.
Parenchymal TB is more common in HIV-infected patients, can be solitary or multiple, and can occur with or without meningitis. There is hematogenous spread in cases of known pulmonary TB.
Tuberculomas occur at the corticomedullary junction and are more common infratentorially in children and supratentorially in adults. The clinical presentation is often related to the space-occupying mass effect (ie, seizures, focal neurologic signs, headache, papilledema) rather than to the infection.
The MRI features depend on whether the granuloma is noncaseating, solid-caseating, or cystic-caseating. Noncaseating granulomas are T2 hypointense and solidly enhancing. Caseating granulomas have smooth ring enhancement. Solid caseating granulomas have characteristic T2 hypointensity ( Fig. 7 ), whereas cystic-caseating granulomas have central T2 hyperintensity similar to pyogenic abscess. The dark T2 signal is thought to be caused by free radicals, and the solid caseation signal is attributed to cellular density. Finally, the tuberculous abscess is a rare complication developing from parenchymal granulomas that are teeming with tubercle bacilli. Similar to cystic-caseating granulomas, these lesions show central T2 hyperintensity and even reduced diffusion, which can therefore mimic pyogenic abscess. Some investigators suggest that MRS may help differentiate tubercular abscess from pyogenic abscess. Specifically, identification of the amino acids acetate and succinate are found in pyogenic abscesses, but lipid peaks are found in tubercular abscesses.
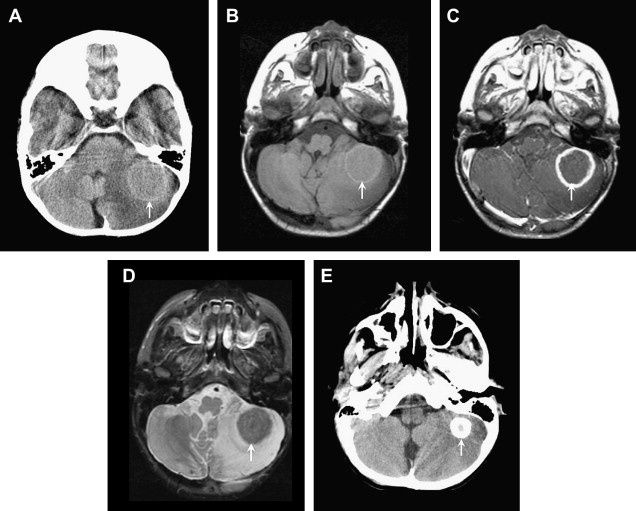
Key Imaging Feature: Tuberculoma
- •
Central T2 hypointensity in noncaseating and solid caseating tuberculomas, ± reduced diffusion.
Neurocysticercosis
Neurocysticercosis, caused by the pork tapeworm Taenia solium, is the most common parasitic infection of the CNS in immunocompetent individuals. Endemic in Latin America and parts of Asia, India, Africa, and Eastern Europe, it is the most common cause of seizures in young patients in developing countries with poor hygiene. Neurocysticercosis may involve the brain parenchyma, the subarachnoid space, and the ventricles.
CT and MRI findings in parenchymal neurocysticercosis depend on the stage of development of the parasite. Four stages have been categorized : (1) viable/vesicular, (2) colloidal, (3) nodular-granular, and (4) calcified.
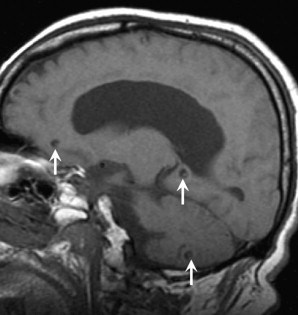
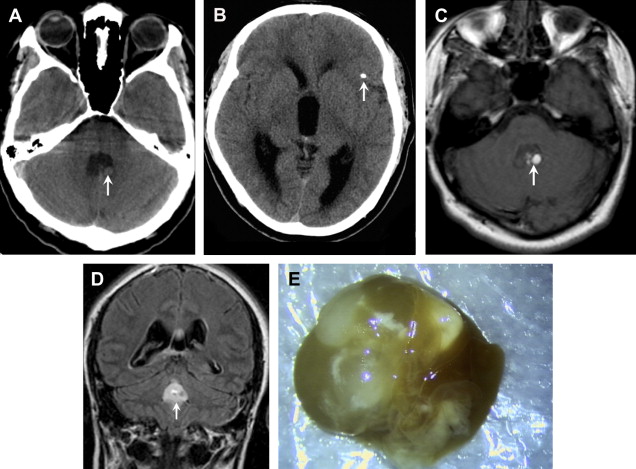
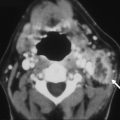
In the first, vesicular, stage, small cysts follow CSF density on CT and CSF intensity on MRI, and show little to no enhancement or edema. Most of these lesions have a “cyst with a dot” appearance representing an eccentric scolex ( Fig. 8 ).
Colloidal lesions develop ring enhancement and surrounding edema as the parasite degenerates and triggers the host immune response. MRI characteristics in the second colloidal phase include central T1 hypointensity, central T2 hyperintensity, ring-enhancement, and increased diffusion ( Fig. 9 ).

During the nodular-granular phase, the cyst wall thickens, the cyst involutes, and the surrounding edema decreases.
Finally, the lesion mineralizes in the calcified stage and appears as small parenchymal calcifications on CT and small areas of susceptibility on MR gradient sequences (see Fig. 9 D, E).
The colloidal stage mimics other ring-enhancing lesions. In these cases, DWI may be helpful to differentiate a cysticercosis cyst from a pyogenic abscess because cysticercal cysts are dark. Also, ADC values are higher in neurocysticercosis than in TB granulomas.
Subarachnoid lesions may be small in the cortical sulci, but are often large and “grapelike” when located in the basilar cisterns or Sylvian fissures. In the past, the term “racemose” referred to this form in which the scolex was not thought to develop; however, it is now known that the scolex may be present, yet undergoes degeneration, such that the term “racemose” has fallen into disuse. Ruptured subarachnoid lesions may produce a basilar meningitis and lead to vasculitis and lacunar infarction. Ventricular cysticerci are usually isodense to CSF on CT and isointense to CSF on T2-weighted MR imaging, thus making them difficult to detect. Intraventricular cysticercosis occurs in approximately 20% of cases and is most often located in the aqueduct of Sylvius or fourth ventricle. Frequently, the accompanying hydrocephalus is detected before the obstructing cyst is identified. Therefore, FLAIR is a critical sequence to localize intraventricular cysts, because the cysts will appear hyperintense to CSF and become more conspicuous ( Fig. 10 ). Cysts can migrate within the ventricular system (the “ventricular migration sign”) and cause intermittent obstructive hydrocephalus. Treatment includes antiparasitic medications such as oral albendazole, steroids for edema, and antiseizure medications in selected cases.
Key Imaging Features: Neurocysticercosis
- •
Central T2 hyperintensity
- •
Dark DWI ( increased diffusion)
- •
Scolex
- •
Additional calcifications.
Aspergillosis
Invasive CNS aspergillosis is rare, but is seen with increased frequency in immunosuppressed patients, particularly after bone marrow transplantation (BMT). Because humans are infected by inhaling spores, the lungs and paranasal sinuses are the main sites of infection. Cerebral involvement may also result from hematogenous spread from the lungs or direct invasion from the sinuses. Invasive CNS aspergillosis has high morbidity and mortality, but case reports do note survival with early, aggressive antifungal therapy and surgical resection. As clinical and laboratory features do not always confirm the diagnosis, neuroimaging plays a key role.
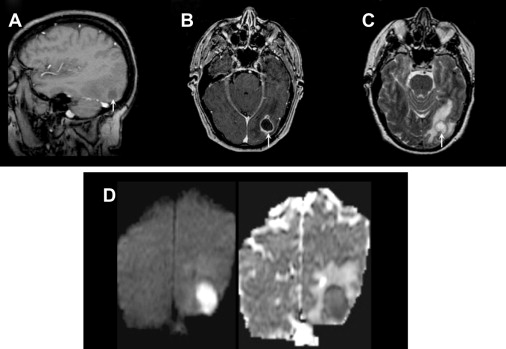
Imaging patterns depend on lesion age and immunologic status of the patient. The angioinvasive nature of the fungus helps explain the CT and MR imaging features of these cortical and subcortical septic infarctions. Aspergillosis also has a unique affinity for perforating arteries that supply the basal ganglia, thalami, and corpus callosum. In severely immunocompromised patients, the lesions appear as poorly defined areas of CT hypodensity or T2 hyperintensity on MRI, without significant mass effect, surrounding edema, or enhancement owing to the lack of a host immune response. In more immunocompetent patients, or as the immune function recovers after BMT, subtle peripheral or ring enhancement may be seen with surrounding vasogenic edema ( Fig. 11 ). Another important clue to the diagnosis is the presence of hemorrhage within these septic infarcts (seen as T1 hyperintensity, T2 hypointensity, and abnormal magnetic susceptibility on gradient sequences). In addition, pyogenic abscesses typically have a smooth outer wall, whereas fungal abscesses tend to have a crenated wall with intracavitary projections. Although early septic infarcts may show reduced diffusion, Luthra and colleagues found reduced diffusion only in the wall and projections of the fungal abscess, whereas the core did not show reduced diffusion, distinguishing it from pyogenic and tubercular abscesses.
Key Imaging Features: Aspergillosis
- •
Angioinvasion with hemorrhage (T2 hypointensity + susceptibility)
- •
Septic infarcts with minimal mass effect and minimal to no enhancement
- •
Ring C+ only as immune function recovers
- •
Mycotic aneurysms.
Toxoplasmosis
Toxoplasmosis is caused by the parasite Toxoplasma gondii and is the most common mass lesion in patients with AIDS. Fortunately, the number of cases has declined significantly within the past decade because of the advent of highly active antiretroviral therapy (HAART). T gondii is an obligate intracellular protozoan that exists in 3 forms: oocysts, tachyzoites, and bradyzoites. Tachyzoites are the rapidly multiplying form and they convert to bradyzoites or tissue cysts when they localize to the CNS. Toxoplasmosis is a ubiquitous organism with titers as high as 70% in the normal adult population. The primary form of transmission is ingestion of undercooked meat, but also blood transfusions, contaminated needles, and contact with cat feces can result in the infection. HIV-infected patients become most susceptible to toxoplasmosis when their CD4 counts are less than 100 cells/μL. The most common presenting symptom is headache, but fever, altered mental status, and focal deficits are also seen.
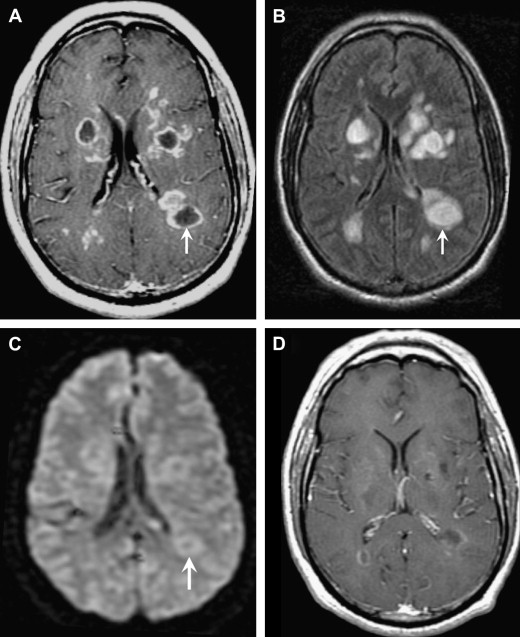
On noncontrast CT, lesions are usually multiple, hypodense, and located in the basal ganglia, thalami, and corticomedullary junction. The lesions frequently calcify after treatment. On MRI, the T2 signal characteristics can be variable, ranging from T2 hyperintense to T2 iso- or even hypointense. On T1-weighted images, the lesions are hypointense, but intrinsic T1 shortening has been described in a few cases, thought to represent hemorrhage. Smooth, ring enhancement is typically seen on post-GAD images, but smaller lesions may have more nodular enhancement. An imaging finding highly suggestive of toxoplasmosis is the “asymmetric target sign,” which consists of a small eccentric nodule of enhancement along the enhancing wall, thought to represent infolding of the cyst wall ( Fig. 12 ). This sign is specific, but not sensitive (seen in ∼30% cases). Recently, a similar target sign has been described on FLAIR and T2-weighted imaging that consists of 3 layers: T2 hypointense core alternating with an intermediate zone of T2 hyperintensity and a T2 hypointense rim. Although DWI signal can be variable in toxoplasmosis, most investigators have found that most lesions have increased diffusion on DWI.
In the HIV-infected patient, the major differential consideration for multiple ring-enhancing lesions is primary CNS lymphoma. Imaging features that favor lymphoma include subependymal spread, reduced diffusion owing to hypercellularity, and corpus callosum involvement. Most patients are treated empirically for toxoplasmosis with pyrimethamine and sulfadiazine for a duration of 6 weeks. Radiographic improvement should occur in most (>90%) patients by 14 days. If a follow-up MRI does not show improvement after empiric therapy, thallium-201 brain single-photon emission computed tomography (SPECT) or fluorodeoxyglucose positron emission tomography (FDG PET) may be useful. Both studies classically show increased uptake only in lymphoma, but have variable sensitivities. Other useful MR techniques include DWI, MRS, and MR perfusion. Lymphoma tends to have reduced diffusion because of its hypercellularity, whereas toxoplasmosis tends to show facilitated diffusion. MRS in lymphoma shows marked elevation of choline owing to hypercellularity and membrane turnover. In contrast, MRS in toxoplasmosis confirms the infectious origin with elevated lactate and lipid peaks. On MR perfusion, because lymphoma is a hypervascular neoplastic process, there is elevated relative cerebral blood volume (rCBV), whereas toxoplasmosis shows decreased rCBV. In persistently equivocal cases, a biopsy is usually the next course of action.
Key Imaging Feature: Toxoplasmosis
- •
Asymmetric or eccentric target sign in the setting of an HIV patient with multiple ring-enhancing lesions.
Acute disseminated encephalomyelitis
Acute disseminated encephalomyelitis (ADEM) is a monophasic inflammatory demyelinating disorder associated with a recent infection or vaccination. Infection or vaccination is thought to trigger an autoimmune attack, possibly via “molecular mimicry.” Patients usually present with nonspecific symptoms, including headache, vomiting, fever, and lethargy. Children are affected more often than adults. On MR imaging, multifocal T2 hyperintense lesions are typically seen in the subcortical white matter, thalami, and basal ganglia, but lesions may be tumefactive and mimic other ring-enhancing infections and tumors ( Fig. 13 ). Therefore, it is crucial for the radiologist to consider tumefactive demyelination with all ring-enhancing lesions because of the drastically different management. Specifically, ADEM is treated medically with intravenous high-dose steroids and surgery should be avoided. Nonresponsive patients can also be treated with plasma exchange or immunoglobulins.
The imaging features most suggestive of tumefactive demyelinating lesions include large lesions with little to no mass effect, minimal edema, incomplete ring of enhancement at the “leading edge” of demyelination on the white matter side of the lesion, central dilated veins within the lesion, and decreased perfusion (rCBV).
Key Imaging Features: Acute Disseminated Encephalomyelitis
- •
Minimal mass effect
- •
Incomplete “leading edge” enhancement.
Temporal Lobe
When this imaging pattern is encountered, the primary diagnostic consideration should always be herpes encephalitis in the infectious category. Noninfectious considerations, including middle cerebral artery (MCA) infarct, glioma, and limbic encephalitis, are discussed briefly in the following sections.
Herpes encephalitis and other viral encephalitis
Encephalitis refers to a diffuse parenchymal inflammation seen as T2 hyperintensity on MR imaging. The most common viral encephalitides include herpes simplex viruses (HSV-1 and HSV-2), herpes zoster, arboviruses, and enteroviruses.
HSV-1 is responsible for 95% of herpes encephalitides and occurs primarily in adults and older children. This devastating necrotizing encephalitis results from reactivation of latent HSV-1 infection within the trigeminal (or gasserian) ganglion, and is the most common cause of fatal sporadic encephalitis. The infection spreads intracranially along meningeal branches of the trigeminal nerve, thus explaining the predilection for the temporal lobe. Patients typically present with fever, headaches, seizures, and focal neurologic deficits. The high mortality rate of HSV-1 herpes encephalitis, approaching 70% without treatment, and the availability of effective antiviral drugs, make early diagnosis key. Because polymerase chain reaction (PCR) is not 100% sensitive, early recognition of MR imaging findings can be critical.
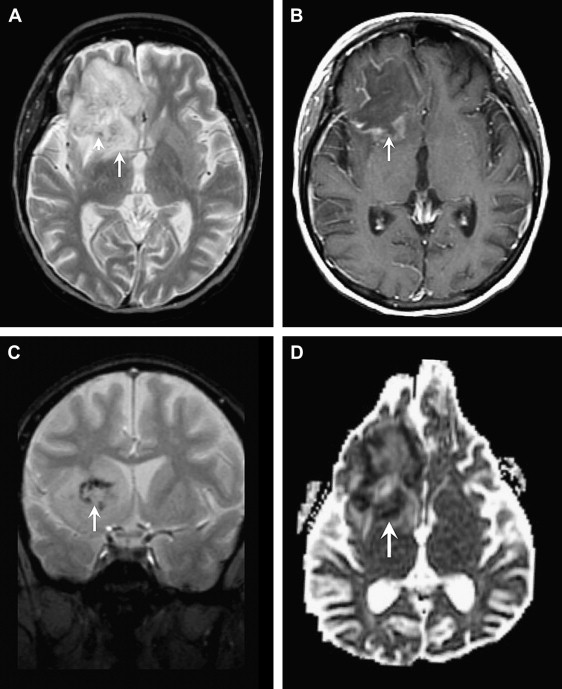
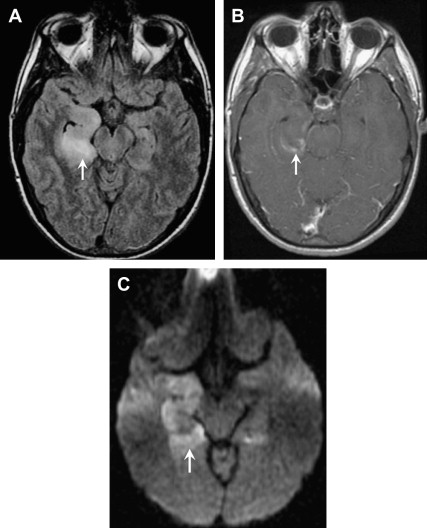
The spectrum of imaging findings reflects the edema, hemorrhage, and necrosis seen pathologically. CT can be normal or show ill-defined areas of hypodensity in the medial temporal lobes and/or inferior frontal lobes. MRI better characterizes the extent of injury and classically shows bilateral, but asymmetric, involvement of the limbic system. Cortical swelling with T2 hyperintensity and T1 hypointensity are seen in the medial temporal lobe, insular cortex, cingulate gyrus, and inferior frontal lobe ( Figs. 14 and 15 ). The pons may also be involved, likely from retrograde transmission along the cisternal segment of the trigeminal nerve. Petechial hemorrhages can manifest as T1 shortening or abnormal susceptibility on gradient-echo sequences. T1 shortening can also be seen in a gyriform configuration owing to cortical hemorrhage. Enhancement is variable, may be patchy or gyral, and generally develops later in the infection (after the T2 abnormality). Areas of reduced diffusion have been shown to be one of the earliest findings ; however, DWI can be variable. Some investigators report more severe, nonresponsive cases to have reduced diffusion, whereas cases with a good response to treatment and more favorable outcome show resolution of reduced diffusion, or even increased diffusion at the onset.
The primary differential considerations for abnormalities of the temporal lobe include MCA infarct, infiltrating gliomas, and limbic encephalitis. The basal ganglia are usually spared, and the medial temporal lobe is usually involved before the lateral temporal lobe, in herpes encephalitis, thus helping to differentiate from an acute MCA infarct ( Fig. 16 ). The clinical history, including the onset and chronicity of symptoms, should help differentiate infarct from infiltrating tumor.
Key Imaging Feature: Herpes Encephalitis and Other Viral Encephalitis
- •
HSV-1 should be the diagnosis of choice in ANY patient with fever and signal abnormality in the medial temporal lobe until proven otherwise.
Basal Ganglia Lesions
Primary differential considerations for bilateral basal ganglia abnormalities include infection, toxic-metabolic etiologies, venous ischemia, hypoxic-ischemic injury, and neoplasm. It is critical to know the patient’s history and specifically his or her immune status.
Cryptococcus
Cryptococcus neoformans is the most common CNS fungal infection in patients with AIDS and the third most common cause of CNS infection in AIDS, after HIV encephalopathy and toxoplasmosis. It typically manifests as a chronic basilar meningitis or meningoencephalitis with minimal inflammation. C neoformans is a ubiquitous yeastlike fungus found in soil contaminated by bird excreta. Patients are most vulnerable to Cryptococcus when their CD4 counts drop below 100 cells/μL. The diagnosis of CNS cryptococcosis can be made on the basis of a series of microbiologic investigations, including CSF culture and positive identification of the yeast with India ink staining; elevations in cryptococcal antigen latex agglutination titers in CSF and blood; and positive results with blood culture.
The most common imaging finding for cryptococcal meningitis, albeit nonspecific, is communicating or noncommunicating hydrocephalus. Cryptococcus tends to spread along the perivascular (Virchow-Robin) spaces resulting in “gelatinous pseudocysts.” These appear as multiple, nonenhancing, rounded, T2 hyperintense, T1 hypointense lesions in the basal ganglia ( Fig. 17 ). Other imaging findings include meningeal enhancement and ring-enhancing granulomas (“cryptococcomas”) with a predilection for the choroid plexus. Immunocompromised patients are less likely to have hydrocephalus or enhancing parenchymal lesions and are more likely to have gelatinous pseudocysts on imaging. Patients are treated with antifungal agents such as fluconazole or amphotericin B.
Related posts:
 Maxillofacial (Midface) Fractures
 Acute Neurointerventional Therapies
Intracranial Hypotension and Intracranial Hypertension
Acute Neurointerventional Therapies
Intracranial Hypotension and Intracranial Hypertension
 Nontraumatic Intracranial Hemorrhage
 Emergency Head & Neck Imaging: Infections and Inflammatory Processes
 Diffusion MR Imaging: An Important Tool in the Assessment of Brain Tumors
Stay updated, free articles. Join our Telegram channel

Full access? Get Clinical Tree


