Frame duration[s]
5
10
30
Number of frames
24
12
2
The advantageous short half-life of the tracer (122 s) enables the performance of multiple image acquisition scans in rapid sequence. Inter-scan intervals should, however, not be shorter than 15 min to allow isotope decay. Due to the fast radioactive decay, an on-site cyclotron or linear accelerator for isotope production becomes necessary. Further data analyses generally include the absolute quantification of CBF. For this purpose, the experimental setting implies arterial blood sampling in parallel to the PET acquisition. This is preferentially performed using an automated sampling system (e.g., ALLOGG AB blood sampler; Allogg Mariefred, Sweden) with a peripheral artery, e.g., the radial artery. Using such a device, arterial blood samples are continuously drawn at a constant speed with activity measurements for every 0.5 or 1 s. The blood sampler needs to be cross-calibrated to the PET scanner, allowing the decay-corrected blood data to be used as input function for kinetic modeling.
Obtaining arterial blood samples via the placement of an arterial catheter is accepted as the gold standard method for CBF quantification. However, there are some limitations, like invasiveness, complications for the patient, and sensitivity to errors (Hall 1971; Machleder et al. 1972). Aiming to replace the arterial canalization and corresponding input function, alternatives were suggested, like image-derived input functions (Zanotti-Fregonara et al. 2011) and methods without the need of any input function (Lammertsma 1994; Watabe et al. 1996). Another possibility to avoid arterial canalization is the use of arterialized venous blood, which is an often used method also with other PET tracers. With this technique, the hand of the patient or volunteer is heated well above 37 °C to achieve a shunting of arterial blood to the venous system (Wakita et al. 2000). Nevertheless, all alternative techniques have their drawbacks, and the CBF values obtained by them need to be handled with caution.
As for all brain PET tracers, the resulting PET data require a correlation with structural information from MRI (preferably 3D-T1 data). In this regard, the use of combined PET/MRI scanners might improve this situation in the future. Combined PET/MR imaging gives the opportunity for accurate registration and exact correlation of PET functional aspects with anatomical information from MRI. This will result in better image quality because of the comparably lower spatial resolution of PET in contrast to MRI and also shortens imaging times for the patients/anesthetized research animals.
4.4 Kinetic Modeling of CBF
The first method to measure CBF in humans was proposed by Kety and Schmidt in 1945 who utilized nitrous oxide for CBF detection. Later, other tracers like 133Xenon (Veall and Mallett 1967) were applied within this concept which was based on the Fick principle and a single-tissue compartment model. It states that the amount of a metabolically inert and freely diffusible gas that is taken up by a tissue per unit of time is equal to the product of the blood flow through that tissue and the difference between the amount of gas entering it via the arterial blood and the gas leaving in the venous blood.
The single-tissue compartment model describes the behavior of a freely diffusible tracer like [15O]H2O in tissue as shown in Fig. 4.1 and can be used to determine the local arterial blood flow in the brain (on a region of interest (ROI) or voxel basis). The model consists of two parameters that have to be estimated from the data of a dynamic PET scan (q(t)) and from the measured arterial input function c a(t).
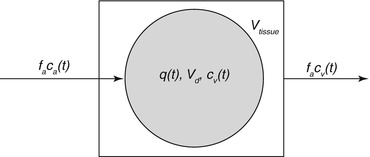
Fig. 4.1
Schematic description of a single-tissue compartment. V tissue is the anatomical tissue volume (1 cm3), and V d is the volume of the tissue compartment accessible to the tracer. The products of flow and concentration describe the amount of tracer which enters or leaves the tissue compartment per time unit. Please refer to the main text for further explanation of the other symbols
Assuming that the transport of tracer from the vessel into the tissue compartment is fast (high permeability surface area product) compared to the delivery by the arterial blood flow, the tracer dynamics can be described by a one-tissue compartment model with one input function. The mass balance for the tracer (Fick principle) yields the differential equation
where q(t) is the quantity of tracer per unit volume of tissue (kBq cm−3), f a is the local arterial blood flow per unit volume (ml min−1 cm−3), and c a(t) and c v(t) are the tracer concentrations in arterial and venous blood (kBq ml−3).
(4.1)
The tracer concentration in the venous blood (c v(t)) is related to the tracer concentration in the tissue space (q(t)) through the relative volume of distribution (V d (ml cm−3)) by the Kety–Schmidt assumption:
reflecting the assumption that the concentrations in the water spaces of venous blood and tissue are always equilibrated (this assumption is not generally valid, because a diffusion limitation exists for [15O]H2O at low CBF rates).
(4.2)
From Eqs. (4.1) and (4.2), the differential equation
is obtained with the washout constant k (min−1) defined to be

(4.3)
(4.4)
By estimating values of f a and k, the partition coefficient of the tracer can be calculated for every tissue voxel. An example of parameter estimation for a cortical region of interest based on the arterial input function is shown in Fig. 4.2.
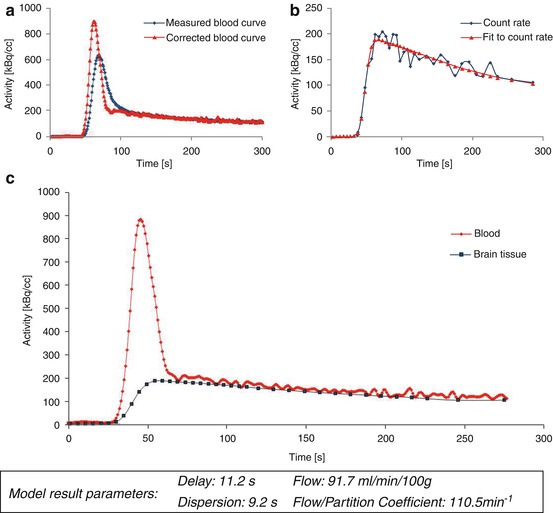
Fig. 4.2
Model parameter estimation. The arterial input function (a) and corresponding tissue response in a cortical ROI (b) after bolus injection of [15O]H2O are shown. Blood activity data were determined by taking arterial blood samples with a dedicated sampling device. The input function and tissue response are corrected for tracer arrival times and bolus dispersion. Further kinetic modeling is based on the resulting corrected curves (c)
Equation (4.3) has the solution
where ⊗ describes the convolution of an exponential function with the arterial input function c a(t):
(4.5)
(4.6)
The experimental design is further specified in a way that the tissue response, q(t), as well as the arterial, c a(t), input is measured and thus known for the duration of the experiment. Additionally, q(0) = 0.
[15O]H2O is the most commonly used tracer for brain perfusion imaging and CBF quantification with PET. However, there are some notable restrictions concerning the diffusion limitation of [15O]H2O. A study of Eichling et al. investigated the cerebral behavior of [15O]H2O after administration to rhesus monkeys. They found that only about 90 % of the injected tracer freely exchanges with the brain tissue, with even lower rates at higher flow rates. This incomplete first-pass extraction (80–90 % in gray matter structures) resulted in a slightly underestimation of CBF especially in high-flow regions (Eichling et al. 1974; Bolwig and Lassen 1975; Raichle et al. 1983).
In this respect, lipophilic gaseous tracers (like nitrous oxide and xenon) behave superior for CBF measurements as compared with [15O]H2O.
Further consideration should be done concerning partial volume effect that among others derive from relatively low spatial resolution of typically 6–10 mm in PET. The resulting spread out of signal is a phenomenon that introduces distortion effects in the targeted region and adjacent tissue (Links et al. 1996). The partial volume effect primarily leads to an increased bias for small anatomical structures (like vessels) in the brain (Rousset et al. 1998).
Since the early 1980s, several methods have been described to calculate CBF from PET measurements with [15O]H2O, including simplified techniques that include parameter fixation, e.g., fixation of the partition coefficient (Watabe et al. 1996). The partition coefficient of [15O]H2O is a parameter that has been investigated in many studies and varies from 0.77 to 1.05 ml/ml (Herscovitch and Raichle 1985; Iida et al. 1993; Kanno et al. 1991). A good approximation for the whole brain was considered by Herscovitch and Raichle to be 0.9 ml/ml (Herscovitch and Raichle 1985). However, CBF calculation methods with fixed values for V d are only applicable to identify global blood flow changes. In presence of regional blood flow deficits, CBF calculation results in incorrect values.
4.5 Role of PET for CBF Measurements
4.5.1 General Principles for CBF Measurements
A general distinction must be made between the behaviors of different CBF tracers. One class of techniques utilizes agents which are restricted to the intravascular space and do not interact with the nonvascular space. These can be, in cases of an intact blood–brain barrier, referred to as nondiffusible CBF tracers. Many brain imaging techniques, such as contrast-enhanced MR and CT, use these intravascular tracers to calculate CBF on the basis of the indicator dilution theory (Meier and Zierler 1954; Zierler 1962). In contrast, a direct tracer exchange from the arterial vascularity to the parenchyma occurs in case of freely diffusible CBF tracers and enables to give a direct measurement of parenchymal blood flow, as originally described by Kety (1951). This concept is utilized, for example, with [15O]H2O PET, Xenon–CT, and Xenon SPECT. Some basic characteristics appear to be necessary for a useful CBF measurement method: Ideally, the incorporated indicator should be early and completely mixed with blood and must stay identifiable for position and concentration in time of image acquisition. Further, the indicator should be metabolically inert and rapidly eliminated.
4.5.2 Advantages and Disadvantages of Perfusion Imaging Methods
Various modalities have been developed to obtain hemodynamic parameters in research and clinical settings. These include the older 133Xe inhalation method, PET, SPECT, X-ray computed tomography methods, and several MRI techniques. However, each technique has its own advantages and drawbacks. It depends on the study subject and the targeted question which method to choose appropriately. A review from Wintermark et al. (2005) gives a comparative overview about current brain perfusion measurement techniques and their clinical relevance. At this point, a brief overview is given on the role of [15O]H2O PET in this context.
4.5.2.1 Nuclear Medicine Methods
CBF can be measured after incorporation of radioactive agents which are detected outside the investigated subject with dedicated scintillation detectors. Based on this principle, tracers like [99mTc]HMPAO or [99mTc]ECD and 133Xe were commonly used for CBF measurements with SPECT (Barthel et al. 2001; Lass et al. 1998; Sakai et al. 1987). In comparison to the coincidence method in PET imaging, the detection of single photons is less sensitive. SPECT imaging with [99mTc]HMPAO or [99mTc]ECD only allows for semiquantitative CBF estimation (Markus 2004). In contrast, the 133Xe SPECT method relies on the Kety–Schmidt model (Kety and Schmidt 1945) and is considered to give quantitative measures of CBF (Wintermark et al. 2005). In several studies, however, a systematic CBF overestimation was reported in low-flow areas, as well as an underestimation of cortical CBF (Matsuda et al. 1996; Skyhøj Olsen et al. 1981).
However, the coincidence PET technique is commonly accepted to be the reference standard for CBF imaging. With PET, the tissue perfusion can be directly measured by using the diffusible radiotracer [15O]H2O. This method is well validated and combines several favorable properties. The tracer is easy to produce, and the fast acquisition time permits repetitive measurements with whole brain coverage. Additionally, the major advantage of CBF measurement with PET is the high accuracy for assessing quantitative parameter maps as well as a high reproducibility (Carroll et al. 2002; Matthew et al. 1993).
Additionally, PET imaging with 15O-labeled compounds is of special interest for studying cerebrovascular diseases and if a comprehensive view on brain hemodynamic is demanded. In addition to the determination of CBF with [15O]H2O, a successive 15O inhalation allows for quantitative determination of essential parameters of hemodynamics and energy metabolism like oxygen consumption (cerebral metabolic rate of oxygen; CMRO2) and oxygen extraction fraction (OEF) (Frackowiak et al. 1980; Ibaraki et al. 2004). Further, because of its binding to hemoglobin in red blood cells (Martin et al. 1987), radiolabeled CO is used as an intravascular tracer to measure the cerebral blood volume (CBV). Compared to other modalities, PET is the only technique which is able to gain all of these different functional parameters noninvasively and in 3D for the entire brain, a fact which allowed PET imaging to become the gold standard method in the field of brain circulation physiology and pathophysiology imaging (Hoeffner 2005).
In comparison to SPECT, which is widely accessible and a routine perfusion imaging tool, PET imaging is technically more demanding and its availability is limited by complex logistics. Not only a PET scanner, but also the constant access to a cyclotron producing the radiopharmaceutical online is required, a fact limiting the application of the method especially in emergency settings. A further restriction occurs in patients who will receive a thrombolytic therapy. Because quantitative PET preferentially requires invasive arterial blood sampling in order to obtain an input function for kinetic CBF modeling, this procedure is not applicable in these patients. As a consequence, [15O]H2O PET did not manage to become a clinical routine imaging tool in the acute stroke situation. Clinical applications instead mainly refer to chronic cerebrovascular disorders, brain tumors, and brain activation studies. Moreover, due to the wide acceptance of PET as standard for CBF visualization and quantification, the method is used as the reference to validate other brain perfusion imaging techniques, like perfusion-weighted or arterial spin labeling MRI (Zaro-Weber et al. 2010a, b; Chen et al. 2008)
Apart from [15O]H2O PET, CBF measurements with [11C]butanol have been suggested to be an alternative tracer for detection with PET. In comparison to radiolabeled water, butanol has the advantage of being permeable through the blood–brain barrier to 100 %. However, this tracer is not used in routine practice because of its complex and radiochemical synthesis (Herscovitch et al. 1987).
[14C]iodoantipyrine (IAP) autoradiography is another nuclear medicine perfusion imaging method used in preclinical research (Hatakeyama et al. 1992; Jay et al. 1988). As with butanol and H2O, IAP is also able to freely cross the blood–brain barrier. It is not metabolized and as such accumulates in the brain tissue depending on the regional CBF. After tracer application, the animals need to be sacrificed to prevent tracer diffusion and to autoradiographically determine the CBF at the time-point of tracer injection. Sequential arterial blood samples can be used for absolute CBF quantification. This autoradiographic ex vivo method provides accurate and high-resolution quantitative CBF values for a specific time-point and is therefore mainly used in small animal studies.
4.5.2.2 Computed Tomography Methods
The physical principle that underlies the CT technique is based on tissue-specific attenuation of X-rays that are directed to the body. The image contrast then resulted from variations in attenuation depending on tissue density. Due to similar densities in white and gray matter structures, this technique is not the ideal tool to image anatomical brain structures (Griffiths et al. 2001). However, with a bolus injection of a contrast agent, such as iodine, most prerequisites of the abovementioned indicator dilution theory are satisfied to measure blood flow in the brain. However, due to different acquisition hardware, acquisition protocols, varying post-processing protocols, and differences in the interpretation of perfusion CT data, a reliable CBF quantification remains challenging and varies widely between centers (Kudo et al. 2010). A further approach for CBF measurement uses inhaled Xenon to detect concentration changes of the substance (Pindzola and Yonas 1998). The lipophilic gas is soluble in water, and its X-ray attenuation is similar to that of iodine. As in 133Xe SPECT, the Xe–CT technique also utilizes the Kety–Schmidt method to calculate quantitative CBF maps with sufficient accuracy (Wintermark et al. 2005). Although newer CT scanners are able to achieve whole brain coverage, a main limitation of commonly used CT scanners derives from the limited anatomical coverage, which is restricted to few brain slices.
4.5.2.3 Magnetic Resonance Methods
Several methods for CBF estimation by means of MR had been developed. The most commonly used method for neuroimaging studies is the dynamic susceptibility contrast (DSC) MRI method. It relies on changes in relaxation time on T2*-weighted images. With the bolus of a paramagnetic contrast agent agents (e.g., gadolinium-DTPA) passing through the vascular system, a detectable signal loss occurs in T2*-weighted sequences. Mathematical conclusions were then drawn from the signal reductions to further calculate several perfusion or perfusion-related parameters including mean transit time (MTT), time to peak (TTP), relative cerebral blood volume (rCBV), and relative CBF (Ostergaard et al. 1996a, b). Contrast agents for MR imaging are not radioactive and relatively inexpensive as compared with PET and SPECT tracers. A further advantage of this method is the short acquisition time that enables to visualize perfusion-weighted measurements within a few minutes. However, the absolute quantification of CBF remains unsolved (Wintermark et al. 2005). The use of a local internal input function (Calamante et al. 2004) is necessary to receive parametric maps. As such, the detection of a plausible AIF which is influenced by numerous factors, such as partial volume effects, is important for reproducible and reliable perfusion values (van Osch et al. 2001). Another respective challenge is the localization of the intracranial region of interest for the AIF calculation (Zaro-Weber et al. 2012). Thus, most of the calculated parameter maps in perfusion MR are named as “relative” (Griffiths et al. 2001; Jezzard 1998). Nevertheless, perfusion MRI is employed for diagnostic purposes, for instance in acute stroke, and in clinical settings regarding the combination of the various readout parameters. In comparison to gadolinium-based MRI, the arterial spinlabeling approach is another promising MR perfusion technique. Here, magnetically labeled water protons are used as endogenous tracer. However, problems with image interpretation may occur due to a limited signal-to-noise ratio and in the presence of prolonged blood transit times, like in patients with stroke or atherosclerosis (Petersen et al. 2006). In latter cases (e.g., stroke patients), the labeled water spins did not reach the target brain tissue within a given time, with the consequence of underestimating the real blood flow values (Jezzard 1998; Kimura et al. 2005).
4.6 Applications for CBF PET
4.6.1 Cerebral Ischemia
The increasing incidence for vascular diseases, like atherosclerosis, is associated with a worldwide increasing number of ischemic attacks (Feigin et al. 2009). Interruptions in brain–blood supply rapidly leads to ischemic cell damage that results in necrotic tissue if no sufficient therapy or spontaneous reperfusion becomes available. Current therapies aim to restore perfusion in the ischemic, salvageable brain tissue. In order to determine this hypoperfused yet viable tissue – the so-called ischemic penumbra (Astrup et al. 1981) – in acute stroke patients, perfusion imaging techniques were developed to identify this “tissue at risk” and to separate it from the already necrotic infarction core. The transition from reversible to irreversible damage is a function of ischemia duration as well as of CBF. A hemodynamic determination of the ischemic penumbra is used for many research studies in laboratory animals and humans, and CBF thresholds to characterize different tissue states were proposed: While normal human CBF is in the range of 50–80 ml/100 g/min, reversible ischemia (“ischemic penumbra”) is evident when CBF drops below values around 22 ml/100 g/min, and neuronal cell death occurs below a CBF of 8 ml/100 g/m in (Baron 2001). However, penumbra detection, based on CBF thresholds, is highly dependent on a reliable and accurate quantitative imaging method in an acute stroke diagnostic setting.
The opportunity to investigate different parameters of brain function, like CBF, CBV, OEF, and CMRO2, within one PET imaging session is a further advantage in the investigation of cerebrovascular diseases such as ischemic stroke. Here, it is essential to reliably separate primary perfusion deficits from events of decreased metabolic demand. This is as CBF decreases may not only appear in the surrounding tissue of the stenotic vessel, but sometimes also distant from the obviously damaged part of the brain. This well-recognized phenomenon is called “diaschisis.” One example is the so-called crossed cerebellar diaschisis in which a CBF reduction in the cerebellum contralateral to the stroke-affected brain hemisphere occurs as a result of crossed functional deafferentiation (Baron et al. 1981; Feeney and Baron 1986).
4.6.1.1 PET Perfusion Imaging in Preclinical Stroke Research
This paragraph will handle the employment of [15O]H2O PET in translational research studies of experimental stroke.
In 2008, our group proposed a new large animal model that is applicable for acute and chronic stroke induction (Boltze et al. 2008) and is highly suitable to reflect the human brain pathophysiology. Due to a similar cerebral anatomy and the favorable ovine brain size, brain imaging protocols, scanners, and data analysis techniques as used in clinical routine become feasible. This enables us to perform studies while meeting main conditions for translational research. Like in humans, in sheep, the middle cerebral artery (MCA) usually gives rise to three arterial branches. Different stroke sizes can be induced by permanent transcranial occlusion of one, two, or all three MCA branches, with the latter being referred to as permanent MCA occlusion (pMCAO). Fig. 4.3 shows examples of different occlusion types for experimental pMCAO in sheep. One-, two-, and three-branch (total) occlusions of the MCA could clearly be visualized by magnetic resonance angiography (MRA), together with the resulting CBF defects in [15O]H2O PET. In addition, slight CBF decreases, probably due to the transcranial surgery, were also detected in the sham-operated animals. Further, it was possible to demonstrate that the ischemic strokes induced by the transcranial pMCAO lead to reproducible CBF deficits, which remain stable over time and eventually leading to necrotic brain tissue.
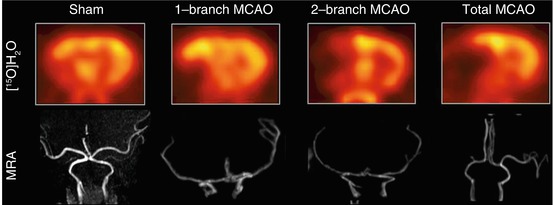
Fig. 4.3
Differential CBF deficits dependent on extent of experimental permanent middle cerebral artery occlusion in sheep. The extent of the post-pMCAO CBF deficit is clearly visualized with [15O]H2O PET. Corresponding to angiographic MRI findings, the CBF deficit increases in the order sham >1-branch pMCAO > 2-branch pMCAO > total pMCAO. MCAO middle cerebral artery occlusion, MRA magnetic resonance angiography (Modified from Boltze et al. (2008))
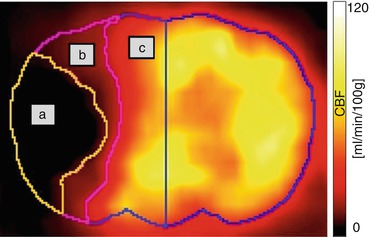
The major advantage of [15O]H2O PET is the option to perform serial scans in a short time period due to the short half-life of the 15O (122 s). As an example, CBF PET measurements were applied for a controlled preclinical study that aimed to test inhaled nitrous oxide (iNO) for its potential to protect the ischemic tissue in the penumbra in acute ischemic stroke. All animals were subjected to repeated PET scans at 110, 150, 175, and 210 min following pMCAO (a total of four PET scans within 100 min). In the treatment group, 50 ppm iNO were applied from 120 to 180 min after pMCAO. By using kinetic modeling, parametric CBF maps were created. Based on the abovementioned commonly accepted CBF thresholds (Baron 2001), operator-independent brain volumes of interest were defined for penumbra, infarction core, and remaining normal brain tissue (Fig. 4.4). Our experiments showed that iNO selectively restores CBF in the ischemic penumbra. While the volume of the necrotic core was not affected, the volume of the penumbra decreased by up to 50 % turning into normally perfused tissue (>22 ml/100 g/min) under iNO application, but remained unchanged in the untreated control animals (p < 0.05 vs. baseline and vs. control; Figs. 4.5 and 4.6; Terpolilli et al. 2012).
 The Impact of Genetic Polymorphisms on Neuroreceptor Imaging
 Imaging of Central Benzodiazepine Receptors in Chronic Cerebral Ischemia
 PET Tracers for Beta-Amyloid and Other Proteinopathies
 Imaging Type 1 Glycine Transporters in the CNS Using Positron Emission Tomography
 PET and SPECT Imaging of Steroid Hormone Receptors
 Imaging Histamine Receptors Using PET and SPECT


Related posts:
The Impact of Genetic Polymorphisms on Neuroreceptor Imaging
Imaging of Central Benzodiazepine Receptors in Chronic Cerebral Ischemia
PET Tracers for Beta-Amyloid and Other Proteinopathies
Imaging Type 1 Glycine Transporters in the CNS Using Positron Emission Tomography
PET and SPECT Imaging of Steroid Hormone Receptors
Imaging Histamine Receptors Using PET and SPECT
Stay updated, free articles. Join our Telegram channel
Full access? Get Clinical Tree
