where C(18F) is the total fluorine activity measured in the tissue, which is determined directly in the PET; C(FDG) is the concentration of free FDG in the tissue, calculated
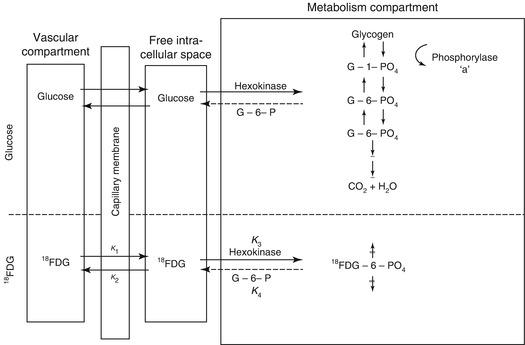
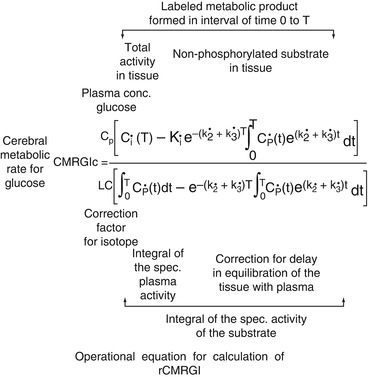
from the plasma concentration up to time point T with the aid of the constants of the model. The difference between these two values gives the local tissue concentration of FDG-6-phosphate; A b is the total quantity of FDG released into the tissue and is calculated from the plasma FDG concentration curve up to time point T, decreased by the delay in the tissue equilibration using the corresponding model constants. The quotient therefore gives the proportional phosphorylation rate of FDG. Multiplication by the plasma concentration of glucose (Gl) would yield the rate of glucose phosphorylation if it behaved in the same way as FDG. Since the arterial–venous extraction of glucose is not identical with that of FDG, the value must be corrected with an experimentally determined constant (LC = lumped constant). For the measurement of the regional glucose consumption in the brain, therefore, after i.v. administration of 3–6 mCi 18FDG, the plasma curve of 18FDG from the injection to the measurement time point (usually determined in arterialised venous blood), the glucose value in plasma and the regional 18F activity in the brain must be determined.
Errors resulting with this model from widely diverging kinetic constants in pathological tissue (Hawkins et al. 1981) can be reduced by dynamic PET. For this purpose the tissue activity is determined at short time intervals from the time point of injection. By variation of the values for the kinetic constants, the curve deriving from the model equation is adapted to the measured regional activity–time curve. The kinetic constants thus determined correspond best to the activity uptake in the corresponding tissue segment. They allow the regional metabolic rate for glucose to be directly calculated (Wienhard et al. 1985). It is now only necessary to assume a known value for the LC.
There remains some uncertainty as to the exact value of the normal “lumped constant” (LC) for FDG. The initial value empirically derived by Phelps et al. (1979) was 0.42. It has been directly measured by Reivich et al. (1985), who found a value of 0.52, assuming k 4 = 0. But LC could be even as high as 0.65 (Wu et al. 2003). However, regional changes in LC are small. For the sake of uniformity, the actual value used should be quoted in all publications. This will allow direct comparison of numerical values because the LC is a linear scaling factor in the operational equations.
With rate constants measured by dynamic curve fitting or by integration techniques, the equation for calculation of CMRglc is:
The term k 1 k 3/(k 2 + k 3), representing the metabolic rate of FDG, can be substituted by the influx rate constant k i determined with the linear approximation of Patlak et al. (1983). There have also been modifications that avoid the assumption of a fixed LC and refer instead to the Michaelis–Menten equation to account for the relations between enzyme affinities for FDG and glucose (Kuwabara et al. 1990).
Determination of individual rate constants is not very practical in many clinical applications, and methods are preferred that can be done with a single scan, a situation similar to the original development of the method for autoradiography. Then the deviation from population average CMRglc (given by the average rate constants) is estimated from a single scan. Actual measured FDG activity is compared with the activity that would have been expected at the time of the scan with the individual’s blood activity-time course and average rate constants (Wienhard et al. 1985).
To avoid the conversion factor needed with the analogue tracer FDG, native glucose labelled with 11C in the 1-position (1-11C-d-glucose) has also been used for quantitation of CMRglc (Raichle et al. 1975). Modelling is based on the same two-tissue-compartment model as with FDG, but an additional term is necessary to account for labelled metabolites (mainly lactate and other monocarboxylic acids and CO2). Metabolites occur in plasma and in brain, and loss of labelled CO2 from the brain is dependent on CBF. Data indicate that there is a rapid loss of labelled lactate from the brain, suggesting that it represents a significant nonoxidative part of glucose metabolism in brain (approx. 10 % of total CMRglc) (Blomqvist et al. 1990).
3.2.3 Normal Glucose Consumption of the Brain
In healthy volunteers, a mean glucose consumption of 29–32 μmol/100 g/min was found by means of FDG and PET (Reivich et al. 1979; Heiss et al. 1984), which corresponds well to whole brain metabolic rates provided by the Kety–Schmidt method. Under controlled conditions (darkened laboratory and steady noise from fans of equipment cooling systems), the functional anatomy of the brain is reflected in the metabolic activity of the individual regions. However, reliable regional values for cerebral metabolic rate of glucose (rCMRGlc) can only be obtained by equipment permitting high 3D resolution of tracer concentration in the brain tissue (Heiss et al. 2004). This progressively improved spatial resolution of PET is documented in Fig. 3.1 showing FDG images of the brain in the same volunteer assessed with different tomographs over the years (Heiss 2009a, b). Typical resting state grey matter CMRGl values are in the range of 40–60 μmol/100 g/min, and the corresponding level in the white matter is about 15 μmol/100 g/min. There are significant differences among regions with highest values in basal ganglia, primary visual cortex, cingulate and frontal cortex (42–50 μmol/100 g/min), lower values in other cortical and subcortical areas (35–42 μmol/100 g/min) and in the structures of the brainstem (25–30 μmol/100 g/min) and the cerebellum (33 μmol/100 g/min). There exist also significant asymmetries with largely right hemispheric predominance ((Pawlik and Heiss 1989), review in Silverman and Melega (2003)). The resting regional metabolism and its asymmetry are highly dependent on the state of resting wakefulness (e.g. apprehensive or relaxed) and background conditions (e.g. laboratory noise).
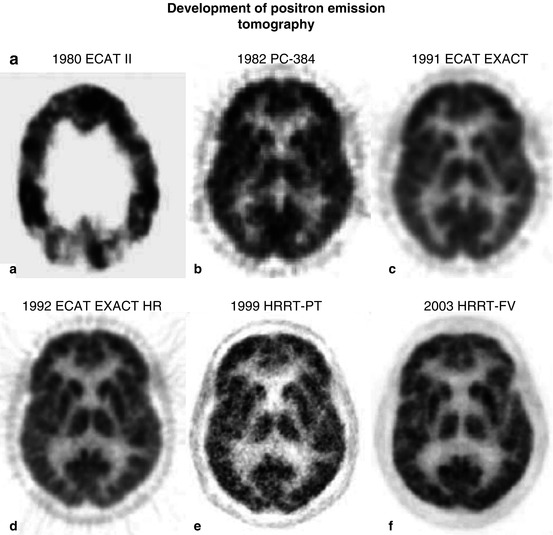
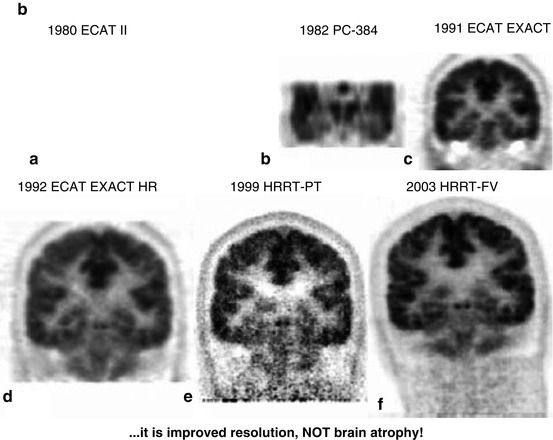
Fig. 3.1
(a) Development of PET: a horizontal slice. Various PET systems over the years demonstrate improvement in image quality and spatial resolution. a ECAT II, spatial resolution 15 mm. b PC-384, FWHM 8.4 mm. c ECAT EXACT, FWHM 6.5–7 mm. d ECAT EXACT HR, FWHM 3.6–4.5 mm. e, f HRRT PET: e prototype; f final version (HRRT-FV), FWHM 2.3–3.2 mm. Images of glucose metabolism were acquired for 20 min of steady state starting 30 min after tracer administration. (b) Coronal views of glucose consumption of the brain in a volunteer acquired with various PET systems over the years demonstrate improvement in axial resolution due to decreased slice thickness and advances in image reconstruction. a ECAT II (1980) was a single-ring camera; axial reconstruction was therefore not feasible. b PC-384, slice thickness 12 mm. c ECAT EXACT, axial FWHM 5–8 mm. d ECAT EXACT HR, axial FWHM 4.0–6.7 mm. e, f HRRT PET: e prototype; f final version (HRRT-FV), axial FWHM 2.5–3.4 mm
Local CMRGlc measured with PET is influenced by age: glucose metabolism of various grey matter structures was low at birth (13–25 μmol/100 g/min), reached a level of 19–33 μmol/100 g/min by 2 years and continued to rise until age 3–4 years and was maintained at a high level (49–55 μmol/100 g/min) until age of 10 years (Chugani et al. 1987). At about 10 years CMRGlc began to decline with a rather uniform decrease by 26 % in all investigated brain regions of 40 healthy resting subjects between the ages of 18 and 78 years (Kuhl et al. 1982). However, these age-dependent changes were not observed in all studies (Duara et al. 1984). In our own study on 42 normal subjects aged 15–85 years, a small (0.65 μmol/100 g/min per decade/p < 0.05) age-dependent decrease in global CMRGlc was found (Fig. 3.2). However, as demonstrated in Fig. 3.2, the various regions contributed differently to this overall effect: decreases of 16.6–11.3 % in cingulate, frontal, parietal, insular, temporal and sensorimotor cortex, virtually no change in primary visual cortex and cerebellum (Pawlik and Heiss 1989). Similar age-dependent changes of rCMRGl were described in further studies (Kalpouzos et al. 2009; Hsieh et al. 2012; Chetelat et al. 2013).
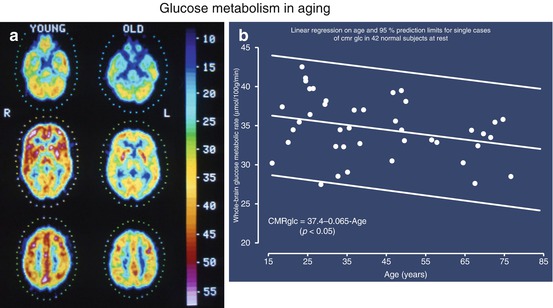
Fig. 3.2
(a) PET scans of glucose metabolism (μmol/100 g/min according to scale) in cerebral sections at the level of cerebellum, basal ganglia, thalamus and semioval centre in young (23 years) and old (67 years) healthy subjects. The individual brain structures can be differentiated according to different metabolic rates; metabolism decreases slightly in all regions in older patients. (b) Decrease of mean global glucose metabolic rate in 42 healthy subjects with increasing age. The regression line shows a significant relationship despite the large range of variation
Hardly any normal functional state is as regularly associated with as dramatic changes of general behaviour and shifting of attention as is sleep. The conclusion of no effect of sleep on human cerebral hemodynamics and metabolism, derived from early Kety–Schmidt studies (Mangold et al. 1955), could be disproved with PET (Heiss et al. 1985). As shown in Fig. 3.3, during stages II–IV sleep, a significant (P < 0.001) global decrease of brain functional activity was observed, with the largest declines in orbitofrontal cortex and in thalamus. In dream sleep, by contrast, both a general metabolic increase and conspicuous regional activations of superior frontal, insular, inferior parietal, hippocampal and visual association cortex (Heiss et al. 1985) were found. Increased CMRGlc during REM sleep has also been observed in limbic and paralimbic regions including hypothalamus, amygdala, orbitofrontal cingulate, entorhinal and insular cortices (Nofzinger et al. 1997).
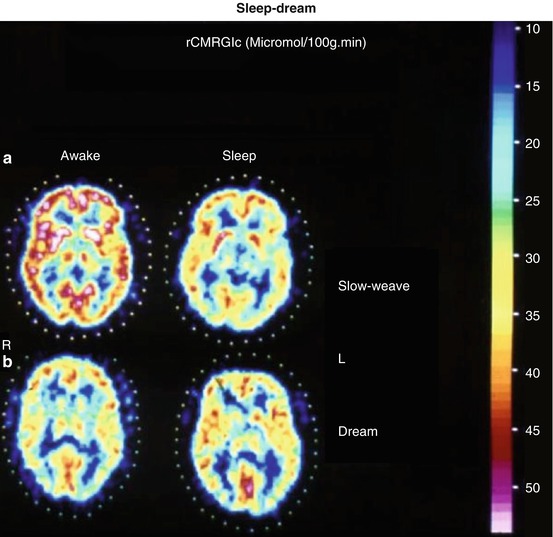
Fig. 3.3
(a) Corresponding images of the local cerebral metabolic rate for glucose determined by FDG-PET in a characteristic horizontal brain slice across the basal ganglia of a healthy 37-year-old male subject representative of the non-dreamers group, showing non-selective decrease in glucose utilisation from wakefulness (W) to sleep (S). Frontal poles are on top, occipital poles at bottom, sides as marked (R, L). Values on reference scale are in μmol/100 g∙min. (b) Corresponding metabolic maps of a 28-year-old normal volunteer’s brain slice recorded by FDG-PET while the subject was awake (W) and asleep dreaming (S). A generalised activation, most marked in the insular regions, visual cortex and hippocampal formations, is clearly demonstrated during sleep with dreaming
3.2.4 Coupling of Neuronal Activity to Metabolism and Flow
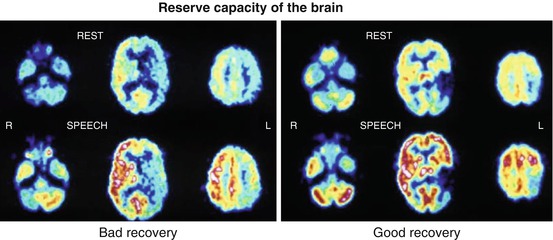
The activation of Na+,K+−ATPase represents the coupling mechanism between the increase in glucose utilisation and functional activity of the nervous tissue. The activation-induced increase in glucose uptake is visualised in the neuropil, that is, where synapses ensheathed by astrocytes are present, and not at the level of the neuronal perikarya. Glucose, taken up by astrocytic processes, is metabolised glycolytically to lactate and pyruvate, which are then released as substrates for oxidative phosphorylation in neurons (Wyss et al. 2011). Mapping of neuronal activity in the brain can be primarily achieved by quantitation of the regional cerebral metabolic rate for glucose (rCMRGlc), as introduced for autoradiographic experimental studies by Sokoloff (1999) and adapted for positron emission tomography (PET) in humans (Reivich et al. 1979). Functional mapping, as it is widely used now, relies primarily on the hemodynamic response assuming a close association between energy metabolism and blood flow. While it is well documented that increases in blood flow and glucose consumption are closely coupled during neuronal activation, the increase in oxygen consumption is considerably delayed leading to a decreased oxygen extraction fraction (OEF) during activation (Mintun et al. 2001). PET detects and, if required, can quantify changes in CBF and CMRGlc accompanying different activation states of the brain tissue. The regional values of CBF or CMRGlc represent the brain activity due to a specific state, task or stimulus, in comparison to the resting condition, and colour-coded maps can be analysed or coregistered to morphologic images. Due to the radioactivity of the necessary tracers, activation studies with PET are limited to a maximum of 12 doses of 15O-labelled tracers, e.g. 12 flow scans, or two doses of 18F-labelled tracers, e.g. two metabolic scans. Especially for studies of glucose consumption, the time to metabolic equilibrium (20–40 min) as well as the time interval between measurements required for isotope decay (HT for 18F 108 min, for 15O 2 min) must be taken into consideration. FDG-PET was the leading method to investigate functional activation in humans in the 1980s (Phelps et al. 1981; Pawlik and Heiss 1989). FDG activation studies can also be applied in patients with functional disorders due to localised brain damage, e.g. by stroke and tumour, and has found broad application to patients with aphasia (Heiss 2009a, b). An example is given in Fig. 3.4 showing different activation patterns in poststroke aphasia which are related to prognosis and recovery of language function.
 The Impact of Genetic Polymorphisms on Neuroreceptor Imaging
 Imaging of Central Benzodiazepine Receptors in Chronic Cerebral Ischemia
 PET Tracers for Beta-Amyloid and Other Proteinopathies
 Imaging Type 1 Glycine Transporters in the CNS Using Positron Emission Tomography
 PET and SPECT Imaging of Steroid Hormone Receptors
 Imaging Histamine Receptors Using PET and SPECT


Related posts:
The Impact of Genetic Polymorphisms on Neuroreceptor Imaging
Imaging of Central Benzodiazepine Receptors in Chronic Cerebral Ischemia
PET Tracers for Beta-Amyloid and Other Proteinopathies
Imaging Type 1 Glycine Transporters in the CNS Using Positron Emission Tomography
PET and SPECT Imaging of Steroid Hormone Receptors
Imaging Histamine Receptors Using PET and SPECT
Stay updated, free articles. Join our Telegram channel
Full access? Get Clinical Tree
