Cerebrovascular Disease
Howard A. Rowley
Stroke is a clinical term applied to any abrupt nontraumatic brain insult—literally “a blow from an unseen hand.” Strokes are caused by either brain infarction (75%) or hemorrhage (25%), and must be distinguished from other conditions causing abrupt neurologic deficits. Infarction is a permanent injury that occurs when tissue perfusion is decreased long enough to cause necrosis, typically due to occlusion of the feeding artery. Transient ischemic attacks (TIAs) are defined as transient neurologic symptoms or signs lasting less than 24 hours, which may serve as a “warning sign” of an infarction occurring in the next few weeks or months. TIAs are often due to temporary occlusion of a feeding artery. Hemorrhage is seen when blood ruptures through the arterial wall, spilling into the surrounding parenchyma, subarachnoid space, or ventricles.
Stroke is the third leading cause of death in the United States and major source of long-term disability among survivors. The approach to treatment of ischemic stroke has been largely preventative or supportive in the past, but approval of intravenous thrombolysis for acute stroke and availability of endovascular devices have made rapid imaging and intervention a critical part of stroke management. The patient with hemorrhage may harbor an aneurysm, vascular malformation, or other condition, each having important differences in treatment options. The radiologist plays a critical role in the triage and evaluation of all stroke patients. Selection of the proper imaging technique, recognition of early ischemic changes, differentiation of stroke from other brain disorders, and recognition of important stroke subtypes can have a significant impact on therapy and outcome.
This chapter reviews the pathophysiology of stroke, the time course of findings on computed tomography and magnetic resonance imaging, patterns of arterial and venous occlusions, and overall radiologic approach to evaluation of the stroke patient.
Ischemic Stroke
Etiology. Despite our best clinical efforts, no clear source is ever identified in up to a quarter of patients with brain infarction. Among those with an established mechanism, about two-thirds of infarcts are caused by thrombi and one-third by emboli. Thrombi are formed at sites of abnormal vascular endothelium, typically over an area of atherosclerotic plaque or ulcer. Large-artery thrombosis in the neck may or may not cause distal infarction, depending on the time course of occlusion and available collateral supply. Small vessel thrombi frequently occur in “end-arteries” of the brain, accounting for about one-fifth of infarcts (“lacunes”). Emboli may arise from the heart, aortic arch, carotid arteries, or vertebral arteries, causing infarction by distal migration and occlusion. There is obviously overlap between the thrombotic and embolic groups, since the majority of emboli begin as thrombi somewhere more proximal in the cardiovascular tree (hence the practical term, “thromboembolic disease”). Vasculitis, vasospasm, coagulopathies, global hypoperfusion, and venous thrombosis each account for 5% or fewer of acute strokes, but are important to recognize due to differing treatment and prognosis. A given patient’s age, medical history, and type of stroke seen will help establish the major etiologic considerations (Table 4.1).
Pathophysiologic Basis for Imaging Changes
Brain Metabolism and Selective Vulnerability. Neurons lead a precarious life. The brain consumes 20% of the total cardiac output to maintain its minute-to-minute delivery of glucose and oxygen. Since there are no significant long-term energy stores (e.g., glycogen, fat), disruption of blood flow for even a few minutes will lead to neuronal death. The extent of injury depends on both the duration and degree of ischemia. Minor reduction in perfusion is initially compensated for by increased extraction of substrate, but injury becomes inevitable below a critical flow threshold (10 to 20 mL/100 gm tissue/min versus normal 55 mL/100 gm/min).
Certain cell types and neuroanatomic regions show selective vulnerability to ischemic injury. Gray matter normally receives 3 to 4 times more blood flow than white matter, and is therefore more likely to suffer under conditions of oligemia. Some subsets of neurons (e.g., cerebellar Purkinje cells, hippocampal CA-1 neurons) are injured more readily than others, possibly due to greater concentrations of receptors for excitatory amino acids. The slower metabolizing capillary endothelial cells and white matter oligodendrocytes are more resistant to ischemia than gray matter is, but will also die when deprived of nutrients. Cells served by penetrating end arteries or those
residing in the watershed zone between major territories have no alternate route for perfusion, and are therefore more prone to infarction. Damage will likely be more severe in a patient with an incomplete circle of Willis than in one with a complete arterial collateral pathway.
residing in the watershed zone between major territories have no alternate route for perfusion, and are therefore more prone to infarction. Damage will likely be more severe in a patient with an incomplete circle of Willis than in one with a complete arterial collateral pathway.
Table 4.1 Differential Diagnosis of Ischemic Stroke By Age | |||||||||||||||||||||||||||
|---|---|---|---|---|---|---|---|---|---|---|---|---|---|---|---|---|---|---|---|---|---|---|---|---|---|---|---|
| |||||||||||||||||||||||||||
Imaging Findings in Acute Ischemia. Ischemia causes a cascade of cellular level events leading to the gross pathologic changes detected in clinical imaging. Failure of membrane pumps permits efflux of K+ and simultaneous influx of Ca2+, Na+, and water. This leads to cellular (“cytotoxic”) edema, observed clinically as increased water content in the affected region. Changes in brain water are key to understanding signs of infarction by CT and MR. Even a small increase in water content causes characteristic decreased attenuation on CT, low signal on T1-weighted MR, and high signal on T2- and diffusion-weighted MR. This edema peaks 3 to 7 days post infarction and is maximum in the gray matter. A smaller component of vasogenic edema also develops as the more resistant capillary endothelial cells lose integrity. (In contrast, tumor-associated edema is primarily vasogenic and preferentially affects the white matter—see Chapter 5.)
Careful inspection of CT and MR images done within minutes to a few hours after vessel occlusion can give clues to ischemic injury, even before gross tissue edema or mass effect are seen. These “hyperacute” signs primarily relate to morphologic changes in the vessels rather than density or signal changes in the parenchyma. On CT, the actual thrombus may occasionally be seen in larger intracranial branches, resulting in the “hyperdense artery sign” (Fig. 4.1). On MR, the normal black signal of flowing blood within the lumen (“flow void”) is immediately lost and may be replaced by abnormal signal representing clot or slow flow (Fig. 4.2). Loss of the flow void is best seen acutely in the large vessels (i.e., carotid siphon, vertebrobasilar vessels, middle cerebral branches). Dissolution of clot and improved collateral flow may occur within the first few days, leading to re-establishment of flow void on follow-up MR exams.
Acute MCA Ischemia on CT: Insular Ribbon and Lentiform Nucleus Edema. CT scans done within 6 hours of middle cerebral artery (MCA) occlusion will commonly exhibit the “insular ribbon sign”, a subtle but important blurring of the gray-white layers of the insula as a result of early edema (Fig. 4.3). Early edema may also be most conspicuous in the
putamen in proximal middle cerebral artery occlusions (lentiform nucleus edema sign). MR exams in the first few hours may show a similar loss of gray-white borders and slight crowding of sulci in areas destined to undergo infarction. However, the most sensitive imaging sequence for detection of brain ischemia is diffusion-weighted MR imaging, which may turn positive minutes after infarction begins, well before the CT shows even subtle signs. Hyperintense signal on diffusion-weighted images (“light-bulb sign”) precedes T2 hyperintensity, which typically develops at 6–12 hours post ictus (Fig. 4.4).
putamen in proximal middle cerebral artery occlusions (lentiform nucleus edema sign). MR exams in the first few hours may show a similar loss of gray-white borders and slight crowding of sulci in areas destined to undergo infarction. However, the most sensitive imaging sequence for detection of brain ischemia is diffusion-weighted MR imaging, which may turn positive minutes after infarction begins, well before the CT shows even subtle signs. Hyperintense signal on diffusion-weighted images (“light-bulb sign”) precedes T2 hyperintensity, which typically develops at 6–12 hours post ictus (Fig. 4.4).
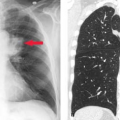
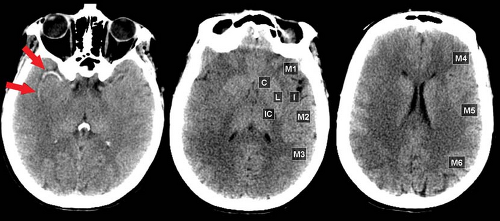 Figure 4.1. Hyperdense Artery Sign and Early Edema on CT. Three hours post occlusion, high density indicative of thrombus is seen in the proximal right middle cerebral artery (MCA) (arrows). Extensive right hemisphere edema is already present. The 10 regions scored by ASPECTS are shown in the normal left hemisphere. The ASPECTS score is only 3, with points off for low attenuation in the right insula, posterior lentiform nucleus, M1, M2, M3, M4, and M5 cortical regions. Edema involves more than one-third MCA territory and ASPECTS is much lower than 7, both predicting a poor candidate for acute thrombolysis. |
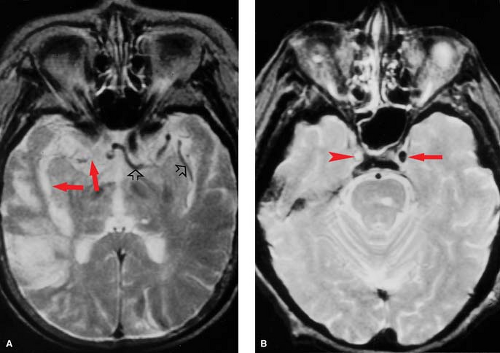 Figure 4.2. Loss of Flow Void. Six hours after right internal carotid occlusion (A), there is a loss of vascular flow voids in the internal carotid artery (ICA) and middle cerebral artery branches (red arrows) compared with the patent left side (open arrows). Hyperintensity is developing in the right posterior sylvian region, indicative of early edema on this T2WI. A section below (B) shows complete occlusion of the right ICA in its cavernous segment (arrowhead), with normal flow void preserved on the left (arrow). An older lacune in the pons is also seen. |
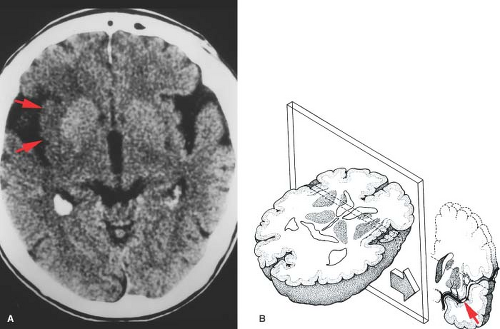 Figure 4.3. Insular Ribbon Sign. A. A noncontrast CT done 4 hours after right middle cerebral artery (MCA) occlusion shows decreased attenuation and loss of gray–white borders in the right insular region (arrows). B. Diagram of the insula in transverse and coronal planes. The insular cortex, claustrum, and extreme capsule are infarcted due to occlusion of the MCA (arrow) beyond the lateral lenticulostriate vessels. (From Truwit CL, Barkovich AJ, Gean-Marton A, et al. Loss of the insular ribbon: another early CT sign of acute middle cerebral artery infarction. Radiology 1990;176:801–806.) |
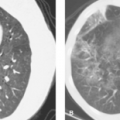
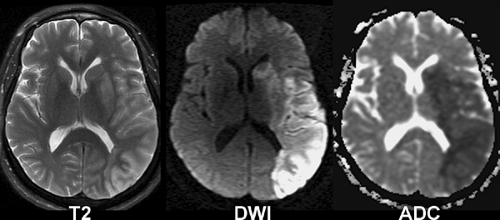 Figure 4.4. Edema in Early Ischemia. This patient was found unresponsive with unknown time of symptom onset. Edema is detected as high signal intensity and mild sulcal effacement in the left middle cerebral artery territory on T2-weighted transverse images. Hyperintensity on DWI and hypointensity on apparent diffusion coefficient (ADC) maps are characteristic of cytotoxic edema in acute ischemia. Note preferential gray matter involvement during early ischemia. These images suggest that the stroke is approximately 4 to 8 hours old. |
CT Screening for Thrombolysis. Careful but rapid interpretation of CT scans is particularly important in patients who are candidates for thrombolytic drug treatment (e.g., tissue plasminogen activator, t-PA). Administration of intravenous t-PA within 4.5 hours of stroke onset has been reported to improve neurologic outcome, provided rigid inclusion and exclusion treatment criteria are met. The screening CT is examined to exclude patients with brain hemorrhage, masses, or other structural abnormalities that contraindicate thrombolysis. Patients with extensive edema on their initial CT scan may be at particularly high risk for reperfusion hemorrhage, so these patients should be excluded from thrombolytic treatment. Although universal guidelines are not agreed upon, patients with edema affecting more than one-third of the MCA territory should generally be excluded. More subtle baseline changes, such as an isolated insular ribbon sign or limited lentiform nucleus edema alone are not considered contraindications for thrombolysis. Current work suggests that perfusion-sensitive CT and MR techniques may also prove useful in identifying ischemic but still salvageable tissue (ischemic penumbra) to help guide selection of patients for acute treatment beyond 3 hours. The treatment window of opportunity may also widen beyond 4.5 hours as intra-arterial interventions and neuroprotective drugs are introduced in clinical use.
Diffusion-Weighted MR in Acute Ischemia. Diffusion-weighted imaging (DWI) uses a novel form of MR tissue contrast to noninvasively detect ischemic changes within minutes of stroke onset. Diffusion-weighted images are acquired by applying a strong gradient pair that sensitizes the images to microscopic (Brownian) water motion. Brain water diffusion rates fall rapidly during acute ischemia, recovering to normal over days or weeks in infarcted tissues. Since random water motion is slowed down in areas of acute ischemia, the early infarct stands out as bright signal on DWI, compared with a dark signal (dephasing) in the normal areas. Acute stroke patients may show clear DWI changes hours before any abnormality can be seen on spin–echo T2-weighted MR (Fig. 4.5). This can also be a useful way to distinguish new ischemic areas (high signal on DWI) from older lesions (normal or low signal on DWI). By using a series of different diffusion gradient strengths, the process may also be quantified in an apparent diffusion coefficient (ADC). The ADC reflects “pure” diffusion behavior, free of any underlying T2 contributions (“shine though” or “dark through”). DWI acquisition is facilitated using echo–planar MR systems with their inherently faster, stronger gradients and rapid digitization equipment.
Fluid-Attenuated Inversion Recovery (FLAIR) in Ischemia. FLAIR allows heavy T2 weighting of the parenchyma while simultaneously suppressing free water signal from the CSF. These techniques increase conspicuity of T2 changes in ischemia. FLAIR is not inherently better than T2-weighted MR for early detection of ischemia, but may be particularly helpful in detecting small lesions in the cortex and for exclusion of acute subarachnoid hemorrhage.
Subacute and Chronic Ischemia. In the subacute phase, edema leads to mass effect, ranging from slight sulcal effacement to marked midline shift with brain herniation, depending on the size and location of infarct. These changes peak at 3 to 7 days, with progressive brain softening (encephalomalacia) ensuing thereafter. One potential imaging pitfall, the “fogging effect”, may be encountered on CTs done during the second week after infarction as edema and mass effect are subsiding. At this stage, decrease in edema and accumulation of proteins from cell lysis balance one another such that brain morphology and density in the injured region can be nearly normal by CT. Fogging effects are much less of a problem on MR due to its greater tissue sensitivity, particularly when contrast is used (Fig. 4.6). Edema or mass effect that persists beyond 1 month effectively rules out simple ischemia, and should raise the possibility of recurrent infarction or an underlying tumor.
In the weeks and months following infarction, macrophages remove dead tissue, leaving a small amount of gliotic scar and encephalomalacia behind. CSF takes up the space previously occupied by brain. The affected corticospinal tract atrophies (Wallerian degeneration) leading to a shrunken appearance of the ipsilateral cerebral peduncle. If hemorrhage accompanied the infarct, hemosiderin may be seen grossly or detected as signal hypointensity by T2-weighted images (T2WI). Widening of adjacent sulci and “ex-vacuo” dilatation of the ventricle occurs adjacent to the infarcted area (Fig. 4.7).
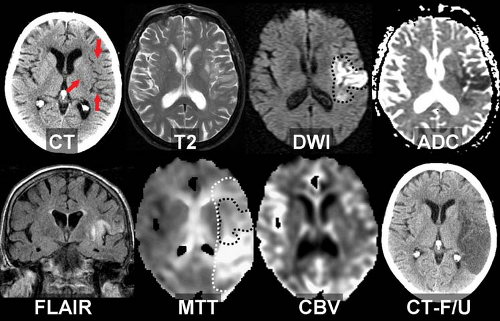 Figure 4.5. Diffusion–Perfusion Mismatch in Acute Ischemia. This 86-year-old woman with a history of atrial fibrillation developed sudden right hemiplegia and aphasia. The noncontrast CT shows subtle low attenuation in the left putamen, insula, and sylvian cortex (arrows). On T2WI, the cortical gray matter shows mild edema, confirmed to represent cytotoxic edema on DWI and apparent diffusion coefficient (ADC). Fluid-attenuated inversion recovery (FLAIR) image shows cortical edema and stasis in the left middle cerebral artery. Perfusion-weighted images (mean transit time, MTT, and cerebral blood volume, CBV) show a larger area at risk extending into the parietal lobe (MTT defect in white dashes; DWI lesion superimposed in black dashes). The hypoperfused tissue not yet infarcted is considered tissue at risk, or the ischemic penumbra. Diffusion lesions tend to “grow into” severe surrounding perfusion lesions if untreated. Follow-up CT shows extension of infarction into the penumbral tissue identified by MTT. |
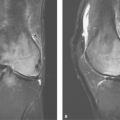
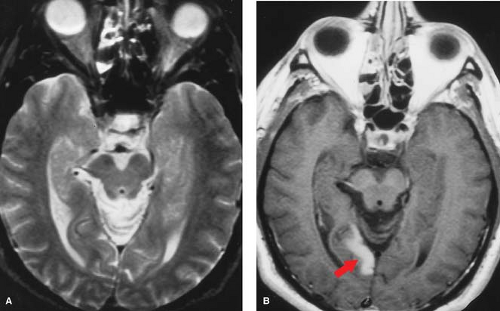 Figure 4.6. Fogging Effect in Subacute Infarction. As edema and mass effect subside, but before development of atrophy, infarcts may be inconspicuous on unenhanced CT or MR images. A. T2WI is essentially normal in the occipital regions 13 days after right posterior cerebral artery infarction. B. T1WI after gadolinium show enhancement of the infarcted deep right occipital cortex (arrow). |
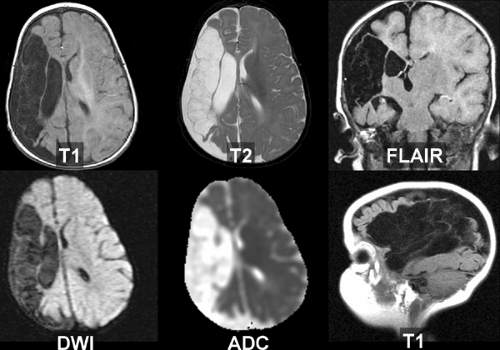 Figure 4.7. Chronic Infarction. Cystic encephalomalacia in present in the right middle cerebral artery territory on MR in a 7-month-old with neonatal infarction. Note cystic changes approach CSF on all sequences, including DWI and apparent diffusion coefficient (ADC), with minimal gliosis. There is volume loss with widening of the ipsilateral ventricle (ex-vacuo dilatation). |
Hemorrhagic Transformation of Infarction
Reperfusion into infarcted capillary beds may secondarily lead to gross or microscopic hemorrhage, seen in up to half of infarcts. In most cases, this takes the form of microscopic leakage (diapedesis) of red blood cells, but on rare occasions, a frank hematoma will form. Physical disruption of the capillary endothelial cells, loss of vascular autoregulation, and anticoagulation or thrombolytic use may all contribute to the development of these hemorrhages. Patients may develop headaches at the time of bleeding, but commonly have no new symptoms, presumably because the hemorrhage occurs within brain areas that are already dead or dysfunctional. Hemorrhagic infarction is confined to the territory of the infarcted vessel, whereas primary hemorrhage does not necessarily respect vascular boundaries. Intraventricular extension is uncommonly seen with hemorrhagic transformation and should raise the possibility of another process (such as hypertensive bleed or a ruptured arteriovenous malformation).
The peak time for hemorrhagic transformation is at about 1 to 2 weeks post infarction. It is usually manifest as a serpiginous line of petechial blood following the gyral contours of the infarcted cortex. These dots of hemorrhage are often patchy and discontinuous. On CT, a faint line of high attenuation is observed, and on MR, bright signal is seen along the affected gyrus on the unenhanced T1WI because of methemoglobin (Fig. 4.8A). (Alternate explanations for this bright signal have been offered, including laminar necrosis or calcification related
to infarction; the practical point is to recognize this appearance as a feature of ischemia.) The petechial gyral pattern is not seen in primary brain hemorrhage and can be helpful in confirming the underlying ischemic etiology of a suspicious lesion. This is considered a normal part of the evolution of an infarct. Management in the presence of petechial hemorrhage is controversial, but many neurologists continue anticoagulation if there is a well documented embolic source.
to infarction; the practical point is to recognize this appearance as a feature of ischemia.) The petechial gyral pattern is not seen in primary brain hemorrhage and can be helpful in confirming the underlying ischemic etiology of a suspicious lesion. This is considered a normal part of the evolution of an infarct. Management in the presence of petechial hemorrhage is controversial, but many neurologists continue anticoagulation if there is a well documented embolic source.
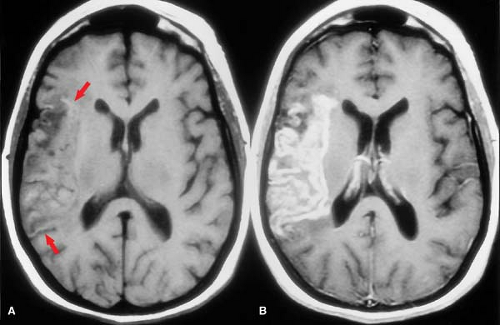 Figure 4.8. Petechial Hemorrhage and Gyral Enhancement in Subacute Infarction. A. Precontrast T1WI shows mild effacement of sulci in the right middle cerebral artery territory. A few subtle areas of bright signal intensity scattered along the cortex indicate areas of petechial hemorrhage or laminar necrosis (arrows). B. Postcontrast T1WI demonstrates marked gyral enhancement, a hallmark of subacute infarction. |
More extensive hemorrhagic transformation of the infarcted tissue may lead to the formation of a gross parenchymal hematoma. Here the blood does not conform to a gyrus and may form a clot indistinguishable from a primary hematoma. Large cortical infarcts are at somewhat higher risk for this type of change, compared with limited cortical or subcortical lesions. Catastrophic hemorrhagic transformation can also follow thrombolysis, particularly when treatment is delayed or the baseline CT shows extensive edema. In contrast to the petechial gyral transformation described earlier, gross parenchymal hematomas tend to occur earlier and are more commonly associated with clinical deterioration. Confluent hematomas seen on infarct follow-up studies should be reported promptly since anticoagulation therapy is contraindicated, even when the finding is incidental.
Use of Contrast in Ischemic Stroke
CT Contrast. A noncontrast CT remains the radiologic exam of choice for emergency assessment of suspected acute stroke. The unenhanced study is necessary to help triage the patient. It serves to rule out hemorrhage, may define patterns and extent of ischemic injury, shows areas of abnormal vascular calcification (e.g., giant aneurysms), and excludes mass lesions. This is important first-line information needed by the clinician faced with determining the need for lumbar puncture, vascular surgery, anticoagulation, thrombolysis, cardiac evaluation, or other therapies. All acute stroke CTs should, however, be reviewed on the scanning console or PACS system since the unenhanced study may rarely show the need for intravenous contrast. A nonstroke lesion such as a tumor, abscess, or an isodense subdural hematoma might be suspected on the noncontrast exam and then be shown to better advantage with contrast. Although MRI with diffusion sequences is arguably better than CT for acute stroke triage, the speed and 24/7 practicality of CT win out as the modality of choice in most centers.
Older studies suggested contrast is contraindicated in brain infarction. They cite a slightly increased risk of seizures and other untoward central nervous system effects, presumably due to a toxic effect of the contrast as it leaks through the abnormal blood–brain barrier. Most of this data, however, is based on studies using ionic contrast media. Recent CT protocols have safely used contrast not only to exclude tumor or infection but also to evaluate vessels (CT angiography) and blood delivery (CT perfusion).
An intact blood–brain barrier normally excludes contrast from the brain. Leakage of macromolecular contrast agents through damaged vessels leads to local accumulation of iodine, seen as high attenuation (enhancement) of infarcted parenchyma. Blood–brain barrier breakdown underlies both hemorrhagic transformation and contrast enhancement of infarctions. Not surprisingly, then, these processes are seen at roughly the same time and often in combination. As with petechial gyral hemorrhage, a gyral pattern of enhancement (by CT or MR) is highly specific evidence of an underlying infarction. CT-detected enhancement of infarcted brain parenchyma typically begins at about 1 week, peaks at 7 to 14 days, often assumes a gyral pattern, and is less commonly observed in subcortical regions (Fig. 4.8B). Enhancement is seen in about half of patients during the first week and in about two-thirds between weeks 1 and 4. As gliosis ensues and the blood–brain barrier is repaired, enhancement fades and then resolves by 3 months.
MR Contrast. Most of the comments regarding the strategy, pathophysiology and enhancement patterns for CT also generally hold true for contrast in MR. Intravenous gadolinium contrast agents are very well tolerated by stroke patients and may give valuable information not readily available from the noncontrast MR. Stasis of gadolinium within vessels or leakage of contrast through an abnormal blood–brain barrier will shorten T1 relaxation of adjacent protons, leading to hyperintensity (enhancement) on T1WI. As with CT, a noncontrast MR sequence is mandatory before contrast is given since enhancement and subacute blood both appear hyperintense on T1WI. (This will be discussed in the “Hemorrhage” section.) An intravenous bolus of contrast may also be captured dynamically using rapid imaging techniques to produce a family of perfusion-weighted images to help identify ischemic regions.
Intravascular enhancement on MR is commonly seen in the infarcted territory during the first week. This may be due to slow flow or vasodilatation leading to stasis of gadolinium, likely in both arteries and veins. The intravascular enhancement pattern may be detected within minutes of vessel occlusion, is seen in a majority of cortical infarcts at 1 to 3 days, and resolves by 10 days. The proximal trunks of more distally occluded arteries and leptomeningeal cortical channels are most prominently involved (Fig. 4.9). The area of vascular enhancement may extend beyond the T2 hyperintensity, possibly indicating recruitment of collateral supply at the ischemic border. Meningeal enhancement which attends meningitis, and dural enhancement seen post operatively can superficially resemble intravascular enhancement, but the distinction should be obvious on clinical grounds. MR intravascular enhancement helps identify early strokes, indicates ongoing slow flow, and has no obvious CT counterpart.
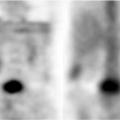
MR parenchymal enhancement occurs in a similar pattern to that seen on CT (and with the same time course seen by nuclear medicine infarct scans of the past). It may occur as early as day 1, but more typically begins after the first week, a time when intravascular enhancement is waning (Fig. 4.10). Reperfusion after thrombolysis can lead to early enhancement. Virtually all cortical infarcts enhance by MR at 2 weeks. Elster has summarized this in his Rule of 3s: MR parenchymal enhancement peaks at 3 days to 3 weeks and resolves by 3 months.
The imaging time course for CT and MR examinations in brain infarction are summarized in Table 4.2.
Pattern Recognition in Ischemic Stroke
Familiarity with the major vascular territories can help distinguish between infarction and other pathologic processes. The clinical time course and localization should be consistent with the imaging findings, and all should correspond to a known vascular distribution. Stroke localization is not necessarily synonymous with “focal.” An ischemic event may cause a pattern of damage which is diffuse (hypoxic–ischemic injury), multifocal (vasculitis, emboli), or focal (single embolism or thrombus). The vessels causing stroke may be large or small, and may be on either the arterial or venous side. There is no such thing as a “funny” stroke; if it does not fit a vascular territory then the differential diagnosis changes (Fig. 4.11).
The relation of vascular anatomy to functional neuroanatomy is at the heart of clinicoradiologic correlation in stroke. Classically strokes and TIAs are divided into anterior (carotid territory) or posterior (vertebrobasilar territory) events.
Patients with anterior circulation ischemia have been shown to benefit from carotid endarterectomy when the carotid is narrowed by at least 70% compared to its normal diameter. Surgery has not been proven beneficial for patients with lesser degrees of carotid stenosis or those with posterior territory TIAs, who therefore usually receive medical therapy (e.g., anticoagulation). Ischemia in the carotid territory may cause visual changes, aphasia, or sensorimotor deficits due to retinal, cortical, or subcortical damage. Vertebrobasilar strokes are more likely to cause syncope, ataxia, cranial nerve findings, homonymous visual field deficits, and facial symptoms opposite those of the body. A given deficit can be predicted from the known functional topography of the cortex and its connections through the internal capsule. (Fig. 4.12)
Patients with anterior circulation ischemia have been shown to benefit from carotid endarterectomy when the carotid is narrowed by at least 70% compared to its normal diameter. Surgery has not been proven beneficial for patients with lesser degrees of carotid stenosis or those with posterior territory TIAs, who therefore usually receive medical therapy (e.g., anticoagulation). Ischemia in the carotid territory may cause visual changes, aphasia, or sensorimotor deficits due to retinal, cortical, or subcortical damage. Vertebrobasilar strokes are more likely to cause syncope, ataxia, cranial nerve findings, homonymous visual field deficits, and facial symptoms opposite those of the body. A given deficit can be predicted from the known functional topography of the cortex and its connections through the internal capsule. (Fig. 4.12)
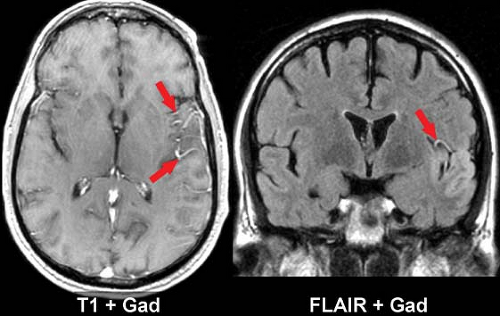 Figure 4.9. Intravascular Stasis and Enhancement in Acute Infarction. Postcontrast T1 and fluid-attenuated inversion recovery (FLAIR) images in acute left middle cerebral artery (MCA) infarction. Mild sulcal effacement and prominent enhancement of sylvian branches of the MCA (arrows) are evident on T1. As seen here, FLAIR can show similar vascular signs of stasis, either before or after contrast. Intravascular enhancement is typically seen only during the first 10 days after stroke. |
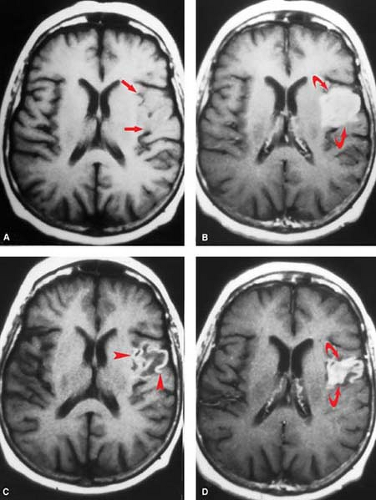 Figure 4.10. Evolution of Petechial Hemorrhage and Parenchymal Enhancement. Before and after contrast T1WI in left sylvian cortical infarction. The acute study (A and B) shows nonhemorrhagic swelling (straight arrows) with prominent cortical enhancement (B, curved arrows). At 2-month follow-up (C and D) petechial hemorrhage (arrowheads) and decreasing parenchymal enhancement (D, curved arrows) are seen. Parenchymal enhancement resolves by 3 months. |
Table 4.2 Imaging Time Course After Brain Infarction | ||||||||||||||||||||||||
|---|---|---|---|---|---|---|---|---|---|---|---|---|---|---|---|---|---|---|---|---|---|---|---|---|
|
The patterns of injury observed after occlusion of large arteries in the anterior and posterior circulations, small arteries in any region, and of the dural venous channels are reviewed in turn.
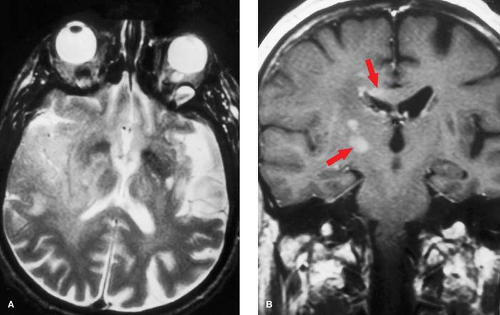 Figure 4.11. Glioblastoma Mimicking a Stroke. A. T2-weighted axial section shows edema primarily in the right middle cerebral artery territory, but with additional involvement of the medial temporal lobe, thalamus, and periatrial regions. B. Postcontrast coronal T1WI shows patchy, nodular areas of enhancement in the basal ganglia and periventricular regions (arrows). Even with a strong clinical history for strokelike onset, the nonvascular distribution and atypical enhancement pattern effectively exclude underlying infarction. When in doubt, follow-up imaging studies will usually clarify the diagnosis. |
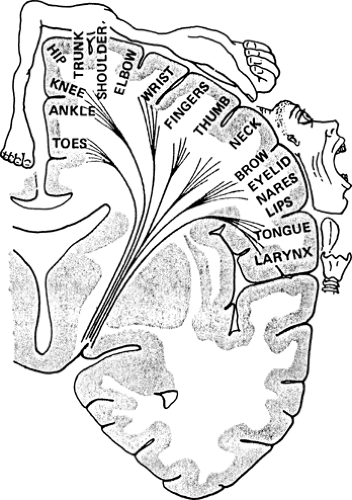 Figure 4.12. Homunculus. A coronal section through the precentral (motor) cortex depicts the topographic representation of the opposite side of the body. The face and hand areas are served by the middle cerebral artery territory, the leg by the anterior cerebral artery. (From Gilman S, Winans SS. Essentials of Clinical Neuroanatomy & Neurophysiology. Philadelphia: F.A. Davis Company, 1982.) |
Anterior (Carotid) Circulation
Internal Carotid Artery (ICA). Thromboembolic disease in the ICA may cause TIAs or infarction in its middle cerebral artery or anterior cerebral artery branches or in the watershed zone between them. Embolic occlusion of the ophthalmic branch of the ICA may cause transient monocular blindness (amaurosis fugax). Observation of any of these patterns should prompt imaging of the carotid arteries. The extent and distribution of ischemia observed depends on the time course of occlusion, degree of oligemia, and available collateral supply. Complete carotid occlusions are occasionally found in asymptomatic patients with a well-developed collateral supply.
Atherosclerotic disease near the carotid bifurcation is responsible for the majority of ischemic events in the ICA territory. Arterial dissection, trauma, fibromuscular dysplasia, tumor encasement, prior neck radiotherapy, and connective tissue diseases may also cause significant carotid narrowing. (Fig. 4.13). Hemodynamic effects begin to be seen when there is >80% reduction in area or >60% decrease in diameter. Lesions causing less severe narrowing may nonetheless become symptomatic when they serve as a nidus for thrombus formation or are unmasked by hypotension. Studies have shown a clear benefit of endarterectomy in symptomatic patients with >70% stenosis but not for those with <30% narrowing. In many centers, carotid stents are now used in place of surgery, especially for high-risk patients.
Noninvasive screening of the carotid arteries may be achieved with either US, MR angiography (MRA), or CT angiography (CTA). The choice of modality depends on the abilities of the available personnel and equipment. Sensitivity and specificity are as high as 85% to 90% for each of these techniques. These methods noninvasively identify patients with hemodynamically significant disease who might then be referred for conventional angiography or directly to intervention. US is the most commonly employed screening exam in most centers. It has the advantage of portability, generally lower costs, and can be performed in patients with contraindications to MR/MRA. US is more operator dependent than is MRA and is unable to reliably assess portions of the distal ICA near the skull base. CTA provides excellent visualization from the arch to intracranial circulation, but at the small risk of contrast toxicity and radiation exposure. MRA can evaluate the entire course of the carotid and may be quickly performed in conjunction with the patient’s brain MR study. It is a particularly good method for screening pediatric or elderly patients in whom conventional angiography may be technically more difficult.
Selective common carotid angiography remains the gold standard for preprocedure carotid artery evaluation, but is being replaced by noninvasive studies in many centers. The study should cover the entire ICA, including cervical and cranial portions. Evaluation of the surgically inaccessible cranial segments (petrous, cavernous, and supraclinoid) is necessary to exclude high-grade intracranial stenoses or “tandem” lesions, which might contraindicate endarterectomy.
Anterior Cerebral Artery (ACA). The terminal bifurcation of the ICA is into the anterior and middle cerebral arteries (Fig. 4.14). The ACA is divided into three subgroups: medial lenticulostriates serve the rostral portions of the basal ganglia; pericallosal branches supply the corpus callosum; and hemispheric branches serve the medial aspects of the frontal and parietal lobes (Fig. 4.15). About 5% of infarcts involve the ACA.
The medial lenticulostriates penetrate the anterior perforating substance to give variable supply the anterior–inferior aspect of the internal capsule, putamen, globus pallidus, caudate head, and portions of the hypothalamus and optic chiasm. The largest of these vessels supplies the caudate head/anterior internal capsule region and is recognized as our friend, the recurrent artery of Heubner. Infarction in the medial lenticulostriate territory may cause problems with speech production (motor aphasia), facial weakness, and disturbances in mood and judgment.
Above the take-off of the lenticulostriates, the ACAs are interconnected by the anterior communicating artery. Each ACA ascends further, giving off branches to the frontal pole (orbitofrontal and frontopolar arteries). The ACAs terminate as a bifurcation into the (lower) pericallosal and (upper) callosomarginal branches. These arteries run parallel to the corpus callosum from front to back, giving supply to the medial cortex of the frontal and parietal lobes. As its name would imply the pericallosal artery courses around and feeds the corpus callosum. ACA branching patterns are quite variable from one patient to the next, with about 10% having only one pericallosal branch which supplies both hemispheres, an “azygous” ACA (Fig. 4.16).
Unilateral damage in the ACA hemispheric branches will cause preferential leg weakness on the opposite side of the body (Table 4.3). Bilateral ACA infarctions lead to incontinence and an awake but apathetic state known as akinetic mutism. Infarction of the corpus callosum can cause a variety of interhemispheric disconnection syndromes.
Related posts:
Stay updated, free articles. Join our Telegram channel

Full access? Get Clinical Tree


