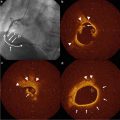
Fig. 10.1
TVC imaging system, which is a combination NIRS and IVUS system. (a) The console includes two touch-screen monitors displaying the NIRS chemogram and IVUS images (transverse and longitudinal). (b) The catheter contains fiber optics and mirrors for near-infrared light, as well as a coax cable and a transducer for ultrasound
In the NIRS modality, the resulting spectra are processed and interpreted by the LCP detection algorithm to generate a longitudinal image (called a chemogram) of the scanned artery segment (Fig. 10.2). Each spectral measurement is assigned a probability of LCP by the detection algorithm and displayed in a false color map (Fig. 10.3) with colors ranging from red (low probability of LCP) to yellow (high probability of LCP). From the chemogram, a summary metric of the probability that an LCP is present in a 2-mm interval of the pullback is computed and displayed in a supplementary false color map called a block chemogram (Fig. 10.2b). Blocks correspond to one of four discrete categories, each represented by a distinct color (red, orange, tan, and yellow, in increasing order of LCP probability).
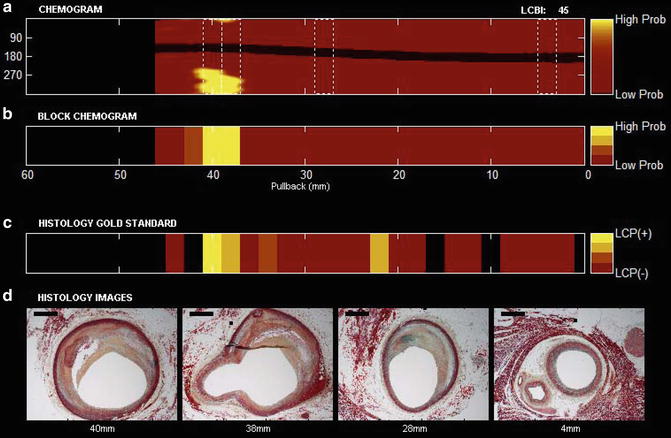
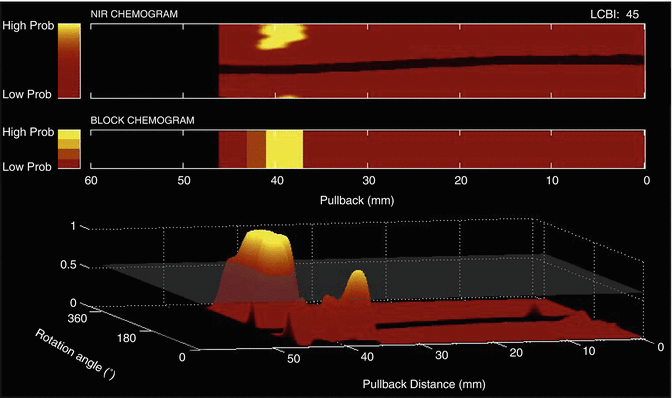

Fig. 10.2
NIRS pullback and selected histologic findings from a human coronary artery segment. (a) Chemogram image indicating LCP content by NIRS (x-axis = pullback distance in mm, y-axis = rotation angle in degrees). Pixel colors range from red for low probability to yellow for high probability of LCP. The contiguous black region is the guide wire. (b) Block chemogram image indicating summary metric of the presence of LCP at 2-mm intervals in four probability categories. (c) Diagram demonstrating the presence of LCP by histologic evaluation. (d) Movat cross-sections from locations along the artery indicated by dotted boxes in the chemogram. Image interpretation: The chemogram shows large LCP signals from 36 to 42 mm. The block chemogram indicates that there is the region of the strongest signal. Histology (panel c and d) confirms the presence of fibroatheroma at this location

Fig. 10.3
Illustration of the lipid core burden index (LCBI). The LCBI (top right) shows the proportion of lipid in a scanned artery on a 0–1,000 scale. The LCBI is calculated as the fraction of valid pixels in the chemogram that are yellow, multiplied by a factor of 1,000. Yellow pixels are those whose values (probability of LCP) exceed a specified threshold, as indicated by the horizontal plane in the bottom panel
An additional metric, the lipid core burden index (LCBI), is used to quantify the amount of LCP in a scanned artery segment. The LCBI is defined as the fraction of yellow pixels in the chemogram multiplied by 1,000 (0–1,000 scale). Figure 10.3 illustrates the computation of the LCBI.
The transverse IVUS image is overlaid with a chemogram ring taken from the corresponding longitudinal location in the chemogram, and the block chemogram color is displayed in the catheter artifact. In addition, the longitudinal IVUS image is aligned with the chemogram and block chemogram.
Research and Clinical Utility of the NIRS and IVUS Catheter
In April 2008, the US Food and Drug Admini-stration (FDA) cleared coronary NIRS for clinical use in the USA [15]. The clearance was based on the autopsy validation data [11] and the demonstration of similarity between clinical and autopsy spectra [12]. NIRS was approved for the detection of lipid core containing plaques of interest and the assessment of lipid core burden in coronary arteries. In June 2010 the FDA approved the combination NIRS-IVUS catheter.
Potential clinical applications of NIRS include: (1) improving the safety of percutaneous coronary interventions (PCIs), (2) identifying coronary lesions at risk for causing subsequent clinical events and selecting an optimal medical management, and (3) evaluating novel anti-atherosclerotic therapies. All these applications are currently undergoing extensive clinical evaluation.
PCI Outcome Optimization
In spite of the rapid evolution of PCI techniques, complications such as peri-procedural myocardial infarction (MI) [16] distal embolization and acute stent thrombosis [17] continue to occur. NIRS imaging can improve the safety of PCI by enabling rapid, easy, and accurate prediction of the risk of peri-procedural complications, such as no-reflow and peri-procedural acute myocardial infarction and, as a result, providing guidance for the use of clinical measures to prevent such complications.
NIRS for Predicting Peri-procedural Myocardial Infarction
PCI of a large LCP, as detected by NIRS, has been associated with high risk for distal embolization, no-reflow, and post-PCI myocardial infarction [18–23]. Four published case reports and two case series have described an association of large LCP by NIRS with no-reflow and with post-PCI myocardial infarction (MI) (Table 10.1). Goldstein et al. [18], Saeed et al. [19], and Fernandez-Friera et al. [23] presented case reports of no-reflow, whereas Schultz et al. [20] presented a case of transient chest pain and post-PCI MI after stenting of lesions containing large LCPs.
Table 10.1
Published studies evaluating the association between NIRS findings and post-percutaneous coronary intervention myocardial infarction and no-reflow
Author | Year | n | Near-infrared spectroscopy finding | Outcomes |
|---|---|---|---|---|
Case reports | ||||
Goldstein et al. [18] | 2009 | 4 | Large LCP by NIRS was found in 3 cases | No-reflow occurred in two cases—one case was an autopsy case in which thrombus was formed at LCP site |
Saeed et al. [19] | 2010 | 1 | Large circumferential LCP | Slow flow post-LAD stenting |
Schultz et al. [20] | 2010 | 1 | Large, near-circumferential LCP | Transient chest discomfort post-stenting and post-PCI MI |
Fernandez-Friera et al. [23] | 2010 | 1 | Large circumferential LCP | PCI complicated by transient no-reflow and a periprocedural MI (peak troponin, 8.1 ng/mL) |
Case series | Year | n | Large LCP definition | Post PCI MI definition |
|---|---|---|---|---|
Raghunathan et al. [21] | 2011 | 30 | Two or more yellow blocks on block chemogram | Several thresholds were used (CK-MB increase >1×, 2×, and 3× ULN) |
Goldstein et al. [22] | 2011 | 62 | maxLCBI4 mm ≥500 | CK-MB or troponin increase >3× ULN |
Raghunathan et al. evaluated the association between the presence and extent of coronary LCPs detected by NIRS performed prior to PCI with post-procedural myocardial infarction [21] using various LCP and MI definitions. Compared to patients who did not have post-PCI MI, those who experienced post-PCI MI had similar clinical characteristics but received more stents and had more yellow blocks within the stented lesion. CK-MB level elevation >3× the upper limit of normal was observed in 27 % of patients with two or more yellow block vs. in none of the patients with 0–1 yellow blocks within the stented lesion (p = 0.02).
Goldstein et al. studied 62 patients undergoing PCI from the COLOR registry [22]. The extent of LCP in the treatment zone was calculated as the maximal LCBI measured by NIRS for each of the 4-mm longitudinal segments in the treatment zone. Peri-procedural MI occurred in nine patients (14.5 %). Seven of 14 patients (50 %) with a maxLCBI4mm of ≥500 had post-PCI MI compared to 2 of 48 patients (4.2 %) with maxLCBI4mm <500 (p = 0.0002).
Several other studies using various intracoronary imaging modalities have demonstrated that the presence of LCP (thin-cap fibroatheroma, as assessed by OCT [24], necrotic core, as assessed by IVUS-VH [25], and attenuated plaque [26], as assessed by IVUS) are associated with higher incidence of no-reflow and post-PCI MI. Therefore, LCP-containing lesions are at increased risk for causing complications and could form the target for preventive and therapeutic interventions. Although patients with acute coronary syndromes are more likely to have LCPs, approximately half of patients with stable angina also had LCPs [27] within their culprit lesions, suggesting that some stable angina patients may also be at increased risk for post-PCI complications.
Whether NIRS can help identify saphenous vein graft (SVG) lesions at high risk of distal embolization is under investigation; however, Wood et al. recently demonstrated that ostial SVG lesions were less likely to have LCPs, as detected by NIRS, compared to body lesions [28]. This lower frequency of LCP in the ostial and anastomotic lesions might explain the lower likelihood of post-PCI myocardial infarction in these lesions compared to SVG body lesions [29, 30].
NIRS-Based Insights into the Mechanism of Peri-procedural Myocardial Infarction
Whether distal embolization, thrombosis, or side-branch occlusion is the main cause of post-PCI MI remains under evaluation. Selvanaygam et al. described two patterns of myocardial injury post-PCI: one adjacent to the area of stent, presumably due to epicardial side branch occlusion and one involving the distal myocardial segment supplied by the target coronary artery, likely due to distal embolization [31].
Two pilot NIRS-based studies have provided insights on the mechanism of post-PCI MI. In the first study, an embolic protection device (EPD) was used in nine patients with large LCPs undergoing PCI [32] (Fig. 10.4). EPD use resulted in capture of embolized material in eight of the nine lesions: the captured material mainly consisted of fibrin and platelet aggregates, suggesting that a major mechanism of peri-stenting infarction might be distal embolization of thrombi associated with exposure of blood to LCP in the lesion. Post-PCI MI occurred in two patients (22 %), in one of whom two filters were required because of significant debris distal embolization causing “clogging” of the filter. The role of distal embolization in post-PCI MI is further supported by several studies showing a significant decrease in LCBI post-stenting [32, 33].
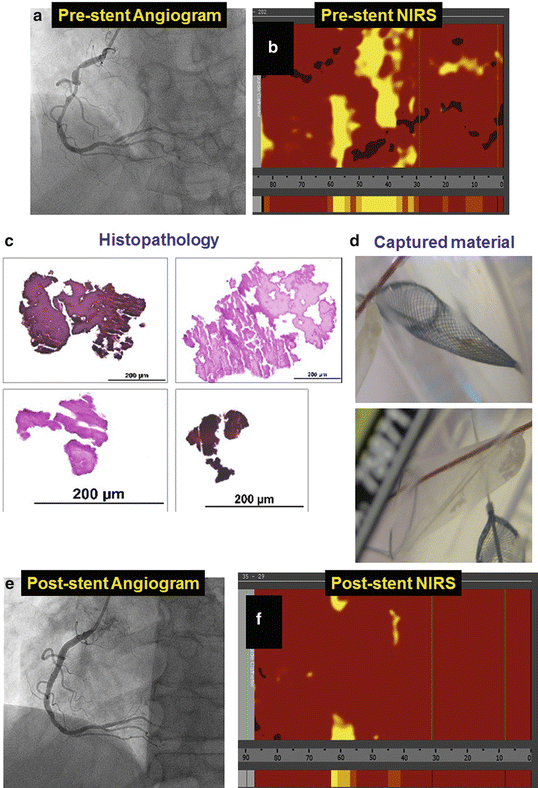

Fig. 10.4
Example of distal embolization and thrombus formation in a patient undergoing percutaneous coronary intervention. Coronary angiography demonstrating diffuse right coronary artery obstructive disease (panel a) with large lipid core plaque (LCP) by near-infrared spectroscopy (panel b). Stenting of the right coronary artery was performed using a filter for embolic protection. Fibrin and platelet aggregates (panel c) were retrieved in the filter (panel d) post-PCI. An excellent angiographic result as obtained (panel e) along with reduction of the LCP size (panel f)
Papayannis et al. extended the above observation by describing that stenting of large LCPs (defined as at least three 2-mm yellow blocks on the NIRS block chemogram with >200° angular extent) was more likely to lead to in-stent thrombus formation (as detected by optical coherence tomography) compared to stenting coronary lesions without large LCP [34]. Two of three patients with a large LCP (67 %) developed intrastent thrombus post-stent implantation (Fig. 10.5) compared to none of six patients without large LCPs (0 %, p = 0.02). This may be due to the high thrombogenicity of the lipid core with direct activation of platelets by the oxidized lipids, but also to the high content of active tissue factor in the lipid core, that can trigger the extrinsic clotting cascade [35]. As noted above, it is possible that the thrombus formed within the stent subsequently embolizes and EPD use may prevent embolization not only of the LCP but also of the platelet or fibrin thrombus. Interestingly, similar observations were made in an intravascular imaging study that used optical coherence tomography: Porto et al. analyzed 50 patients undergoing PCI and found three predictors or post-PCI MI: thin-cap fibroatheroma (OR 29.7, 95 % CI 1.4–32.1), intrastent thrombus (OR 5.5, 95 % CI 1.2–24.9), and intrastent dissection (OR 5.3, 95 % CI 1.2–24.3) [24].
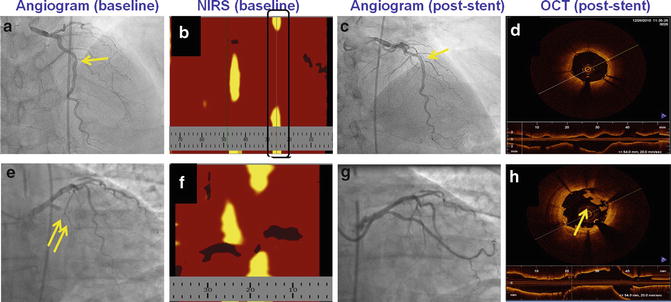

Fig. 10.5
Example of in-stent thrombus formation post-stenting of a large LCP. A patient underwent stenting of a lesion in the mid left anterior descending artery that contained a small LCP (panel b) with an excellent angiographic result (panel c) and no in-stent thrombus formation (panel d). Another patient underwent stenting of a circumflex lesion (panel e) that contained a large LCP (panel f), and although a good angiographic result was achieved (panel g) intrastent thrombus formed post-deployment (panel h)
Given the above observations, although the optimal strategy for preventing post-PCI MI in high-risk lesions remains to be determined, it is likely that a combination strategy of an EPD and aggressive antiplatelet/anticoagulant therapy may be needed to prevent both distal embolization and the accelerated formation of intrastent thrombus that could subsequently embolize.
Several ongoing studies are evaluating the mechanism of post-PCI MI and potential preventive strategies. The Lipid Core Shift Study (NCT00905671) is examining whether PCI of large LCP lesions may cause plaque shift and side branch occlusion. The CANARY (Coronary Assessment by Near-infrared of Atherosclerotic Rupture-prone Yellow, NCT01268319) trial is a prospective randomized-controlled trial that is randomizing patients with large LCPs in native coronary arteries undergoing clinically indicated PCI to use a Filterwire (Boston Scientific, Natick, MA) or standard of care without EPD. The use of EPDs is currently only approved in the USA for SVG lesions [36].
Stay updated, free articles. Join our Telegram channel

Full access? Get Clinical Tree


