Chest Ultrasound
Sonography is complementary to chest radiography and CT in the evaluation of pathologic processes in the thorax. US commonly reveals abnormalities not shown by other imaging methods (Fig. 12.1) [1,2 and 3]. Although limited by air and bone, US visualization is made possible by the pathologic processes creating a sonographic window. Pleural effusion, pulmonary consolidation, atelectasis, and mediastinal tumors are sonographic portals to the thorax. US can be performed at the bedside of critically ill patients, avoiding the necessity of moving them and all their life support equipment to the radiology department [4]. US is excellent for guidance of diagnostic and therapeutic invasive procedures in the chest [5].
Imaging Technique
The first step in US examination of the thorax is to review the chest radiograph. The chest radiograph or chest CT provides a guide for sonography. The examination is then directed to answer the specific questions raised. Two basic approaches are used to examine the chest with US. The direct approach utilizes the intercostal spaces. Linear or curved array transducers with frequencies of 5.0-7.5 MHz are used to examine the pleura and structures in the near field-of-view. For large pleural effusions and for structures deeper in the chest a 3.5-MHz sector transducer may be used. However, the near field is obscured by reverberation artifact with sector transducers, and important findings related to the pleura and chest wall may be missed if only sector transducers are used (Fig. 12.2). The second approach to examination of the thorax is the transabdominal technique. A 3.5-MHz sector transducer is angled superiorly through the liver or spleen to examine the diaphragm and lower thorax (Figs. 12.3, 12.4)
The sector transducer can also be used to examine the mediastinum by angling downward from the sternal notch or by angling centrally from parasternal positions. Placing the patient in right or left lateral decubitus positions helps to enlarge the parasternal window [6]. Doppler is essential when examining the mediastinum to evaluate major vessels and to diagnose vascular lesions [7].
Anatomy
The pleural space is bounded by a continuous serosal membrane that forms the visceral pleura
covering the lungs and forming the interlobar fissures, and the parietal pleura that covers the mediastinum, diaphragm, and inner surface of the chest wall. The total thickness of both pleural membranes is only 0.2-0.4 mm. US does not directly demonstrate the normal pleura but rather shows the interface of the pleura with pleural fluid and the interface of the surface of the air-filled lung (Fig. 12.5). These interfaces serve as the sonographic
landmarks for evaluation of the pleura. The chest wall is identified by the characteristic appearance of the ribs. Ribs cause a bright surface echo and a dense acoustic shadow. Intercostal muscles extend between the ribs, providing an effective intercostal window. Subcutaneous fat is of variable thickness, so the ribs provide the best landmark for identification of the parietal pleura, which is approximately 1 cm deep to the surface echo of the rib. Between the parietal pleura and the chest wall is fatty connective tissue of variable thickness but rarely exceeding a few millimeters. The normal pleural space contains 1-5 mL of pleural fluid seen as a thin echolucent line between the two pleural interfaces (Fig. 12.6) [8]. Normal pleural fluid lubricates the pleural space easing motion of the lung with breathing. It also aids in providing an adhesive force that holds the lung open and against the chest wall. Pleural fluid, mass, or air breaks this adhesive seal and allows the lung to retract, resulting in atelectasis. The pleural space is easy to identify by observing the respiratory motion of the visceral pleura/lung interface, the “gliding sign” [9]. The bright, linear surface echo slides back and forth with inspiration and expiration. With breathing, streaks of bright reverberation artifacts emanate from the boundary of the visceral pleura and air-filled lung [10].
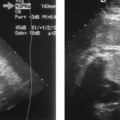
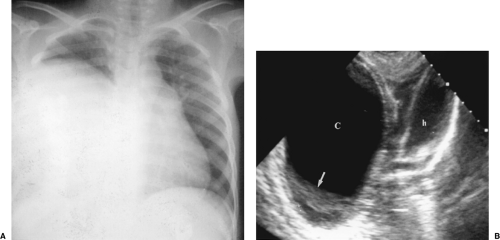 Figure 12.1 Utility of Chest US. A. Chest radiograph shows opacification of most of the right hemithorax but yields little information as to its nature. B. Transverse US image of the lower right thorax shows a large cystic mass (C) that displaces and compresses the heart (h). The cystic mass is thick-walled and contains layering echogenic debris (arrow). This proved to be a large pulmonary hydatid cyst. The layering echogenic debris is hydatid sand. |
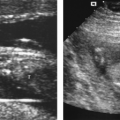
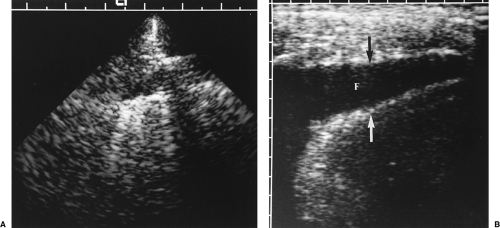 Figure 12.2 Limitation of Sector Transducers in the Thorax. A. 3.5-MHz sector transducer. Near-field artifact characteristic of sector transducers obscures the pleural space. B. 5.0-MHz linear array transducer. Use of a linear array transducer in the same intercostal space clearly reveals a pleural effusion (F). The interface of the parietal pleura (black arrow) and the visceral pleura/lung interface (white arrow) are well demonstrated. |
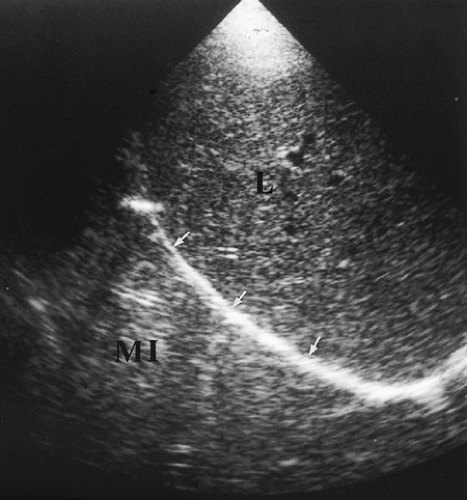 Figure 12.3 Normal Mirror Image Artifact. Longitudinal image obtained through the liver (L) shows the bright interface of the diaphragm (arrows) with air-filled lung above it. The soft tissue-air interface at the level of the diaphragm causes near-complete sound reflection back into the liver. Further reflection of the sound beam within the liver delays the return of the echoes to the transducer. As a result, an artifactual mirror image (MI) of the liver is displayed further from the transducer and above the diaphragm. The mirror image of the liver above the diaphragm should be recognized as an artifact, but also provides evidence that normal air-filled lung is present at the lung base. Compare to Figure 12.412.4. |
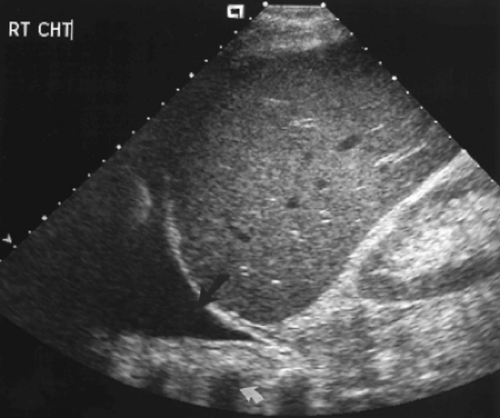 Figure 12.4 Pleural Effusion Seen from the Abdomen. Longitudinal image through the liver and right kidney shows a wedge of anechoic pleural fluid (black arrow) above the diaphragm. The sound wave penetrates the fluid and reveals the chest wall, recognized by rib shadows (white arrow). These findings are pathognomonic of pleural effusion. |
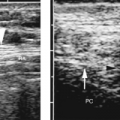
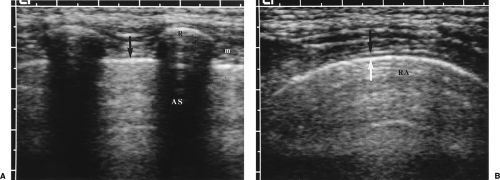 Figure 12.5 Normal Pleural Space. A. Longitudinal image obtained with a linear array transducer applied directly to the thorax demonstrates the bright surface echo produced by the ribs (R) and the dense acoustic shadow (AS) resulting from marked sound absorption by bone. The bright linear echo (arrow) produced by the interface of visceral pleura and air-filled lung indicates the location of the pleural space in this normal patient. This interface is observed on real-time scanning to move with respiration, the “gliding sign.” Note that the pleural space is within 1 cm of the rib surface echo. Intercostal muscles (m) are seen between the ribs. B. Turning the transducer to align with the intercostal space produces this transverse image. The gliding sign identifies the location of the parietal pleura (black arrow) and the visceral pleura (white arrow). Air-filled lung is obscured by reverberation artifact (RA). |
The normal lung is air-filled and is seen only as the bright linear surface echo and an intense reverberation artifact (Fig. 12.5, Fig. 12.6). Disease in the lung replaces air with fluid, inflammatory cells, or tumor, or collapses the air spaces of the lung to produce a solid structure that can be penetrated with US. Disease that is completely surrounded by air-filled lung will not be visible to US.
When scanning the thorax from an abdominal approach, the air-filled lung causes complete sound reflection and the curving surface of the diaphragm causes multipath reflection
of the US beam. This results in the striking mirror-image artifact described in Chapter 1. The image of the liver or spleen is duplicated above the diaphragm (Fig. 12.3). The presence of a mirror image artifact indicates that normal air-filled lung is above the diaphragm. Absence of the mirror image artifact is evidence of pathology in the lung base or pleural space.
of the US beam. This results in the striking mirror-image artifact described in Chapter 1. The image of the liver or spleen is duplicated above the diaphragm (Fig. 12.3). The presence of a mirror image artifact indicates that normal air-filled lung is above the diaphragm. Absence of the mirror image artifact is evidence of pathology in the lung base or pleural space.
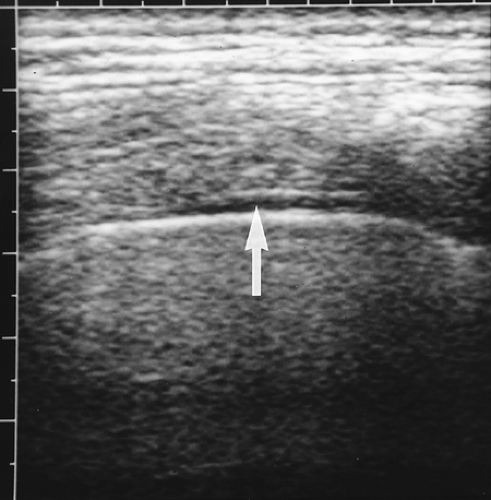 Figure 12.6 Normal Pleural Fluid. Intercostal image shows a sliver of normal pleural fluid (arrow) separating the parietal and visceral pleural surfaces. A tiny volume of pleural fluid is normally present. |
Pleural Space
The pleura is involved by pathologic processes that occur as isolated disease or as a complication of diseases of the lung, chest wall, or abdomen. Chest radiographs accurately detect pleural disease but are limited in providing characterization of the disease. Disease in the pleura provides an excellent window for US evaluation [10]. US is exceptionally valuable in guiding aspiration, biopsy, and catheter drainage procedures in the pleural space [11].
Pleural Effusion
Pleural effusion is an abnormal increase in the volume of pleural fluid. Fluid escapes from the blood vessels and lymphatics of the pleural surface as a result of a pathologic process. US is excellent in diagnosing the presence and volume of pleural fluid, and in assessing whether the fluid is amenable to aspiration [12]. Pleural effusions may be characterized as to whether they are transudates or exudates [13].
A layer of anechoic or hypoechoic pleural fluid separates the visceral and parietal pleura (Fig. 12.7).
On transabdominal scanning the mirror image artifact is absent. Fluid is seen above the diaphragm and the inside of the chest wall is visualized through the fluid layer. The chest wall is recognized by the acoustic shadows that emanate from ribs (Figs. (Fig. 12.4, Fig. 12.8).
Atelectasis is always present with pleural effusion (Fig. 12.8). An abnormal volume of pleural fluid releases the adhesive tension that holds the surface of the lung against the chest wall and the lung reflexly collapses. The atelectatic lung is seen as a wedge-shaped echogenic mass moving with respiration within the pleural fluid.
Signs that indicate that a pleural lesion is fluid that can be aspirated are: (a) change in shape of the lesion with respiration, (b) floating echodensities, and (c) moving fibrous strands [12].
The volume of pleural fluid can be estimated by US measurement of the distance between parietal and visceral pleura. The measurement is made with the patient supine and holding breath in maximal inspiration. Transverse scans are obtained in the intercostal space at the posterior axillary line just above the diaphragm. The maximum width of the fluid space is measured and related to the data shown in Table 12.1 [14].
Anechoic fluid may be either transudate or exudate. Aspiration and chemical analysis of the fluid is needed to differentiate the type of effusion [13].
Fluid that contains floating debris or has septations or fibrous strands is always an exudate [13].
US is exceptionally valuable in localizing pleural fluid and in guiding diagnostic or therapeutic thoracentesis.
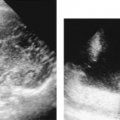
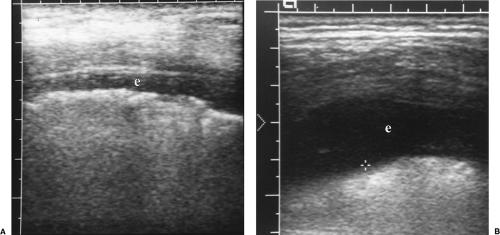 Figure 12.7 Pleural Effusions. Intercostal images with a linear array transducer from two patients (A, B) show small pleural effusions (e). Cursor (+) measures the distance to the lung surface. |
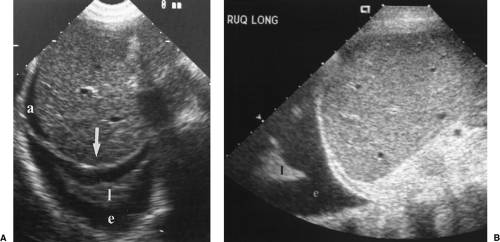 Figure 12.8 Pleural Effusions. A. Transabdominal image in transverse plane shows a large pleural effusion (e) with a wedge of echogenic collapsed lung (l). Atelectasis always accompanies pleural effusion. A small volume of ascites (a) is also evident. Note the bare area of the liver (arrow). B. Transabdominal image in longitudinal plane in a different patient shows a large pleural effusion (e) and right lower lobe atelectasis (l). |
Table 12.1: Quantification of Pleural Effusion Volume | |||||||||||||||||||||||||||||||||
|---|---|---|---|---|---|---|---|---|---|---|---|---|---|---|---|---|---|---|---|---|---|---|---|---|---|---|---|---|---|---|---|---|---|
| |||||||||||||||||||||||||||||||||
Transudative Pleural Effusion
A transudative pleural effusion is a simple serous pleural effusion. Transudates are ultrafiltrates of plasma from normal pleural membranes [13]. Transudates result from an underlying disease, such as congestive heart failure, that increases capillary hydrostatic pressure or causes a decrease in colloid osmotic pressure [8, 15]. Additional causes of transudative pleural effusion include cirrhosis, nephrotic syndrome, hypoalbuminemia, constrictive pericarditis, and superior vena cava obstruction.
Transudative pleural effusions are anechoic without floating debris (Figs. 12.4), (Fig. 12.7B) [13].
The fluid changes shape with respiration and positioning.
Exudative Pleural Effusion
Exudative pleural effusions are complicated effusions with high protein content (>3.0 gm/100 mL) and may contain blood, pus, chyle, or malignant cells. The pleura is abnormal and is directly involved with an inflammatory or neoplastic process. Causes include empyema and parapneumonic effusion, neoplasms involving the pleura, hemothorax, tuberculous pleurisy, and intraabdominal inflammatory processes such as abscess or pancreatitis.
Floating echogenic debris is seen within the pleural fluid (Fig. 12.9).
Homogeneous floating echodensities are indicative of hemorrhagic effusion parapneumonic effusion, or empyema [13].
Moving debris within the fluid scatters the US beam and produces color signals within the fluid—the fluid color sign [16]. This finding aids in the differentiation of echogenic pleural fluid from pleural thickening.
Linear fibrous bands form with organization of the exudative fluid (Fig. 12.10). These thin echogenic septa move to-and-fro with respiration and may cause loculation of the fluid. A honeycomb appearance is indicative of high likelihood of inability to drain the effusion with a small-bore catheter. These septa, seen easily with US, are not seen on chest radiographs and are often not apparent on CT.
The presence of thickened pleura or associated lung consolidation or masses are associated with exudative effusion (Fig. 12.11) [13].
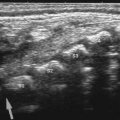
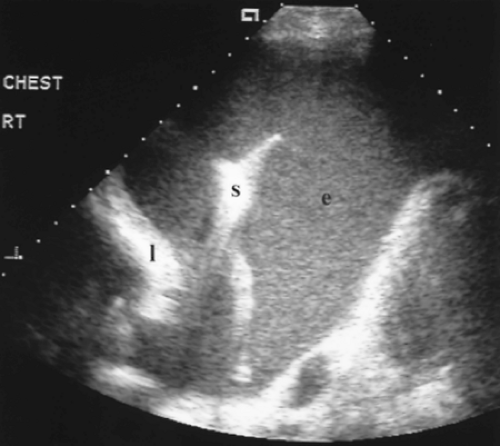 Figure 12.9 Exudative Parapneumonic Pleural Effusion. Transverse image shows a large echogenic pleural effusion (e). Real-time imaging revealed swirling motion of the particulate matter within the effusion. Echogenic particulate matter in a pleural effusion is indicative of an exudative effusion. This patient’s chest radiograph revealed a right lower lobe pneumonia in association with the large effusion. Thoracentesis confirmed the absence of bacteria within the exudative effusion. l, partially collapsed right lower lobe; rt, right; s, coarse septation within the effusion.
Related posts:Stay updated, free articles. Join our Telegram channel
Full access? Get Clinical Tree
 Get Clinical Tree app for offline access

|