CHORDOMA
KEY POINTS
- Chordomas are usually characteristic based on a combination of computed tomography and magnetic resonance imaging; thus, difficulty in differential diagnosis prior to tissue sampling is uncommon.
- Atypical features of chordoma in a central skull base mass should stimulate more expanded differential considerations.
- Chondrosarcomas are usually lesions of the petroclival fissure origin or most posteriorly and lateral.
- Some controversy still persists with regard to the terminology of chordomas and chondroid variants of chordomas, but this likely has little clinical relevance with regard to medical decision making or prognosis.
CLINICAL PERSPECTIVE AND PATHOLOGY
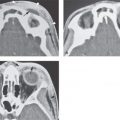
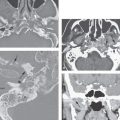
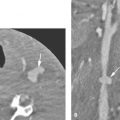
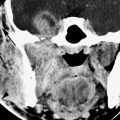
Chordomas are malignant neoplasms that arise from remnants of the embryonic notochord.1,2 Most are sacrococcygeal. One third occur in the skull base region, with most of these in the region of the spheno-occipital synchondrosis (Figs. 34.1–34.4). Sites of chordoma correlate with the frequency of notochordal rests found in the clivus, vertebral bodies, and submucosa of the nasopharynx and pharynx and epidural space. Chordomas may occur at any age, with the peak for skull base lesions between 20 and 40 years of age.2 There is a developmental variant of notochord remnants called ecchordosis physaliphora (EP) that is a rest of growing but nonmalignant cells. ecchordosis physaliphora The term most properly refers to a small, well-circumscribed, gelatinous mass that is intradural and adheres to the brain stem and may be pedicled to the clivus (Fig. 34.3). It is composed of notochordal remnants but should not progress to chordoma. EP is reported in about 2% of autopsies.3
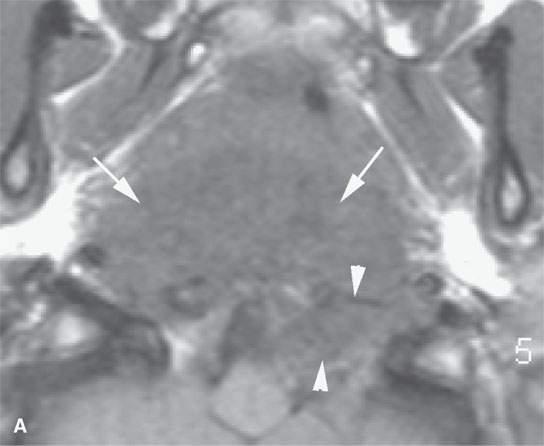
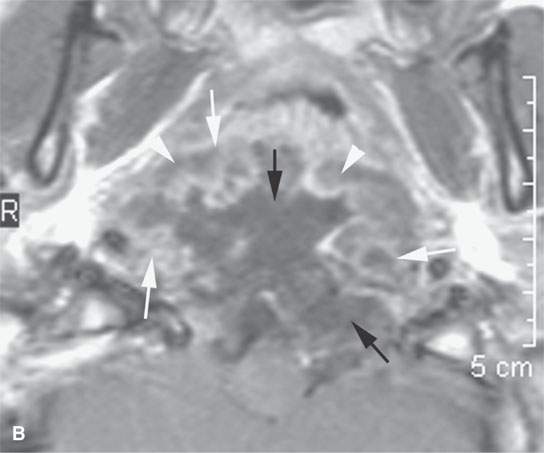
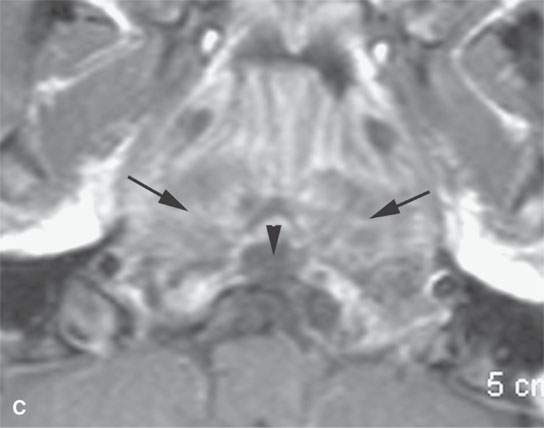
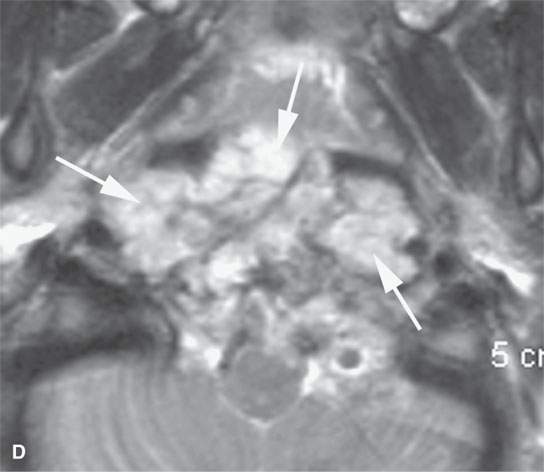
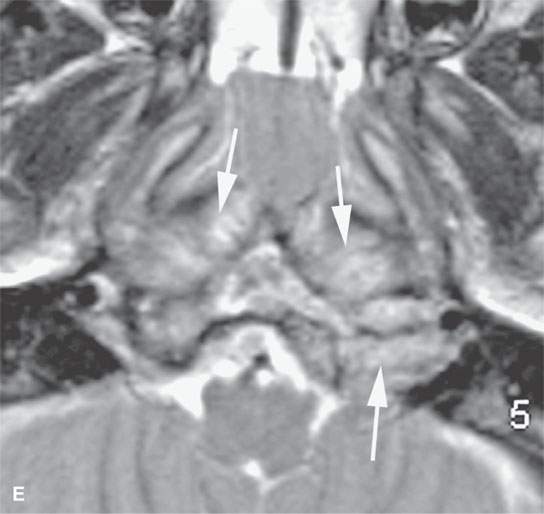
FIGURE 34.1. Magnetic resonance imaging study of a patient with a chordoma of the central skull base. Computed tomography is seen in Figure 34.2. A: Non–contrast-enhanced T1-weighted (T1W) image showing the extensive tumor in the prevertebral soft tissues (arrows) and a portion growing through the posterior skull base into the low medullary cisterns (arrowheads). B: Contrast-enhanced T1W image correlating approximately with that seen in (A) shows differential areas of enhancing (white arrows) and non-enhancing tumor (arrowheads). Centrally within the mass, there is a large somewhat confluent area that might represent gross necrosis (black arrows). C: Contrast-enhanced T1W image showing a more homogeneously solid component of the tumor with a variable degree of low-level enhancement (arrows) and a more central homogeneously fluid region in the central aspect of the clivus (arrowhead). D: T2-weighted (T2W) image to correlate with (B) with zones of fairly bright signal intensity that are consistent with the relatively watery nature of this lesion (arrows). E: T2W image to correlate with (C) shows portions of the tumor that are less bright on T2W images.
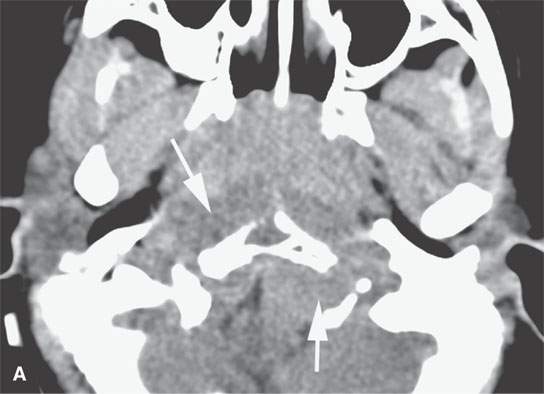
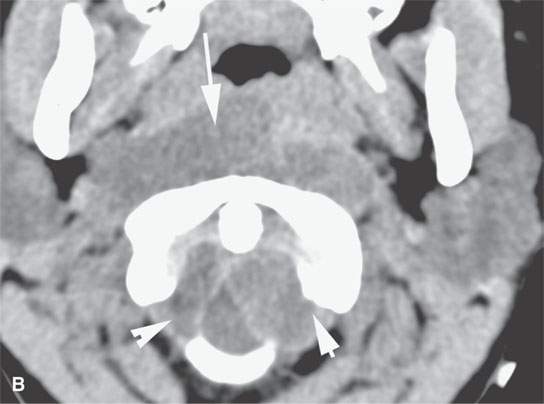
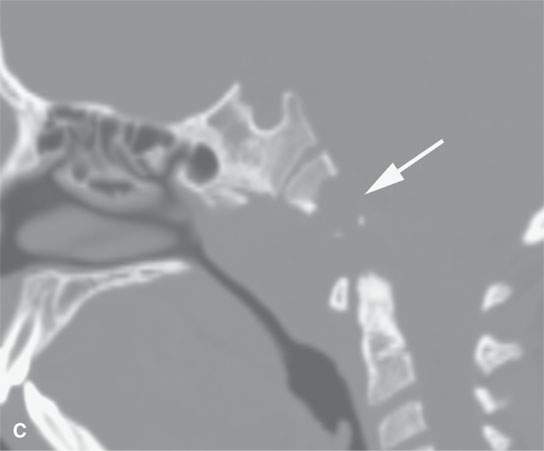
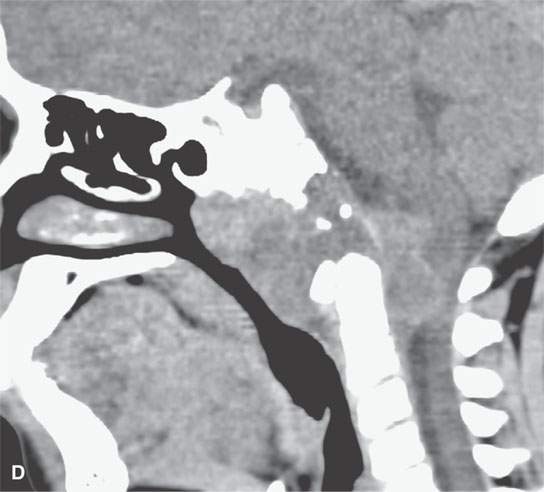
FIGURE 34.2. Non–contrast-enhanced computed tomography (CT) examination of the patient seen in Figure 34.1. A: The chordoma is slightly less dense than muscle or lymphoid tissue (arrows). B: Section somewhat lower than that seen in (A) showing the low density of the mass both in the prevertebral soft tissues (arrow) and within the upper spinal epidural space (arrowheads). C: Sagittal reformation of CT images showing the destructive lesion of the base of the occipital bone as it forms the lower clivus in this child (arrow). D: Soft tissue view to correlate with (C) showing variable density within the lesion.
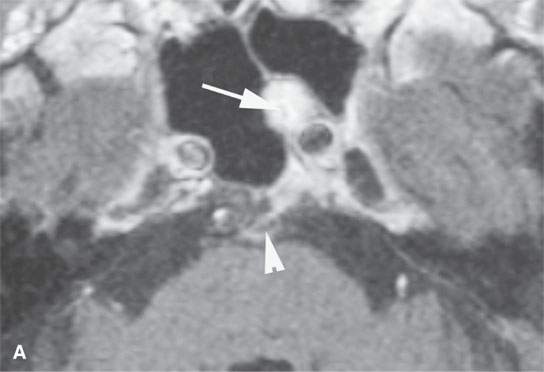
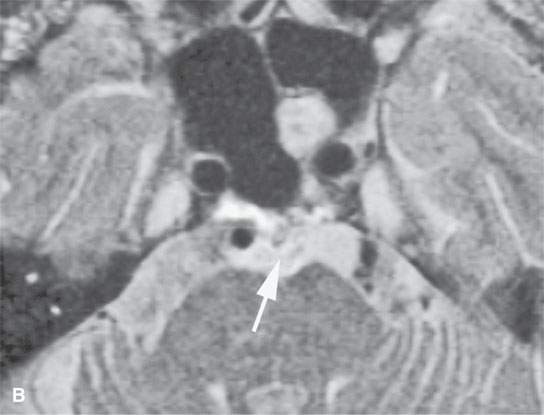
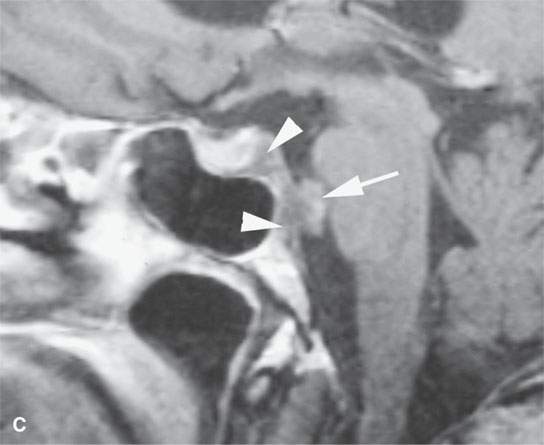
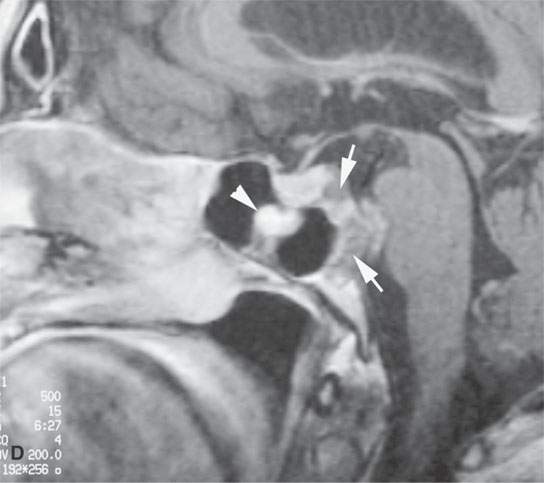
FIGURE 34.3. A patient presenting with a sixth cranial nerve palsy. This magnetic resonance imaging study showed this to be due to an early chordoma or possibly ecchordosis physaliphora (EP) involving the base of sphenoid bone and upper clivus. A: T1-weighted (T1W) image following contrast injection shows an enhancing component projecting into the sphenoid sinus (arrow) that made tissue sampling relatively simple in this case and a less enhancing component within the upper clivus (arrowhead). B: T2-weighted axial image correlating with that in (A) shows the nonenhancing component of the tumor to be the same signal intensity as cerebrospinal fluid (arrow). C: T1W sagittal image enhanced showing a minimally enhancing component of the lesion projecting into the posterior fossa and deforming the pons (arrow) and somewhat less enhancing components of the lesion within the upper clivus (arrowheads). D: Sagittal T1W contrast-enhanced image showing the clival portion of the tumor (arrows) to be somewhat less enhancing than the portion of the tumor that projected into the sphenoid sinus (arrowhead). (Note: This could be considered ecchordosis physaliphora, but that might be a hazardous assumption in a patient with a cranial nerve deficit directly related to the lesion. If EP is presumed, the lesion must be followed with imaging until stability is confirmed).
Stay updated, free articles. Join our Telegram channel

Full access? Get Clinical Tree


