(1)
Department of MRI, Medical Center at Siegerland Airport, Burbach, Germany
The hypothesis of this book is, to put in a nutshell, that low-field MRI systems, with a field strength of less than 0.4 T and with a permanent magnet, are full-scale whole-body imaging machines (Marti-Bonmati and Kormano 1997).
We have spent some effort on theory, and we have found some good reasons why we even may prefer low-field scanners in some imaging settings. But, as we say in Germany, an image says more than thousand words: let us now have a look on the results.
The images demonstrated in his chapter are produced on MRI systems of different manufacturers: Esaote, GE, Hitachi, and Siemens.
Esaote images are provided by Dr. Frieder Mauch, Stuttgart, and Esaote Biomedical Imaging Deutschland GmbH.
GE images have been sent by Dr. med. Willy Loretan and his colleague Dr. med. Michael Kolbe from “Medizinische Radiologie/Radiodiagnostik” in Brig/CH. They impressed me 14 years ago with their imaging on a 0.2 T GE Signa Profile.
Hitachi images have been scanned at the institute of Dr. Brigitte Redeker-Standke from “Jade–Weser Imaging,” Varel, Germany, who sent me excellent imaging examples of their 0.4 T Hitachi Aperto.
Fonar Inc., Melville/U.S.A. provided images of weight-bearing functional MRI. My images are retrieved from the Siemens reference site at Ev.-Jung-Stilling Hospital, Siegen/Germany, with a 0.35 T Siemens Magnetom C!
All images are retrieved from clinical routine imaging and represent standard, reproducible quality (Table 7.1).
Table 7.1
Low-field MRI systems. The present market situation
Esaote G-scan | GE Signa Profile 0.2 | Hitachi Aperto Lucent 0.4 | Siemens Magnetom C! | FONAR Upright | |
|---|---|---|---|---|---|
Field strength T | 0.24 | 0.2 | 0.4 | 0.35 | 0.6 |
Magnet type | Permanent | Permanent | Permanent | Permanent | Resistive |
Gradient amplitude mT/m | 20 | 15 | 25 | 24 | 17 |
Gradient slew rate T/m/s | 56 | 30 | 55 | 55 | 28 |
Channels | 4 | 4 | 1 | 4 | 1 |
Coil elements | 4 | 8 | 1 | 13 | Custom |
The main drawback in routine imaging is the prolonged scan time on low-field systems, which is increased by about 40 %, if a well-equipped low-field system is used. The pure scan time for four sequences was therefore between 10 and 20 min, compared to 7–15 min on a 1.5 T system. Since scan time is only about half of the regular room time of the patient and patient positioning is easier and faster in a low-field MRI, patient throughput is reduced about 20 % compared with a standard high-field scanner.
7.1 Cranial Imaging
Imaging of the neurocranium is one of the most frequent indications of MR imaging. To my experience, all imaging techniques can be provided by low-field scanners, except fMRI (BOLD imaging) and spectroscopy. BOLD sequences might be possible, but were not implemented on our system. These sequences, as well as cerebral MRI spectroscopy, take profit from higher field strength.
T1 imaging, including STIR technique, takes advantage of the shorter T1 time and better T1 contrast in low-field MRI. The results are throughout satisfactory (Figs. 7.1, 7.2 and 7.3).
Fig. 7.1
Coronal T1-weighted image. GE Signa Profile 0.2
Fig. 7.2
Coronal STIR Sequence with inverted contrast for better delineation of focal white matter lesions or cortical heterotopias. (Siemens Magnetom C!, 0.35T)
Fig. 7.3
T1-weighted 3D gradient echo sequence. Left: transversal (Siemens Magnetom C!, 0.35 T), Right: sagittal orientation (Hitachi Aperto 0.4 T)
T2-weighted and FLAIR imaging quality is comparable to high-field imaging, if imaging time is increased by about 40 % (Figs. 7.4, 7.5).

Fig. 7.4
T2-weighted spin echo sequence. Siemens Magnetom C!
Fig. 7.5
Coronal FLAIR sequence. Left: Postinflammatory scar (encephalomyelitis), GE Signa Profile 0.2. Right: Normal situation. Hitachi Aperto 0.4 T
For high-resolution imaging of the posterior fossa, a balanced gradient echo sequence was added (TrueFISP, Siemens, Erlangen, Germany) (Fig. 7.6).
Fig. 7.6
Left: High-resolution balanced 3D gradient echo sequence for imaging of the cerebellopontine angle (TrueFISP. Siemens Magnetom C!). Right: 3D MIP reconstruction of the vestibulocochlear system from the 3D gradient echo sequence
Diffusion-weighted sequences were performed using a HASTE sequence, or EPI DWI (Fig. 7.7). Even perfusion imaging is possible (Fig. 7.8).
Fig. 7.7
“One-stop shop” in MRI. T2- and T1-weighted spin echo. FLAIR and diffusion-weighted EPI sequence. Small area of acute ischemia in the right posterior capsule (Hitachi Aperto 0.4 T)
Fig. 7.8
Cerebral perfusion imaging. Hitachi Aperto 0.4 T. Delayed mean transit time and time to peak in the right occipital cortex
Cranial examinations are carried out using a solenoid (multichannel) head coil. This coil is regularly combined with another solenoid neck coil, providing coverage of the head, neck, and upper thoracic aperture.
7.2 Neck Imaging
Imaging of the cervical neck includes the usual scan sequences, known from higher field strength: T1- and T2-weighted spin echo, STIR, T2*-weighted fast gradient echo, T1-weighted gradient echo sequences plain, and with i.v. contrast agent. On the Magnetom C!, we mostly applied the solenoid head coil combined with a solenoid neck coil, using all four system channels, to maximize signal strength (Figs. 7.9, 7.10, 7.11, and 7.12).
Fig. 7.9
Imaging of the temporomandibular joint. T2*-weighted, solenoid head coil, 2D spoiled gradient echo sequence (FLASH, Siemens Magnetom C!, 0.35 T)
Fig. 7.10
Transversal STIR sequence of the neck (GE Signa Profile 0.2 T)
Fig. 7.11
Transversal T1-weighted contrast-enhanced spoiled gradient echo sequence (SPGR, GE Signa Profile 0.2 T)
Fig. 7.12
Lateral neck cyst. Magnetom C! 0,35 T. Coronal STIR sequence, transversal T1 gradient echo after i.v. contrast agent, and T2 spin echo sequence
7.3 Spine
Imaging of the vertebral spine is facilitated by multielement (saddle) coil arrays, as they are standard in closed-bore magnets with longitudinal field. In open magnets, the solenoid coils are wrapped around the body, resulting in a good coil sensitivity profile (Chap. 5), but reduced number of coil elements.
The detection of small myelon lesions can represent a problem. Spatial resolution depends on gradient amplitude and slew rate (>50 T/m/s). The improved T1 contrast can only attribute to lesion detection in STIR sequences. Care has to be taken for optimized T2 images, at the cost of longer scan time (Fig. 7.13).
Fig. 7.13
Sagittal T2-weighted spin echo sequence. Siemens Magnetom C!
Lee and coworkers compared a 0.25 T with a 1.5 or 3 T scanner for diagnosis of lumbar degenerative disease. They found excellent correlation between low- and high-field systems for detection of disk herniation, central canal, lateral recess, and exit foraminal stenosis. Agreement for root compression was good (r 0.71–0.76). Low-field imaging produced more motion artifacts; the authors explained this by longer scan times (Lee et al. 2015).
Assheuer and coworkers demonstrated that low-field MRI has no relevant quality deficits for diagnostics of the lumbar spine (Assheuer et al. 2014) (Figs. 7.14, 7.15, 7.16, 7.17, 7.18, 7.19 and 7.20).
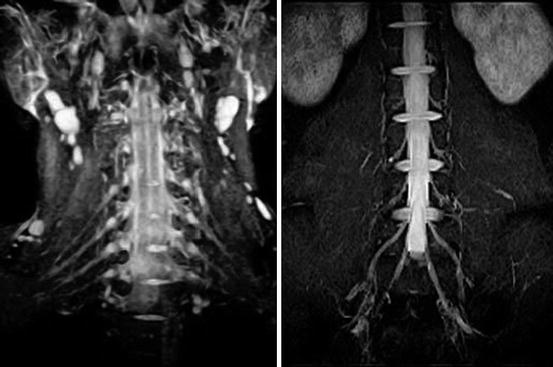
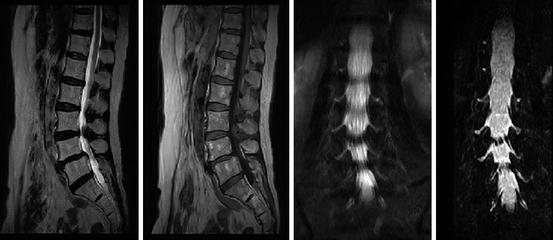
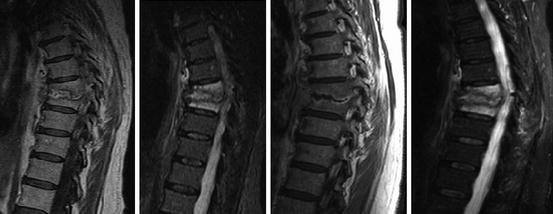
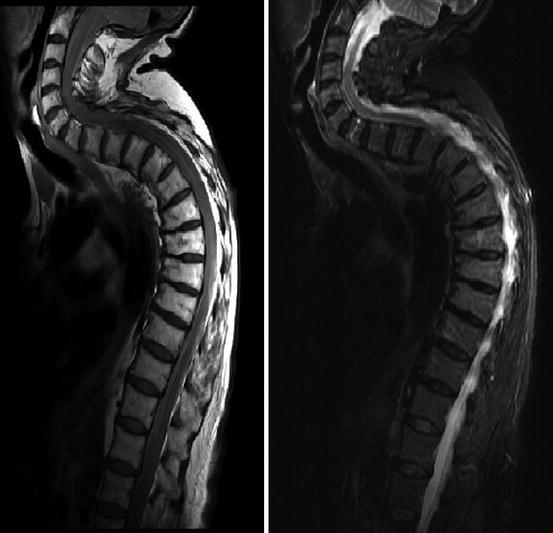
Fig. 7.14
Thoracic neurofibroma. Coronal T2- and T1-weighted SE sequence (Hitachi Aperto 0.4 T)
Fig. 7.15
Transversal gradient echo sequence. Matrix 512 × 512 (Hitachi APERTO Lucent 0.4 T)
Fig. 7.16
MR myelogram. Single-shot turbo spin echo sequence (Siemens Magnetom C!)
Fig. 7.17
Plexus neurography. STIR sequence. Left: Cervical spine. Right: Lumbar spine (Hitachi APERTO Lucent 0.4 T)
Fig. 7.18
Spinal stenosis segment L3/4, segmental instability L4/5 (Hitachi APERTO Lucent 0.4 T). T2- and T1-weighted spin echo sequence. MR myelography
Fig. 7.19
A case of spondylodiscitis. STIR and CE T1 images, one time performed on a 1.5 T system, the control examination 4 weeks later on a 0.35 T system (Siemens Magnetom Symphony and C!)
Fig. 7.20
Sagittal T1- and T2-weighted SE sequence in a patient with severe hyperkyphosis of the thoracic spine (Siemens Magnetom C!). Combination of different solenoid coils enables scanning the whole cervicothoracic spine
7.4 Musculoskeletal Imaging
For musculoskeletal imaging, MRI has become a standard procedure of great importance.
The excellent intrinsic tissue contrast in MR imaging facilitates detection of ligamentous, fibrous and hyaline cartilage or bone marrow lesions, marrow edema, and joint effusion.
CT and MRI are complementary methods, particularly in musculoskeletal imaging. Tavernier and Cotten have discussed the impact of low field strength on musculoskeletal imaging. The literature is not equivocal. Some studies (Friedman et al. 1995) reported unsatisfactory results; others found acceptable or even advantageous results in low-field applications (Kersting-Sommerhoff et al. 1996; Cotten et al. 2000; Kreitner et al. 2003).
7.4.1 Trauma
The most sensitive method for detection of fracture is MRI. Particularly in critical areas, like scaphoid bone, low-field MRI can provide mandatory information for adequate clinical therapy (Raby 2001).
Herber and coauthors from the university of Mainz/Germany investigated low-field MRI for children with unclear chronic ankle pain and unconspicuous conventional X-ray imaging. They found ligamentous injuries in 64 % of their patients (Herber et al. 2000) (Figs. 7.21 and 7.22).
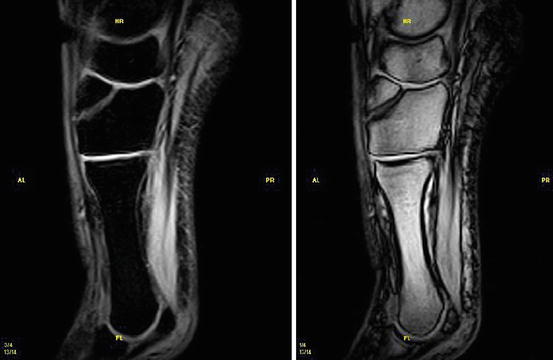
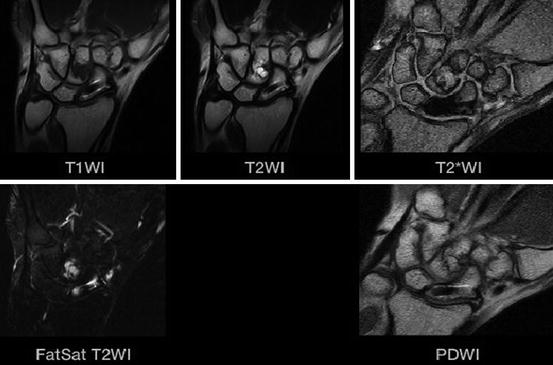
Fig. 7.21
Fracture of the Os cuneiform med. STIR (left) and T2*-(right) weighted image (Courtesy Esaote Inc.)
Fig. 7.22
MR imaging after surgical repair of a scaphoid fracture using a Herbert screw (titanium). Nearly no metal artifacts (Hitachi Aperto 0.4 T)
7.4.2 Inflammatory Disease
The value of low-field MRI in the work-up of patients with rheumatoid arthritis has been reported (Pedersen et al. 2014). For the diagnosis of sacroiliitis and ankylosing spondylitis, particularly for assessment of the inflammatory activity, MRI is far more sensitive than X-ray imaging (Yu et al. 1998).
The recent concept of enthesitis depends on MR imaging for detection of inflammatory contrast enhancement in the fibro-osseous junction (Klang et al. 2014).
7.4.3 Cartilage
In recent years, cartilage lesions have attracted particular attention. Proton-density sequences with fat saturation and T1 sequences are the base of routine imaging on high-field systems.
The clue for cartilage diagnosis is spatial and contrast resolution (Bredella et al. 2001). For grade 2 lesions, a sensitivity and specificity of 25–75 % have been found on a 0.2 T system. For grade 3 lesions, the values are between 60 and 73 %, respectively (Riel et al. 1997; Ahn et al. 1998). Sensitivity and specificity were lower than in high-field MRI.
Harman compared non-contrast imaging with MR arthrography of the knee. For grade 3 cartilage lesions, he found a sensitivity for T2 sequences and MR arthrography of 0.71 and 0.85, respectively. For grade 4 lesions, sensitivity was 0.87 and 1.0 (Harman et al. 2003).
The improved T1 contrast in low-field imaging can be used for high-resolution imaging of the hyaline cartilage. Roessler and coworkers performed cartilage imaging using a single-sided, commercially available low-field MRI scanner. They achieved a vertical resolution of 20 μm (Rössler et al. 2014) (see Chap. 9) (Fig. 7.23).
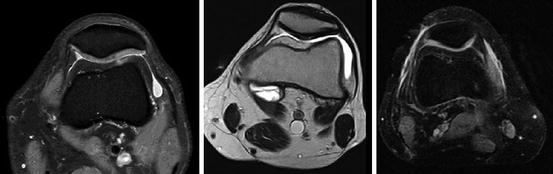
Fig. 7.23
Retropatellar cartilage. Left: fat-saturated proton-density image 1.5 T, middle: T2-weighted image at 0.35 T, showing a cartilage fissure. Right: fat-saturated proton-density image 0.35 T
7.4.4 Joint Imaging
A number of publications have addressed the performance of low-field versus high-field MRI for knee diagnostic (Cotten et al. 2000). Most studies showed comparable results. Parizel compared low- and high-field MRI for diagnosis of knee disorders. He found that a low-field system represents a cost-effective alternative to high-field imaging (Parizel et al. 1995).
Kreitner and coworkers performed a prospective, arthroscopically controlled study on knee MRI. He emphasized the longer examination times (Siemens Magnetom Open 0.2 T) and the dependency on the skills of the diagnostic radiologist (Kreitner et al. 1999).
Krampla and coworkers compared three field strengths (1, 1.5, and 3 T) for diagnosis of knee disorders. They found no significant differences in interobserver variance, sensitivity, and specificity. Differences in false results depended on observer experience, not on field strength (Krampla et al. 2009) (Figs. 7.24, 7.25, 7.26, and 7.27).
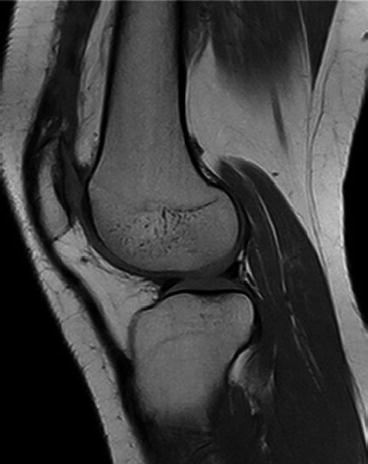
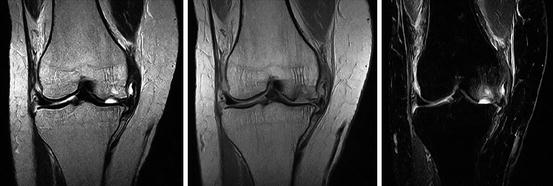
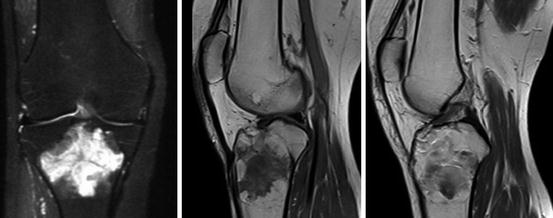
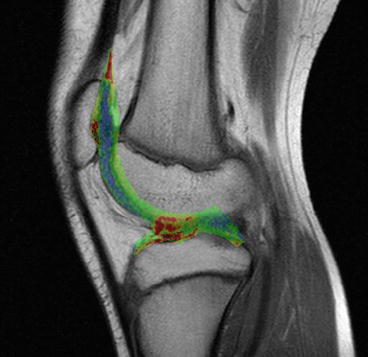
Fig. 7.24
High-resolution T1-weighted spin echo sequence. Matrix 1024 × 768 (interpolated). Scan time 2:40 min. High contrast-to-noise ratio for hyaline cartilage, menisci, and bone marrow (Siemens Magnetom C!, 0.35T)
Fig. 7.25
Patient with acute osteochondral fracture of the medial condyle. MR imaging (1024 × 1024 matrix size, Hitachi Aperto 0.4 T). Left: T2-weighted spin echo sequence. Middle: proton-density image. Right: STIR-sequence
Fig. 7.26
Giant cell tumor of the knee (Siemens Magnetom C!, 0.35 T). Left: STIR image. Middle: T1-weighted plain image. Right: Contrast enhanced T1-image
Fig. 7.27
T2 relaxometry. The calculated T2 values are superimposed to the T2 image (Siemens Magnetom C!, 0.35 T)
Shoulder imaging in a closed-bore system requires off-center positioning of the joint, resulting in reduced image quality. Wide-bore MRI systems improve this situation. In open low-field MRI, the shoulder and also the elbow joint can be positioned in the magnet’s center, resulting in a further increase of image quality.
Magee investigated high- versus low-field MRI of the shoulder and found the higher spatial resolution to be an important feature of high-field MRI (Magee et al. 2003).
Loew and coworkers compared MR arthrography of the shoulder between 0.2 T and 1.5 T. They found comparable imaging results, which are partly due to the fact that MR arthrography uses T1-weighted sequences with a GD contrast agent, and therefore takes profit from increased T1 contrast (Loew et al. 2000).
Rotator cuff lesions were investigated by Shellock et al. on a 0.2 T system. In 47 patients, they achieved a sensitivity and specificity of 0.89 and 1.0, respectively (Shellock et al. 2001). Kreitner et al. performed a study of 82 patients with MR arthrography on a low-field MRI. Sensitivity was 0.97 and specificity 1.00 (Kreitner et al. 2003).
Shoulder instability can be caused by rotator cuff, capsular or bony defects, and by labroligamentous lesions. Studies on unenhanced low-field imaging of the shoulder found a sensitivity and specificity for labrum pathology of 0.67 and 0.91, respectively (Merl et al. 1999). Superior labrum anteroposterior lesions (SLAP) have been reported to be more easily missed on low-field MRI (sensitivity and specificity of 0.67 and 0.8). However, 75 % of the arthroscopically found lesions, missed on MRI, were type 1 lesions with only fraying of the labrum (Tung et al. 2000). To the knowledge of the author, until now no study on low-field MR arthrography of the glenoid labrum exists (Figs. 7.28 and 7.29). Elbow imaging represents a problem in closed bore magnets. Open low field systems provide far easier access and positioning (Fig. 7.30). The same is true for the wrist (Figs. 7.31 and 7.32), and to some extent, mainly in trauma patients, for the ankle (Fig. 7.33).
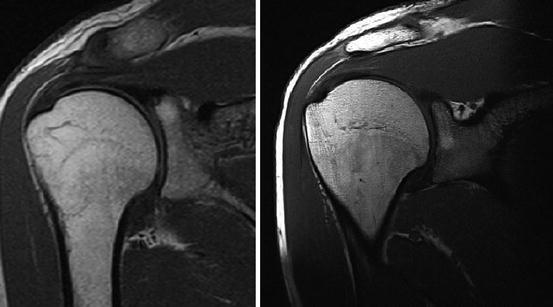
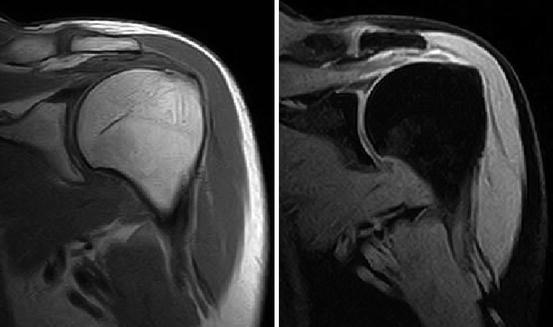
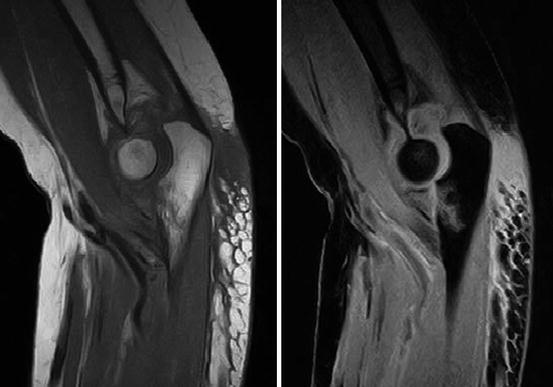
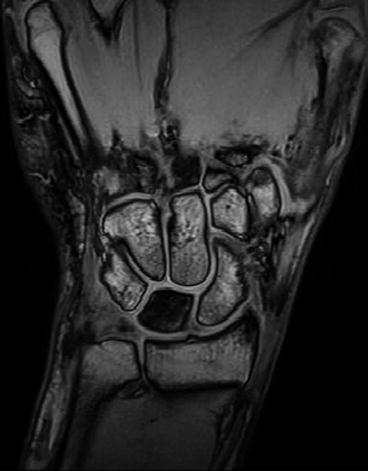
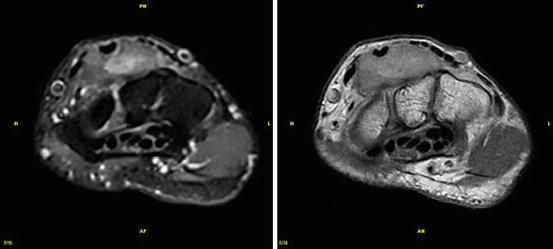
Fig. 7.28
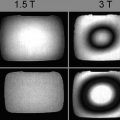
Shoulder imaging. T1-weighted SE sequence. Left: Siemens Magnetom C!, 0.35 T, Right: Siemens Magnetom Symphony 1.5 T. Spatial resolution is inferior on low-field imaging, but T1 contrast of cartilage is better
Fig. 7.29
Shoulder imaging. Left: T1-weighted spin echo sequence. Right: fat-suppressed Dixon sequence (Hitachi Aperto 0.4 T)
Fig. 7.30
Elbow imaging. Coronoid process fracture type 3 (Regan–Morrey classification) involving > 50 % of the process. Left: T1 spin echo sequence. Right: fat-suppressed sequence (STIR) (Hitachi Aperto 0.4 T)
Fig. 7.31
Kienböck’s disease. Gradient echo scan (Courtesy Esaote inc.)
Fig. 7.32


Giant cell tumor of the tendon sheath. Left: STIR technique. Right: contrast-enhanced T1 spin echo (Courtesy: Esaote Inc.)
Related posts:


Stay updated, free articles. Join our Telegram channel
Full access? Get Clinical Tree
