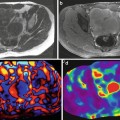
Fig. 4.1
MRE of liver can be performed in most clinical patients and of variable size. Anatomical MR image, wave image, and stiffness maps of three subjects (each row) with different body mass indices and normal liver. Note excellent propagation of shear waves in the liver in all three subjects and similar stiffness values of the livers
Measurement of Liver Stiffness
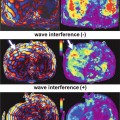
Stiffness of the liver can be quantified by drawing regions of interest (ROI) on the stiffness maps generated automatically on the scanner. Stiffness maps show spatial distribution of tissue stiffness across the cross-section. When drawing ROI, care must be taken to avoid large vessels, liver edge, fissures, gall bladder fossa, and regions of wave interference to obtain reliable stiffness values. Larger geographical ROI drawn over multiple slices is encouraged to ensure more volume of liver being sampled. The mean stiffness is reported in kilopascals (kPa). Liver stiffness with MRE is reproducible with high inter-observer agreement (>95 %) [29, 31–33]. Recently a study showed that the inter-observer agreement for MRE readers for liver stiffness was significantly better than that between pathologists staging liver fibrosis (0.99 vs. 0.91, p < 0.001) [34].
Normal Liver
Normal liver parenchyma (Fig. 4.2) is composed of hepatocytes, sinusoidal cells (endothelial cells, Kupffer cells, and other cells in space of Disse), sinusoidal spaces, and extracellular space of Disse. Hepatocytes account for nearly 65 % of the cells in the liver [35, 36]. The liver parenchyma is enclosed in a thin connective tissue layer (Glisson’s capsule). The extracellular matrix (ECM) provides the architectural support and necessary scaffolding and is predominantly present in the space of Disse as basement membrane and around the portal areas, large vessels, and the capsule as interstitial matrix (connective tissue stroma). The ECM is composed mainly of collagen, glycoproteins, and proteoglycans [37]. The collagen content (mainly collagen Type I and III) in normal liver is very little, usually <1 % and is approximately 2–8 mg/g wet weight whereas in fibrotic liver this increases to several fold to the order of 30 mg/g wet weight or more [38, 39]. The blood in the sinusoids and vessels accounts for nearly 25–30 % of liver volume [40]. Liver has a dual blood supply: 70–80 % from the portal vein and 20–30 % from the hepatic artery. The sinusoids are supplied by portal venules and drain into central venules and hepatic veins into the inferior vena cava. The pressures in normal portal vein, portal venules, central venules, hepatic veins, and inferior vena cava are 5–10, 4–5, 1–3, <5, and −5 to 5 mmHg respectively [41–43]. The arterial blood enters the sinusoids at 9–18 mmHg pressure [44]. Blood flow through the liver is high volume (1–1.5 L/min) across a low resistance system due to large cross-sectional area of the sinusoids resulting in a low pressure perfusion system [45–48]. Due to this, liver is extremely compliant. If the portal blood flow is doubled, the portal pressure in normal liver only increases by approximately 2 mmHg by passive decrease in resistance [47, 48]. Normal liver therefore is a soft organ as it has very little fibrous tissue and a low pressure blood circulation system.
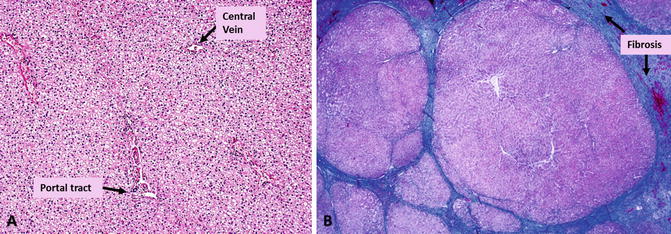
Fig. 4.2
Histology of normal liver (a) and cirrhotic liver (b) with Masson-Trichrome stain to highlight fibrosis. The fibrotic tissue (collagen) is stained blue. Normal liver has minimal fibrotic tissue around the portal tracts. Cirrhosis is characterized by multiple nodules of varying size encapsulated with fibrotic bands of variable size. (Images provided by Professor Aileen Wee, Pathology, National University of Singapore)
Normal Liver Stiffness
Normal liver is soft and has a mean stiffness value of 2.05–2.44 kPa and ranges from 1.54 to 2.87 kPa [20, 49–53]. The range of normal liver stiffness reported by different research groups may be influenced by the age, sex, body mass index (BMI), diet, and ethnicity of the subject populations studied, however no definite correlations are established. A few early studies have demonstrated that there is no significant correlation between liver stiffness and age, sex and BMI [49, 50], however, need to be verified in a larger study population comprising of healthy normal subjects. Normal liver stiffness does not show any significant diurnal variation or affected by a meal challenge [29, 30, 54] as it can easily accommodate the increased post prandial portal flow as explained in previous section. Fatty change or simple steatosis without any inflammation also does not significantly influence measured stiffness and is similar to normal liver [20, 49, 50].
CLD and Liver Fibrosis
CLD can result from many etiologies including viral hepatitis, excessive alcohol consumption, non-alcoholic steatohepatitis, drug toxicity, and chronic passive congestion due to right heart failure. Chronic injury to the liver parenchyma leads to necrosis and hepatocyte loss and heals by fibrosis-laying of ECM. Liver fibrosis results in both quantitative and qualitative changes in the collagenous and non-collagenous components of the ECM [55]. The source of ECM changes in fibrotic liver can be hepatic stellate cells (HSC), fibroblasts and myofibroblasts of the portal tract, smooth muscle cells localized in vessel walls, and myofibroblasts localized around the centrolobular vein. Activation of these sources depends on etiology and initial site of liver injury. These changes involve portal tracts, central veins and sinusoids as well as hepatocytes. The perisinusoidal basement like matrix changes to interstitial type matrix containing fibril forming collagens. The collagen content of fibrotic liver is significantly higher than normal liver (three–tenfold or more). All of these contribute to mechanical and physical changes in the liver [55].
Different etiology produce different spatial patterns of fibrosis and very variable even among patients with same etiology [55]. For example, chronic viral hepatitis is characterized by interface hepatitis and development of portal to portal septa, portal-central septa, and septa ending blind in parenchyma; biliary cirrhosis tends to cause portal-portal bridging with preservation of central vein until later stages; non-alcoholic steatohepatitis (NASH), alcohol, and other metabolic diseases are characterized by perisinusoidal deposition of fibrillar matrix and around the hepatocytes known as chicken wire pattern [55, 56]. Typically CLDs result in inhomogeneous distribution of changes of inflammation and fibrosis.
Liver fibrosis is a dynamic process of accumulation of excessive fibrous tissue associated with degradation and remodeling in a balanced process [57]. When accumulation of fibrosis exceeds degradation, cirrhosis results sooner or later, characterized by formation of regenerative nodules encapsulated by fibrous tissue septa (Fig. 4.2) and associated changes in vascular architecture [56]. The progression of liver fibrosis in CLD is usually slow over several years and can increase rapidly in advanced fibrosis [58] and when immunosuppression coexists as in patients with liver transplants [59] or those with human immunodeficiency virus (HIV) co-infection [60].
Evaluation of progression of fibrosis has clinical implications for risk stratification, prognosis, and evaluation of therapy. The current gold standard of liver biopsy provides qualitative estimation of extent of fibrosis using ordinal scoring systems. Several fibrosis staging systems exist including Batts and Ludwig [61], Ishak [62] and METAVIR [63] for chronic hepatitis and Brunt Schema [64] for NASH. METAVIR system (Fig. 4.3) is widely used and can be briefly summarized as follows: F0-no fibrosis, F1-periportal fibrosis, F2-periportal fibrosis with rare septa, F3-numerous septa with cirrhosis, and F4-cirrhosis. Clinically significant fibrosis is defined as ≥F2 stage as it carries the highest risk of progression and cirrhosis in chronic hepatitis [65].
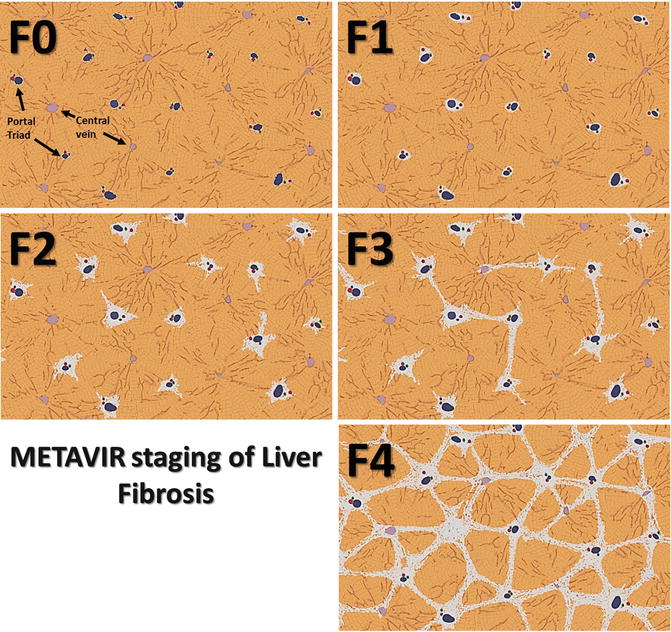
Fig. 4.3
Diagram illustrating METAVIR staging of liver fibrosis F0 through F4
Histologically, the increasing severity of fibrosis or stages of fibrosis is based on identifying the location and amount of fibrosis, and assessment of qualitative features such as formation of septa, bridges, or nodules encapsulated by fibrous tissue. The staging systems provide information on relative severity of the process but are not accurate quantifiers of fibrosis content. Histological evaluation is however limited by sampling error and inter-observer variability.
Liver fibrosis content can also be assessed with quantification of liver fibrosis (collagen content) with histo-morphometric methods on liver biopsy samples using suitable stains like Sirius Red [66]. Fibrotic tissue highlighted by these techniques is expressed as percentage of total area of histological sample and is known as collagen proportionate area (CPA). Morphometric assessment can also be performed with digital methods using second harmonic generation (SHG) microscopy. With morphometric analysis, the amount of fibrous tissue ranges from 1 to 4 % in normal livers to 15 to 35 % in cirrhosis [66]. However, these methods are limited by sampling error inherent to liver biopsy.
Stiffness of Fibrotic Liver
Fibrotic livers are stiffer than a normal liver due to increased ECM. Preliminary study has shown that MRE derived stiffness of the liver correlates significantly (r = 0.78, p < 0.001) with fibrosis amount in liver samples [67] (Fig. 4.4). The degree of fibrosis (fibrosis burden) is variable in CLD from different etiology [55, 68–71]. For example chronic hepatitis C typically causes micronodular cirrhosis with smaller nodules and thicker septa, i.e., more fibrosis [71] as compared to chronic hepatitis B which is associated with macronodular cirrhosis with less fibrosis at the same stage of fibrosis [68]. Liver stiffness which correlates with amount of fibrosis may therefore be different among patients with the same histological fibrosis stage from the same etiology and also different from patients with the same fibrosis stage of different etiology.
Fig. 4.4
Graph illustrating correlation between liver stiffness with MRE and fibrotic content with morphometric analysis (Fibro-C-Index) in liver biopsy of 32 patients with chronic hepatitis B. (Reproduced with permission from Venkatesh et al. [68])
Other conditions that may be associated with an increase in liver stiffness are acute biliary obstruction, acute inflammation of the liver [72], and passive congestion resulting from cardiac failure or other causes of raised central venous pressure [73]. MRE for detection or staging of liver fibrosis should be avoided when these conditions are known to be present as they may result in elevated stiffness measurements. Laboratory tests for liver enzyme levels and echocardiography may be useful in ruling out these conditions. Studies with TE have shown correlation of serum alanine aminotransferase (ALT) levels, a marker of liver inflammation with liver stiffness, however no such correlation has been shown with MRE [24].
Detection of Liver Fibrosis with MRE
MRE is accurate in distinguishing fibrotic livers from normal liver [20, 22, 23, 51, 74]. Early fibrosis can be detected even when anatomical features suggestive of fibrosis are absent (Fig 4.5) [17, 18]. MRE can differentiate normal liver from fibrotic livers with 89–99 % accuracy, 80–98 % sensitivity, and 90–100 % specificity [20, 21, 23, 24, 51, 75]. The cut-off stiffness values for detection of fibrosis range from 2.4 to 2.93 kPa in different studies [20, 21, 23, 24, 51, 75]. The different cut-off value is probably due to different populations studied and inclusion of multiple etiologies in the earlier studies. The degree, pattern, and distribution of fibrosis are different in CLD resulting from different etiologies as noted above. MRE provides a unique opportunity to observe stiffness distribution in the entire cross-section of the liver. Stiffness maps can show heterogeneity of liver stiffness that may reflect variations in the amount of fibrosis. Spatial distribution of stiffness in different CLDs may be observed (Fig. 4.6) and this information may be useful for diagnosis as well as providing guidance for liver biopsy [76]. The influence of regional variation of fibrosis deposition on MRE measured stiffness is not known and needs to be evaluated in future studies. Recently MRE studies on single etiologies like viral hepatitis [24, 25], NAFLD [75, 77], Gaucher’s [77], and alcoholic liver disease [78] are published and the cut-off values may be useful as references for these specific etiologies.
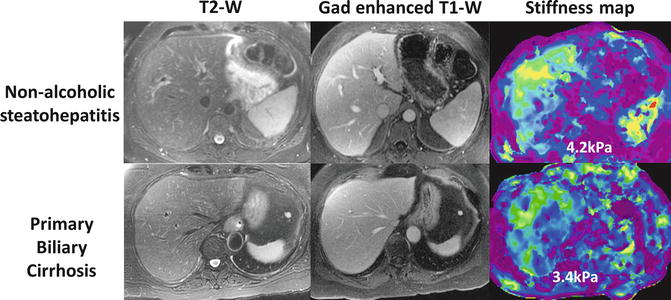
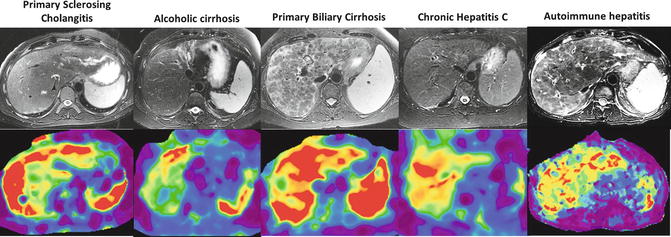
Fig. 4.5
MRE can detect increased stiffness due to fibrosis even when morphological appearance of liver is normal. Two examples of morphologically normal appearing liver but there was increased stiffness consistent with fibrosis and liver biopsy confirmed presence of significant fibrosis in both cases
Fig. 4.6
Spatial distribution of stiffness in cirrhosis from different etiologies. Note the peripheral distribution of increased stiffness in primary sclerosing cholangitis and around the nodules in the case of autoimmune hepatitis
Staging of Liver Fibrosis with MRE
Accurate assessment of degree of fibrosis is important for therapeutic decisions, determining prognosis, and to follow up disease progression. The stiffness of the liver assessed with MRE increases with fibrosis stage (Fig. 4.7). Liver stiffness shows excellent linear correlation with histologic fibrosis stages (spearman correlation coefficient r = 0.8–0.97) [20, 23–25, 79]. MRE also correlates well with the amount of fibrosis assessed with morphometric analysis (Fig. 4.4) [67]. The trend of increased stiffness with increased stages of fibrosis has been demonstrated in the most common CLDs (Figs. 4.8, 4.9, and 4.10) by several researchers around the world.
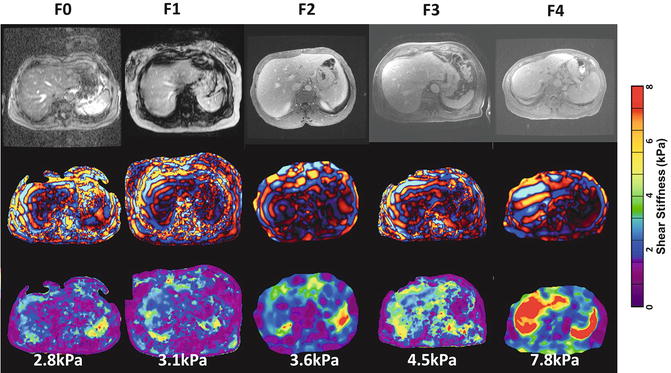
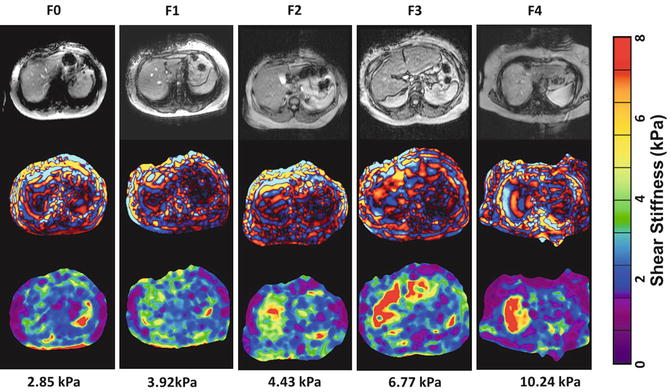
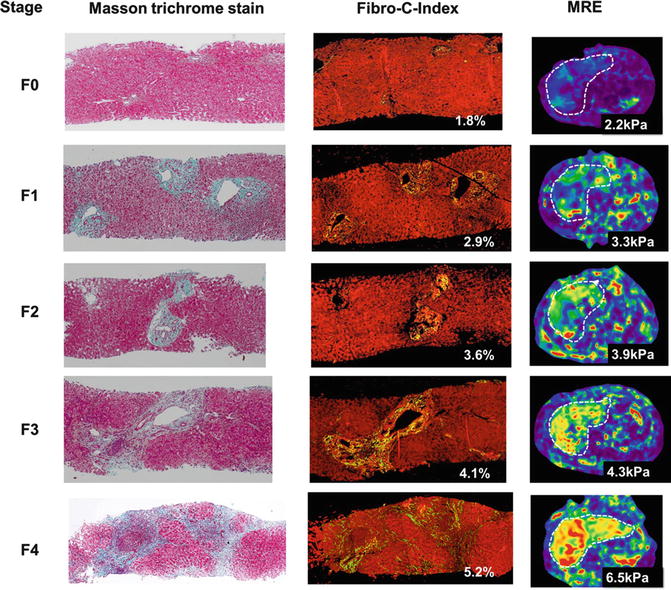
Fig. 4.7
Mean liver stiffness increases with increased fibrosis stage. Shown is a summary of the mean shear stiffness measurements of the liver for the 35 normal volunteers and the 48 patients divided into the five different fibrosis stages, which are indicated as F0, F1 … F4. Liver stiffness is significantly higher in patients than in the control group. The standard errors for each group are also illustrated in error bar for each group. An exponential function fit well to the liver stiffness data with an R 2 value of 0.94. (Reproduced with permission from Yin et al. [21]: http://www.elsevier.com)
Fig. 4.8
Examples of histology confirmed cases of chronic hepatitis C with fibrosis stages F0–4. The color bar on the right is shear stiffness scale from 0 to 8 kPa
Fig. 4.9
Examples of increasing stiffness with increasing stage of fibrosis (F0-F4) with biopsy proven cases of non-alcoholic fatty liver disease (NAFLD). The color bar on the right is shear stiffness scale from 0 to 8 kilopascals (kPa)
Fig. 4.10
Correlation of liver stiffness with increasing stages of fibrosis and morphometric assessment of fibrosis content in cases of chronic Hepatitis B. The first column is the Masson-Trichrome stained images of biopsy samples to highlight collagen. The second column shows results from Fibro-C-index, a morphometric method to estimate collagen content in biopsy samples and the third column shows stiffness maps with MRE in the same patient. (Reproduced with permission from Venkatesh et al. [68])
MRE can differentiate individual stages of fibrosis with excellent accuracy. For clinical management purposes, it is useful to stage fibrosis into groups: mild fibrosis (≥F1), clinically significant fibrosis (≥F2), advanced fibrosis (≥F3), and cirrhosis (F4). Good to excellent sensitivity, specificity, and accuracy of MRE in differentiating various stages of fibrosis have been shown in several studies (see Table 4.1). The cut-offs for significant fibrosis and advanced fibrosis are variable in different studies and probably related to the variability in the amount of fibrosis that occurs in different etiologies [24, 25, 78].
Stage | ≥F1 | ≥F2 | ≥F3 | ≥F4 |
|---|---|---|---|---|
Sensitivity | 72–98 | 86–100 | 78–100 | 89–100 |
Specificity | 81–100 | 85–100 | 87–100 | 86–100 |
Accuracy | 90–99 | 92–99 | 92.3–99 | 95–100 |
Positive predictive value | 97–100 | 93–100 | 92–100 | 86–100 |
Negative predictive value | 64–86 | 93–100 | 95–100 | 98–100 |
Liver stiffness may be affected by parenchymal inflammation which often accompanies chronic viral hepatitis although the effect may not be significant. Studies on chronic viral hepatitis have shown that inflammation does not affect correlation of stiffness with fibrosis stage [67, 79]. The confounding effect of inflammation will probably be most apparent in differentiating earlier stages of fibrosis from normal livers. More studies are required to establish the relationship between inflammation and liver stiffness. Similarly there is no correlation between fatty change and liver stiffness measured in livers (Fig. 4.11).
Fig. 4.11
Liver fat content does not influence stiffness with MRE. There is no correlation observed between fat/water (F/W) ratio and the liver stiffness measured in a group of 35 normal healthy volunteers and 48 patients (R 2 < 0.05) (Reproduced with permission from Yin et al. [21]: http://www.elsevier.com)
Clinically significant fibrosis (≥F2) can be differentiated from mild fibrosis (F0–F1) with an excellent accuracy of >92 % and positive predictive value of >93 %. Similarly cirrhosis can be diagnosed with accuracy of >95 % and negative predictive value of >98 %. MRE can therefore accurately rule in significant fibrosis and rule out cirrhosis which is very useful for clinical decision making. MRE has lower accuracy for differentiation of mild fibrosis from normal and inflammation only (F0). This may result in misclassification of mild fibrosis as normal liver and vice versa, however, this should occur in a very small proportion of patients and usually only by one stage [23, 24] but this performance is better than TE [80]. The misclassification may be related to biopsy sampling and heterogeneity of liver fibrosis. Laboratory tests and clinical findings are useful for confirmation in such cases or a repeat MRE study after short follow up may be helpful. Rarely a liver biopsy may be required to resolve discordant findings.
Proposed guidelines for interpretation of liver stiffness values are summarized in Table 4.2. The guidelines are based on our experience of more than 3,500 patients evaluated in clinical practice where liver biopsies were performed in a random sample of patients. The fibrosis stages are categorized as stages 1–2, 2–3, 3–4 as histologic staging is qualitative (categorical), whereas liver stiffness is a quantitative parameter on a continuous scale. Correlating the two scores on one-on-one basis is not statistically feasible but the grouping of stages into categories such as F1–2, F2–3 and F3–4, and F4 is done to facilitate clinical decision making.
Table 4.2
Proposed guidelines for interpretation of liver stiffness with MRE performed at 60 Hz frequency
<2.5 kPa | Normal |
|---|---|
2.5–2.9 | Normal or inflammation |
2.9–3.5 | Stage 1–2 fibrosis |
3.5–4 | Stage 2–3 fibrosis |
4–5 | Stage 3–4 fibrosis |
>5 | Stage 4 fibrosis or cirrhosis |
Cirrhosis was previously considered a terminal stage of CLD, but is now further classified into compensated and decompensated cirrhosis. Decompensated cirrhosis is characterized by the presence of variceal bleeding, ascites, or hepatic encephalopathy and carries several fold increase risk of mortality than compensated cirrhosis. Decompensation may be related to overall fibrosis burden. Increased liver stiffness is related to increased risk of decompensated cirrhosis, development of HCC, and mortality [81]. In a recent study, liver stiffness measured with MRE was independently associated with decompensation. A stiffness value of ≥5.8 kPa was associated with higher risk of decompensation [82].
MRE in Non-alcoholic Fatty Liver Disease
Non-alcoholic fatty liver disease (NAFLD) is the most common cause of liver disorder in Western countries [83]. The spectrum of NAFLD consists of NAFL or simple steatosis (SS), NASH, and NASH with fibrosis. NASH and NASH related fibrosis is associated with significantly higher liver related mortality (~15 %) as compared to those with SS alone (<2.5 %) [84–86]. It is important to distinguish these two conditions for clinical management. Simple steatosis progresses to NASH in 10–20 % of cases, 10–15 % of NASH progresses to cirrhosis, and nearly 25–30 % of advanced fibrosis progresses to cirrhosis [86, 87]. Conventional imaging modalities are not able to reliably differentiate the two entities. MRE is useful (Fig. 4.12) as SS does not affect liver stiffness [20, 24, 88] whereas both NASH and fibrosis demonstrate an increase in liver stiffness [75, 89].
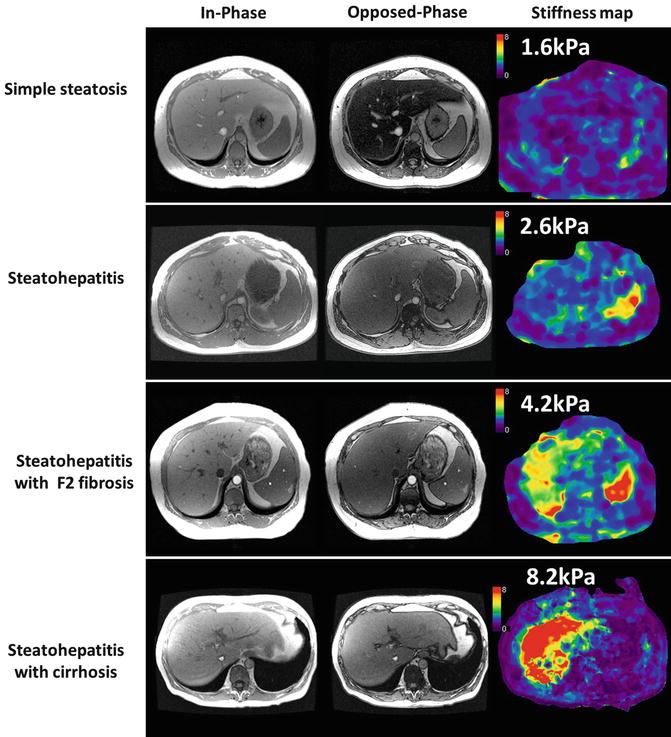
Fig. 4.12
MRE in NAFLD. Case examples of histology confirmed simple steatosis (top row), steatohepatitis only (second row), steatohepatitis with fibrosis (third row), and steatohepatitis with cirrhosis (bottom row). The in- and opposed phase gradient echo images showing signal loss characteristic of fatty livers most prominent in simple steatosis and steatohepatitis cases. Note steatohepatitis results in a mild increase in liver stiffness whereas fibrosis and cirrhosis are associated with significant increase in liver stiffness
In a preliminary study with 58 NAFLD patients, Chen et al. [75] demonstrated that SS can be differentiated from NASH ± fibrosis, with 94 % sensitivity, 73 % specificity, and an accuracy of 0.93 using a cut-off value of 2.74 kPa. The mean hepatic stiffness of patients with SS was significantly less than those with steatohepatitis (2.51 vs. 3.24 kPa, p = 0.028). The mean liver stiffness of patients with steatohepatitis but no fibrosis was significantly less than that for patients with hepatic fibrosis (4.16 kPa, p = .030).
In an another study, Kim et al. [89] showed that MRE with a cut-off value of 4.15 kPa is useful in detecting advanced fibrosis (F3–F4) in NAFLD with 85 % sensitivity, 93 % specificity, and an accuracy of 0.954. MRE is therefore a promising technique for differentiating SS from NASH as well as stratifying NASH patients with advanced fibrosis. MRE will probably have a significant role in NAFLD as obesity-related CLD is a major health burden in USA. A liver MRI study including fat quantification techniques and MRE can serve as a comprehensive one-stop technique evaluation of NAFLD.
Clinical Follow Up with MRE
Prognosis and management of CLD depends on the amount of liver fibrosis and its progression [58]. Clinical trials of chronic viral hepatitis patients have demonstrated that hepatic collagen content on average doubles every 2 years and therefore patients with longer duration of disease are likely to have more fibrosis [58, 69, 90, 91]. The morbidity and mortality of patients with CLD increases once cirrhosis develops. Same etiopathology process at the same fibrosis stage is likely to produce different amounts of collagen in different individual patients [66]. Histological staging is not sensitive enough to measure minor changes in the fibrosis amount and fibrosis progression through histological stages does not always represent an increase in fibrosis. It is important to monitor fibrosis over time as the progression of fibrosis is variable. MRE may be a useful surrogate marker for liver fibrosis burden [67


Related posts:

Stay updated, free articles. Join our Telegram channel
Full access? Get Clinical Tree
