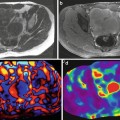
Fig. 5.1
MRE of benign FLLs. Examples of hemangioma (top row), hepatocellular adenoma (middle row), and focal nodular hyperplasia (bottom row). T2-weighted images (first column), wave images (second column) and stiffness maps (third column). The mean stiffness of hemangioma and hepatocellular adenoma is similar to slightly higher than liver parenchyma. Focal nodular hyperplasia demonstrated here has higher stiffness probably due to fibrotic scaring but is still less than 5 kPa
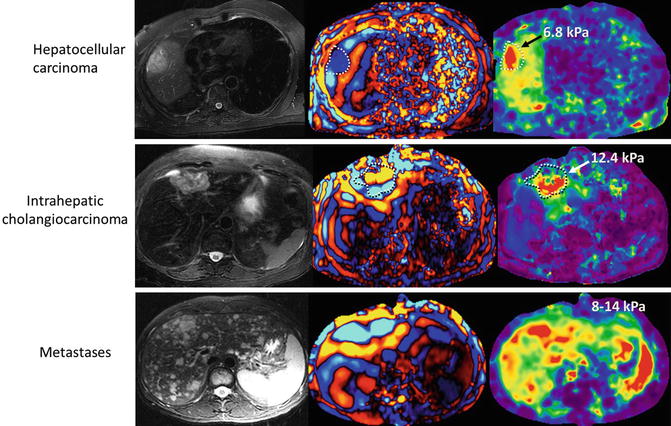
Fig. 5.2
MRE of malignant FLLs. T2-weighted images (first column), wave images (second column) and stiffness maps (third column). Examples of hepatocellular carcinoma, intrahepatic cholangiocarcinoma, and metastases. The mean stiffnesses of the lesions are significantly higher than the surrounding liver. Note the increased stiffness of the liver in multiple metastases with focal areas of increased stiffness representing the metastases
In a preliminary study, Venkatesh et al. [5] studied 44 focal tumors (13 benign and 31 malignant) and found that the mean stiffness of the malignant lesions was significantly higher than benign tumors (10.1 vs. 2.7 kPa, p < 0.001), normal liver parenchyma (vs. 2.3 kPa, p < 0.001), and fibrotic livers (vs. 5.9 kPa, p < 0.001) (Fig. 5.3). The mean stiffness of benign tumors was not significantly different from normal liver parenchyma. Fibrotic livers were significantly stiffer than benign liver tumors. In this study, a threshold value of 5 kPa was able to accurately distinguish malignant from benign liver tumors (Fig. 5.3) with 100 % accuracy. Garteiser et al. [6] studied 72 FLLs (37 benign and 35 malignant) and found that absolute shear modulus and loss modulus were significantly higher in malignant tumors as compared to benign tumors. The loss modulus was found to be significantly better than storage modulus and shear modulus (0.774 vs 0.578 and vs.0.718 respectively) for discriminating malignant from benign lesions. These preliminary studies need to be supported by larger studies. In a recent study, Venkatesh et al. showed that MRE performs significantly better than DWI in differentiating primary neoplasms of the liver (0.98 vs.0.85, p = 0.008) [33].
Fig. 5.3
Box-plot graph showing distribution of mean stiffness of 44 benign and malignant focal liver lesions, normal liver, and fibrotic liver. Note that a cut-off value of 5 kPa separates malignant and benign tumors. Fibrotic liver stiffness overlaps the benign and malignant tumors. (Reproduced with permission from Venkatesh et al. [5]: Reprinted with permission from the American Journal of Roentgenology)
Malignant tumors tend to be larger than benign tumors. However the tissue stiffness is dependent on composition and therefore stiffness of the FLL is probably independent of the size of the lesion (Fig. 5.4). Among the benign tumors, hemangiomas and hepatocellular adenomas are softer than focal nodular hyperplasia. Cholangiocarcinomas are stiffer than HCCs and may be dependent on relative amount of fibrosis, solid tissue, and necrotic components. Characterization of individual types of FLL using stiffness values may be possible and future studies in this direction are awaited. An example is demonstrated in Fig. 5.5. In this example of epithelioid angiomyolipoma, the lesion shows a predominantly fatty core surrounded by an intensely enhancing region. The central core region is softer while the surrounding region is stiffer.
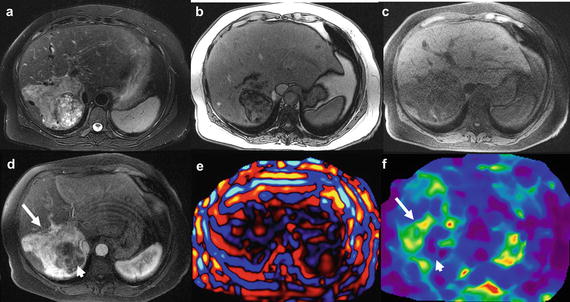
Fig. 5.4
Graph showing correlation between size and stiffness of 110 focal liver lesions (malignant-85 and benign-25). Red dots represent malignant tumors and green dots benign tumors. No significant correlation was found between stiffness and tumor size (R 2 = 0.05). Three sclerosing hemangiomas (arrows) had stiffness more than 5 kPa. (Presented at SBCTMR Annual Conference 2008, Charleston, SC, USA) (color figure online)
Fig. 5.5
MRE of epithelioid angiomyolipoma. T2-weighted (a), opposed-phase gradient–recalled echo (b), fat-suppressed T1-weighted (c), contrast enhanced T1-weighted (d), wave (e) images and stiffness map (f). Note the central core (arrow head) with predominantly fatty tissue and less enhancing region is softer (1.8 kPa) on stiffness map while the surrounding less fat containing and enhancing tissue is stiffer (4.6). The stiffness of the entire FLL was about 3.18 kPa suggesting a benign FLL
Cystic or necrotic regions of large tumors, or those which become necrotic following treatment, may be demonstrated as areas of lower stiffness (Fig. 5.6). In a recent study, Pepin et al. demonstrated a significant decrease in tumor shear stiffness within 4 days of chemotherapy treatment in an animal model. A similar study by Li et al. [34] also demonstrated that a reduction in tumor viscoelasticity occurs earlier than changes in tumor ADC. Demonstration of change in MRE-derived shear stiffness may be useful as an early and sensitive biomarker of tumor response. This early reduction in stiffness may represent reduced vascularity and decreased interstitial pressure that can occur before necrosis results.
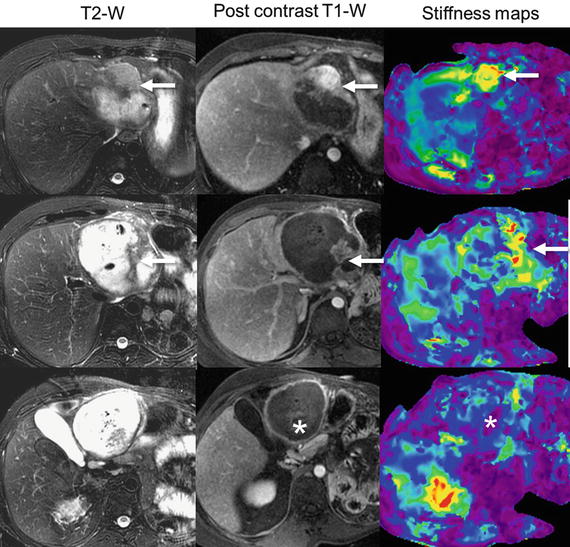
Fig. 5.6
MRE of hepatocellular carcinoma 6 weeks post chemoembolization. The large mass in left lobe liver shows significant necrosis with residual enhancing regions (arrows) consistent with residual tumor. The residual tumors are seen as stiff regions on the stiffness maps. Section through a completely necrotic region (asterisk, bottom row) shows low stiffness
Focal Lesions in Fibrotic Liver
Fibrosis of liver is a known risk factor for development of HCC. As stiffness correlates with degree of fibrosis, elevated stiffness may be considered a risk factor for development of HCC. Studies have shown that liver stiffness assessed with MRE or ultrasound based technique is associated with higher risk of HCC development [35, 36]; however in another study Anaparthy et al. [37] found no such correlation. Clearly more studies are warranted in this direction to determine whether stiffness of liver is a risk factor for development of HCC. HCCs developing in cirrhotic liver may appear either stiffer or softer than surrounding parenchyma depending on the degree of fibrosis in the surrounding parenchyma and components of the HCC (Fig. 5.7).
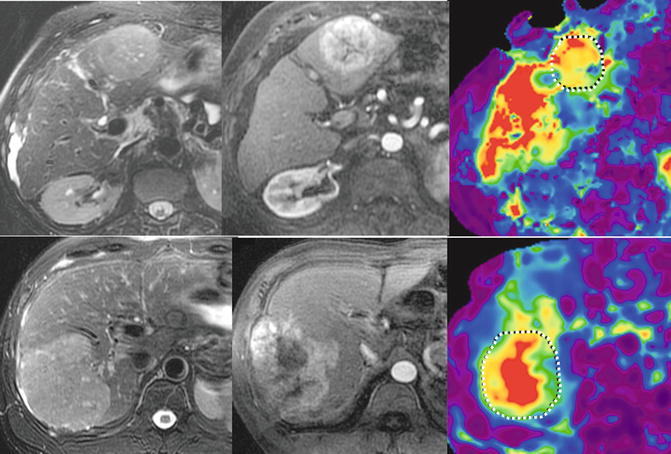
Fig. 5.7
MRE of hepatocellular carcinomas in fibrotic liver. T2-weighted images (first column), late arterial phase (second column) and stiffness maps (third column). In the first example (top row) the HCC has a stiffness of 6.6 kPa and surrounding liver parenchyma is 8.3 kPa. In the bottom row, the stiffness of HCC and liver parenchyma are 7.6 and 3.4 kPa respectively
Other Stiff Focal Lesions in Liver
Benign lesions that contain fibrotic tissue components may be stiffer and these should not be interpreted as malignant lesions. Lesions that may appear as stiff regions include inflammatory lesions which have fibrotic components such as confluent fibrosis, hyalinizing granulomas, and healing liver abscesses (Fig. 5.8). Some benign tumors like focal nodular hyperplasia (Fig. 5.1) and sclerosing hemangiomas can appear very stiff (Fig. 5.9) as they can have stiffer components. The stiffness values of these lesions should be interpreted with other imaging features for characterization. Shear waves do not propagate through cysts as fluids do not support shear waves. Therefore cysts typically appear as soft lesions or void regions within liver.
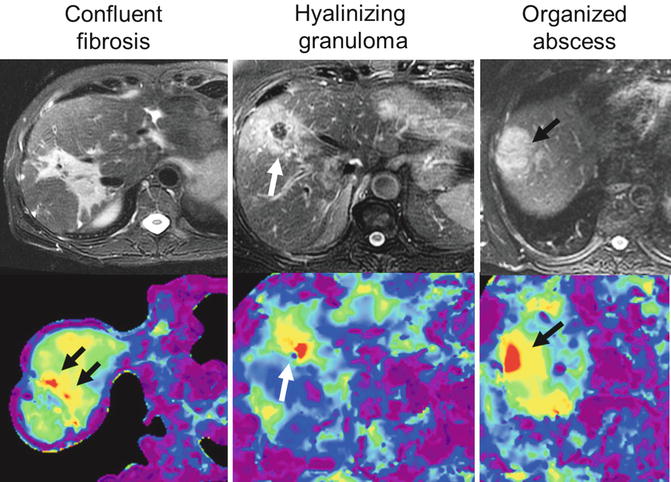
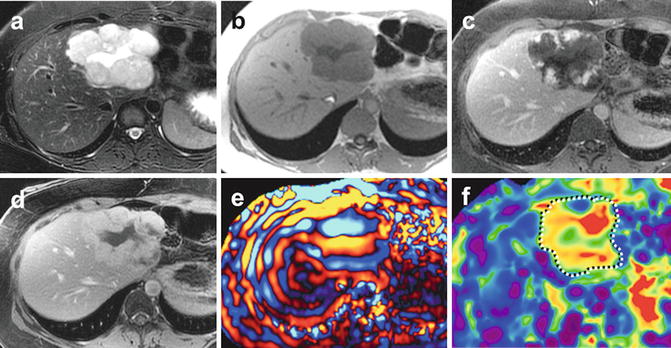
Fig. 5.8
Benign focal lesions that can present as stiff regions on MRE. T2-weighted images (top row) and stiffness maps (bottom row). Examples of confluent fibrosis, hyalinizing granuloma, and organized abscess demonstrating increased stiffness (arrows)
Fig. 5.9
MRE of a sclerosing hemangioma. T2-weighted (a), T1-weighted (b), post contrast enhanced (c) and delayed (d) T1-weighted images, wave image (e), and stiffness (f) showing a large hemangioma in the left lobe that shows increased stiffness with MRE
Future Directions
Related posts:

Stay updated, free articles. Join our Telegram channel

Full access? Get Clinical Tree


