Clinical Cases: Benign Lesions
This chapter and Chapter ▶ 7 and ▶ 8 provide representative cases to demonstrate the spectrum of elastographic findings in both benign and malignant pathologies. The cases have been selected to highlight pitfalls, and they are followed by a discussion on how to avoid them. When appropriate, technique tips are provided to optimize the elastography images. For most cases both the strain elastography (SE) and the shear wave elastography (SWE) images of the same lesion are provided as well as images from multiple vendors. If not otherwise specified, SE refers to strain imaging using the manual displacement technique, not Virtual Touch imaging (VTi, Siemens Ultrasound, Mountain View, CA, i.e., strain imaging with acoustic radiation force impulse [ARFI]).
Based on our experience we have developed a set of rules on how to characterize breast lesions as benign or malignant.65 These values are described in the box below.
Strain Elastography (SE)
A gray-scale map is used for SE data without a B-mode image superimposed. The B-mode image is displayed separately in a dual-mode display.
E/B ratio—< 1 classified as benign; ≥ 1 classified as malignant
5-point color scale—scores of 1, 2, and 3 classified as benign; scores of 4 or 5 classified as malignant
Strain ratio (lesion to fat ratio)—< 4.5 classified as benign; > 4.5 classified as malignant
Bull’s-eye artifact—diagnostic of a benign simple or complicated cyst
Shear Wave Elastography (SWE)
Vs: Vs maximum is used unless otherwise stated. A Vs of < 4.5 m/s (< 60 kPa) is classified as benign and a Vs > 4.5 m/s (> 60 kPa) is classified as malignant. In our default color map red is stiff and blue is soft. Unless otherwise stated a maximum value on the color scale of 7.7 m/s (180 kPa) is used. Therefore lesions suggestive of benign will be color coded blue, and those suggestive of malignancy will be color coded yellow or red.
Other papers suggest other cutoff values. Some authors suggest a cutoff value of an E/B ratio of 1.2.10 This cutoff does improve specificity; however, low-grade malignancies such as ductal carcinoma in situ (DCIS) or mucinous cancers may be misclassified. Many authors suggest a cutoff value of Vs = 5.2 m/s (80 kPa).58 The results in our lab suggest a cutoff value of Vs = 4.5 m/s (60 kPa).65 The difference may be secondary to effects of precompression. We use the technique previously described in chapters ▶ 3 to maintain a < 10% precompression. Other studies did not control for precompression in a standard fashion.
Our routine breast ultrasound protocol includes both SE and SWE imaging of all breast masses or nonmass lesions. If a palpable lesion is present and a B-mode lesion is not identified, both SE and SWE are performed at the site of the palpable abnormality to exclude an isoechoic mass. Representative SE and SWE images are taken throughout the lesion, particularly if the lesion is heterogeneous. We obtain at least three SE and three SWE images for each lesion. This protocol does not add much additional scanning time because we obtain a B-mode image, a color or power Doppler image, an SE image, and then an SWE image for each lesion. For most cases it is obvious if the E/B ratio is suggestive of a benign or malignant lesion, and we perform the measurements after the patient leaves on the Picture Archiving and Communication System (PACS). Measurement of the strain ratio (lesion to fat ratio) and shear wave velocity (Vs) measurements on SWE must be made at the time of scanning; retrospective measurements are not possible.
For biopsies we target the highest Vs portion of the lesion. If the lesion (mass or nonmass lesion) has better conspicuity on elastography we use elastographic guidance when performing the biopsy.
6.1 Case 1: Cystic Lesion—Simple Cyst
6.1.1 Clinical Presentation
A 59-year-old woman presented with a 1.5 cm mass noted in the right breast on a computed tomographic (CT) scan of the chest performed for chest pain. An ultrasound was performed for further evaluation. A mammogram was not performed.
6.1.2 Ultrasound Findings
On B-mode imaging (▶ Fig. 6.1a) the lesion is a well-circumscribed mass with a thin wall. No wall thickening or nodularity was identified. No internal echoes were noted. There is through transmission that is dispersed over a wedge shape secondary to the use of spatial compounding. The lesion measured 17 × 11 mm (▶ Fig. 6.1b). These B-mode findings are diagnostic of a benign simple cyst. On color Doppler (▶ Fig. 6.1c) some blood flow in normal breast tissue is identified but no blood flow is noted within the lesion or adjacent to the lesion. The lesion was classified as Breast Imaging–Reporting and Data System a (BI-RADS) category 2 lesion.
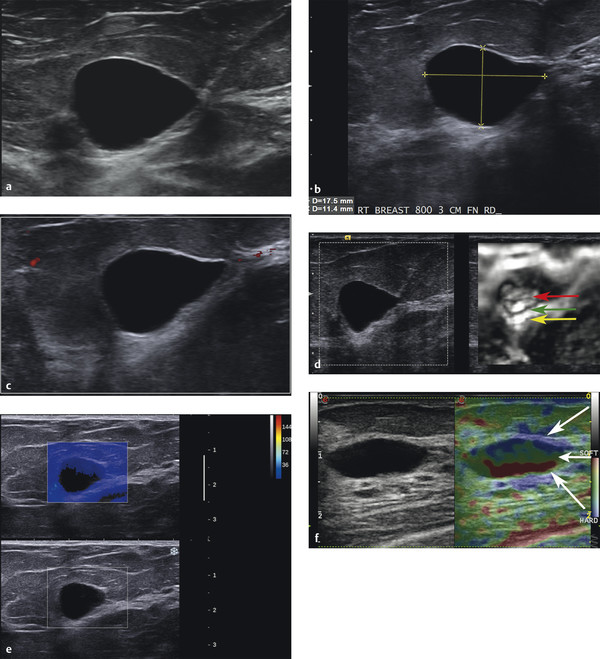
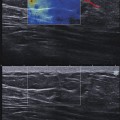
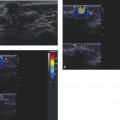
Fig. 6.1 (a) B-mode image of a mass identified on computed tomography. The mass is anechoic, has a thin wall, through transmission, and no internal echoic, thus meeting all criteria for a benign cyst. (b) The simple cyst noted in (a) measures 17 × 11 mm. (c) On power Doppler imaging the cyst does not have internal or peripheral blood flow. (d) The strain elastogram of the lesion; the left image is the corresponding B-mode image and the image on the right is the strain elastogram. There is a bull’s-eye artifact on the elastogram characterized by the central white area (red arrow), black surrounding rim (green arrow) and a distal white spot (yellow arrow). (e) The shear wave elastogram of the lesion. The lower image is the corresponding B-mode image, whereas the upper image is the shear wave elastogram. Note that the majority of the cyst does not color code. Simple cysts do not support shear waves so none are detected and therefore not color coded. There is some “bleeding” of blue color in the anterior portion of the cyst that can sometimes occur. (f) The strain elastogram of a different simple cyst using the Esaote system (Esaote North America, Inc., Indianapolis, IN). This system does not produce the bull’s-eye artifact, but instead the blue, green, red (BGR) artifact. The three arrows point out the three colored layers.
The strain elastogram is present in ▶ Fig. 6.1d. The image on the left is the conventional B-mode image, and the image on the right is the elastogram. The elastogram is colored coded with black as stiff and white as soft. On the strain elastogram (▶ Fig. 6.1d) the characteristic bull’s-eye artifact is identified, confirming the lesion is a benign cystic lesion. On shear wave imaging (▶ Fig. 6.1e) the majority of the cyst is not color coded. There is some bleeding of shear wave color in the proximal portion of the cyst.
6.1.3 Diagnosis
Simple cyst. The cyst was aspirated using a 25-gauge needle under ultrasound guidance at the request of the patient. The lesion completely resolved with aspiration. Cytology was not performed.
6.1.4 Discussion
Cysts meeting all the criteria for simple cysts (thin walled, anechoic, no internal blood flow, and through transmission) can be confidently classified as BI-RADS category 2 lesions (benign). In these cases elastography is not required to confirm the diagnosis. Occasionally, a solid homogeneous lesion may simulate a benign cyst, particularly if the ultrasound settings are not properly set. In these cases strain elastography is helpful in determining if the lesion is cystic or solid.
In SE the bull’s-eye artifact occurs when the contents are freely movable. If a lesion is solid or has a very high viscosity the artifact will not occur. If there is a solid component within the cyst it will cause a stiff defect in the artifact (see Cases ▶ 6.6 and ▶ 6.7). The bull’s-eye artifact is characterized by (1) an outer rim of black (stiff) signal, with (2) a centrally located white (soft) area, and (3) a white (soft) area distal to the lesion. All three components are required for a confident diagnosis that the lesion is a benign cystic lesion.48 The use of the bull’s-eye artifact has been shown to decrease the biopsy rate and increase the positive biopsy rate.48 The bull’s-eye artifact occurs with equipment from both Philips and Siemens. When using the Philips equipment an elasticity imaging (EI) setting of 2 is required to obtain the bull’s-eye artifact. When an EI setting of 1 is used the central white area is not present. Because of the possibility of a stiff lesion being just anterior to a soft lesion that can simulate a cyst with EI setting 1, an EI setting of 2 is suggested for use in evaluation of cystic lesions. Another technique using this artifact is anechoic imaging (AI) available on Philips systems. AI codes the areas of freely moveable fluid as yellow and areas with nonmoveable tissue as blue. Equipment from other vendors identifies a blue, green, red (BGR) tricolor pattern (▶ Fig. 6.1f). This artifact has not been studied in detail to determine its sensitivity and specificity for benign cystic lesions. The appearance or nonappearance of the BGR sign in complex cystic lesions has not been studied.
A simple cyst does not support shear wave generation and therefore will not be color coded. Color coding will also not occur when adequate shear waves are not generated within the tissue. This can occur if a lesion is deep (usually > 4 cm) or if the lesion is very stiff as in some cancers. However, if there is debris in the cyst or if it has viscosity increased over simple fluid it will generate a shear wave and will be color coded with low (benign) Vs. In the presented case shear waves are not generated (color coded black) confirming the lesion is a simple benign cyst. As in this case, there is often bleeding of color from the adjacent soft tissue into the proximal portion of the cyst. If a cyst is complicated, shear waves will be generated, and the lesion will be color coded blue (soft). The appearance of a complicated cyst and fibroadenoma will be identical on shear wave imaging. Both of these lesions will be color coding as soft lesions with a low Vs value (blue). Note that with strain imaging the distinction between a cystic lesion and fibroadenoma can be made.
Based on the proposed BI-RADS like elastography classification system presented in Chapter ▶ 5, this would be considered to have an approximately 0% change of malignancy.
6.2 Case 2: Cystic Lesion—Complicated Cyst
6.2.1 Clinical Presentation
A 51-year-old woman presented with a palpable mass in her left breast. Prior mammograms were classified as BI-RADS category 1 with heterogeneously dense breasts. A mammogram was not performed at the time of presentation.
6.2.2 Ultrasound Findings
B-mode ultrasound (▶ Fig. 6.2a) shows a 1.8 cm oval lobulated cystic lesion with internal echoes that did not change on repositioning of the patient. On color Doppler imaging (▶ Fig. 6.2b) there is some blood flow in surrounding tissue but no blood flow within the lesion. The lesion was characterized as BI-RADS category 3.
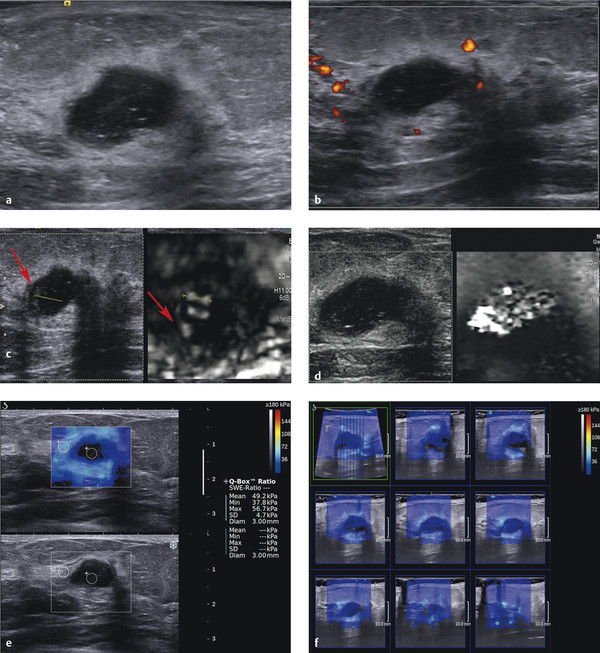
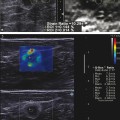
Fig. 6.2 (a) B-mode image of the palpable mass. The mass is lobular, well circumscribed, and contains multiple internal echoes. There is through transmission. (b) Power Doppler image of the lesion demonstrates there is no internal blood flow but some peripheral blood flow. (c) Strain elastogram of the lesion demonstrates a bull’s-eye artifact in a portion of the lesion (dotted line). The area with increased echoes along the wall (arrow) is coded soft (white) on the elastogram. This implies the material is not freely moving but is soft. (d) The Virtual Touch Image (VTI, Siemens) displays the complicated cyst as a soft lesion (white). VTI uses an acoustic radiation force impulse (ARFI) push pulse to generate the displacement used to calculate a strain image. The bull’s-eye artifact does not always occur with VTI because a different algorithm is used. (e) Shear wave elastography (SWE) of the lesion demonstrates the area with the bull’s-eye artifact is not color coded, consistent with simple fluid (dotted circle). The areas with increased echoes along the wall are color coded blue, suggesting they are viscous enough to support shear wave propagation. The surrounding glandular tissue has a Vs of 4.1 m/s (49 kPa) consistent with dense glandular benign tissue. (f) Results of a three-dimensional (3D) shear wave elastogram where the 3D volume is sliced as demonstrated in the upper left image, and each individual slice is displayed. Similar to the 2D strain image a portion of the complicated cyst is not color coded, the periphery of the lesion is color coded blue, and the surrounding glandular tissue is color coded teal, demonstrating the glandular tissue is stiffer than the viscous portion of the complicated cyst.
On strain elastography (▶ Fig. 6.2c) a bull’s-eye artifact is identified in the cystic area without internal echoes. The echoes within the cyst are stiff and are color coded black. The shadow or copy function was used here to correlate the finding on elastography with the B-mode image. On VTI (strain imaging using ARFI) (▶ Fig. 6.2d) the majority of the lesion color codes as soft (white). When using VTI as opposed to manual displacement strain imaging (e.g., eSie Touch, Siemens) the bull’s-eye artifact may not occur. On shear wave imaging (▶ Fig. 6.2e) the color coding at the lesion’s center is not consistent with coding for simple fluid. The walls of the lesion color code softer than the surrounding glandular tissue. The use of three-dimensional (3D) SWE is helpful to confirm that there are not stiff areas within or adjacent to the lesion. The 3D results can be displayed as slices in a selected plane (▶ Fig. 6.2f).
6.2.3 Diagnosis
Complicated cyst. The lesion was aspirated with a 20-gauge needle under ultrasound guidance. The lesion completely resolved on aspiration. Pathology was cyst contents with no evidence of malignancy.
6.2.4 Discussion
Cystic lesions of the breast may be present in women of any age but are most common between 30 and 50 years of age. They may be detected incidentally on screening examinations (mammography, ultrasound, or magnetic resonance imaging [MRI]) or present as a palpable mass or nipple discharge. Complex cysts accounted for 41% of BI-RADS category 3 lesions in the ACRIN 6666 study.66 BI-RADS category 3 lesions are common and although the recommendation is a short-term interval follow-up, many lesions are aspirated or biopsied (17% in the ACRIN 6666 study) with a low positive biopsy rate.66 A technique that can improve confidence that a BI-RADS category 3 lesion is benign (or even downgrade the lesion to BI-RADS category 2) could decrease the need for biopsy or short-term follow-up.
Complicated cysts are usually well-defined cysts with low-level internal echoes or intracystic debris. The debris may layer and shift with changes in patient position. The homogeneous internal echoes within some complicated cysts may produce an appearance identical to that of a circumscribed solid mass. Complicated cysts should be distinguished from complex cystic lesions that have solid components within the cyst, thickened walls, or thick septa. The elastographic appearance of complex cystic lesions is discussed in Case ▶ 6.6.
The bull’s-eye artifact has been shown to have a very high sensitivity and specificity for diagnosis of a lesion as benign simple or complicated cysts.48 The use of this artifact to downgrade the BI-RADS category 3 cystic lesions needs further evaluation. The bull’s-eye artifact occurs on Philips and Siemens ultrasound systems. In other systems the BGR artifact occurs. This is discussed in Chapter ▶ 3. The BGR artifact has not been evaluated in detail to determine the sensitivity and specificity of this artifact in characterization of benign cystic lesions.
In the present case the complicated cyst does not have a classic appearance on conventional ultrasound. The lesion does not have a thin, well-defined wall and has the appearance of a complicated cystic mass with a solid component. Until further research is done to determine if downgrading a BI-RADS category 4A or higher lesion is evaluated, canceling a biopsy based on the bull’s-eye artifact is not recommended. However, it is important to alert the pathologist that the lesion may be a complicated cyst and not a solid mass for improved imaging–pathology correlation of the lesion. At this time it may be appropriate to downgrade a BI-RADS category 3 lesion to a BI-RADS category 2 if a bull’s-eye artifact is present. Downgrading a BI-RADS category 4A lesion to short-term follow-up may also be appropriate. Limited work by the author suggests that downgrading a BI-RADS category 4A lesion to a BI-RADS category 2 lesion when a bull’s-eye artifact is present may be appropriate (RG Barr, personal observation, October, 1, 2013).
Based on the proposed elastography classification system (similar to the BI-RADS classification) presented in Chapter ▶ 5 we would consider this an elastography result with an approximately 0% chance of malignancy.
6.3 Case 3: Cystic Lesion—Complicated Cyst
6.3.1 Clinical Presentation
The patient is a 72-year-old woman with the development of a 1 cm asymmetric density in the left breast on screening mammography, new from the prior exam. The mammogram was classified as BI-RADS category 0, and an ultrasound was advised for further workup.
6.3.2 Ultrasound Findings
B-mode imaging (▶ Fig. 6.3a) shows a 1.2 cm well circumscribed cystic lesion with some internal echoes. On power Doppler imaging (▶ Fig. 6.3b) there is a small amount of peripheral blood flow. No internal blood flow was identified. On power Doppler the internal echoes within the cyst are better appreciated.
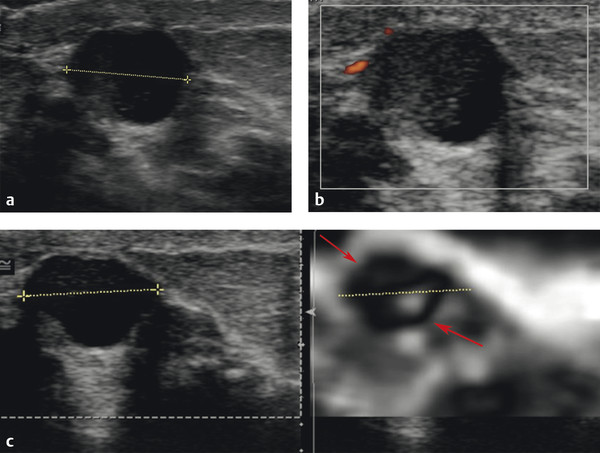
Fig. 6.3 (a) B-mode imaging of the asymmetric density noted on mammography identifies a 1.2 cm well circumscribed cystic lesion with some internal echoes. (b) Power Doppler imaging of the lesion demonstrates more internal echoes with in the lesion with the appearance of an acorn cyst. There is some peripheral blood flow, but no internal blood flow. (c) On the strain elastogram the anechoic portion of the lesion has a bull’s-eye artifact (dotted arrow), whereas the portion of the lesion with internal echoes has a stiff appearance (solid arrow). This implies that the echogenic portion is not freely moveable. It does not necessary mean that it is “solid.” Viscous debris within the cyst can give the same appearance as a solid mass. This appearance on strain elastography raises the concern that the lesion could be a complex cystic mass; however, it does not confirm it. In this case the “solid” component is coded black, meaning it is stiffer than the surrounding tissue. In this case all of the surrounding tissue is fat; therefore we can’t determine if this lesion is stiff enough to be suspicious for a malignancy. The lesion to fat ratio (not done in this case) could be helpful in characterizing the solid component as benign or malignant. The use of shear wave imaging (not performed in this case) would also help in determining the stiffness of the solid component.
On strain imaging (▶ Fig. 6.3c) the bull’s-eye artifact is identified in the anechoic portion of the cystic lesion. The area with echoes color codes stiffer than surrounding glandular tissue. The E/B ratio of the stiff component is 0.9.
6.3.3 Diagnosis
Complicated cyst. The lesion was aspirated with a 20-gauge needle. The lesion completely resolved after biopsy. Pathology confirmed cyst contents and apocrine cells. The sample was negative for malignancy.
6.3.4 Discussion
A discussion of complicated cyst occurrence and appearance on conventional ultrasound is presented in Case ▶ 6.2. Some complicated cysts may have thin septations, which may not be visualized on B-mode imaging. The bull’s-eye artifact occurs when the fluid within the lesion is freely moveable. When the fluid is confined, such as in a septated cyst, each “compartment” will yield a bull’s-eye artifact. If the cyst has several compartments a complicated pattern of overlapping bull’s-eye patterns will occur. This may lead to a pattern that is difficult to interpret.
The bull’s-eye artifact will not occur if the fluid is very viscous (thick). In these cases the strain elastogram will code the lesion as a soft lesion. On shear wave imaging viscous lesions will also code as soft, usually with a Vs of < 3.2 m/s (< 30 kPa).
In this case the echogenic component codes stiffer than surrounding tissue. This implies that the echogenic portion is not freely moveable. It does not necessarily mean that it is “solid.” Viscous debris within the cyst can give the same appearance as a solid mass. This appearance on SE raises the concern that the lesion could be a complex cystic mass; however, it does not confirm it. In this case the “solid” component is coded black, meaning it is stiffer than the surrounding tissue. In this case all of the surrounding tissue is fat, therefore we cannot determine if this lesion is stiff enough to be suspicious for a malignancy. The strain ratio (not done in this case) could be helpful in characterizing the solid component as benign or malignant. The use of shear wave imaging (not performed in this case) would also help in determining the stiffness of the solid component. The E/B ratio can be used to characterize the solid component as benign or malignant.
Elastography can be helpful in many cases in determining if a cystic lesion is a complicated cyst or a complex cystic mass. If the bull’s-eye artifact is seen throughout the lesion, the lesion is a complicated cyst without solid components. However, if there is a “defect” in the bull’s-eye artifact one will not be able to determine if the “solid” component is viscous material (complicated cyst), as in this case, or a true solid component (complex cystic lesion). Even when using shear wave imaging both viscous and a benign solid component will give the same elastographic appearance (color code blue, soft). However, if the lesion has a solid component that is malignant, it most likely will color code yellow or red, confirming high suspicion for a malignancy. The elastographic findings of cystic lesions are presented in ▶ Table 6.1.
| Simple cyst | Benign complicated cyst with freely moving debris | Benign complicated cyst with attached debris or high viscosity component | Benign complicated cystic lesion | Malignant complicated cystic lesion | |
| Strain elastography (bull’s-eye) | Bull’s-eye artifact | Bull’s-eye artifact | Bull’s-eye artifact with defect in the solid component | Bull’s-eye artifact with the defect in the solid component | Bull’s-eye artifact with the defect in the solid component |
| Strain elastography (BGR) | BGR artifact | BGR artifact | |||
| Shear wave elastography | No color coding | Color coded low Vs | Color coded low Vs | Color coded low Vs | Color coded high Vs |
| Abbreviation: BGR, blue, green, red. | |||||
Based on the proposed elastography classification system (similar to the BI-RADS classification) presented in Chapter ▶ 5 we would consider this to have an approximately 0% chance of malignancy.
6.4 Case 4: Cystic Lesion Isoechoic Complicated Cyst
6.4.1 Clinical Presentation
A 36-year-old woman presented to her primary care physician with a palpable mass in her right breast. She was referred for a mammogram and ultrasound, both of which were negative (BI-RADS category 1). She was referred to a surgeon who confirmed a palpable mass and referred the patient for an ultrasound with elastography.
6.4.2 Ultrasound Findings
On B-mode and color Doppler ultrasound no abnormality is identified (BI-RADS category 1).
The transducer was placed over the palpable abnormality and SE activated. A bull’s-eye artifact is identified at the site of the palpable abnormality (▶ Fig. 6.4). When cursors are placed on the bull’s-eye lesion and the copy function is used, it becomes obvious that the lesion is an isoechoic, complicated cyst on B-mode.
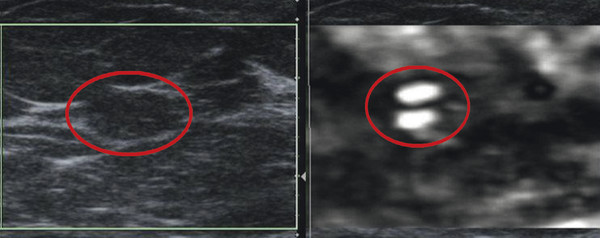
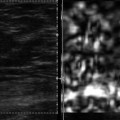
Fig. 6.4 Elastogram of a palpable mass that does not have an explanation on B-mode imaging (left). The transducer was placed over the palpable mass and strain elastography turned on. A bull’s-eye artifact is identified (circle) corresponding to an isoechoic area on the B-mode image that was originally interpreted as a fat lobule. The bull’s-eye artifact confirms that this is an isoechoic, complicated cyst. The cyst was aspirated with resolution of the palpable abnormality.
6.4.3 Diagnosis
Complicated cyst. The lesion was aspirated using a 20-gauge needle under ultrasound guidance, obtaining slightly turbid yellow fluid. The lesion and palpable abnormality completely resolved after aspiration. The cytology of the aspirate was negative.
6.4.4 Discussion
This case demonstrates that a lesion may be isoechoic to adjacent tissues in B-mode imaging and not appreciated on B-mode imaging. However, it can clearly be identified on elastography because the elastic properties of the two tissues are different. A mass may appear as one lesion on B-mode imaging but appear as two lesions on elastography for the same reason. The two adjacent lesions may be isoechoic to each other but have different elastic properties. An example would be a fibroadenoma adjacent to a malignancy. The opposite can also occur with a lesion being isoelastic to surrounding tissue and not appreciated as a separate “lesion” on elastography but clearly identified as two tissue types on B-mode imaging. This often occurs with fibrocystic change within surrounding fibroglandular tissue. In this case the two tissue types, hypoechoic fibrocystic change and hyperechoic fibroglandular tissue, are easily distinguished on B-mode imaging but will appear as one lesion with identical stiffness on elastography.
It is not uncommon to identify bull’s-eye artifacts in a patient, and the complicated cyst is not appreciated on B-mode imaging because the lesions are isoechoic. These lesions are usually < 1 cm in size.
Based on the proposed elastography classification system (similar to the BI-RADS classification) presented in Chapter ▶ 5 we would consider this an approximately 0% chance of malignancy.
6.5 Case 5: Cystic Lesion—Apocrine Microcyst
6.5.1 Clinical Presentation
A 40-year-old woman presents with a new tubular, well circumscribed lesion in her left breast on screening mammography. The lesion was classified as BI-RADS category 0, and an ultrasound was advised for further workup.
6.5.2 Ultrasound Findings
On B-mode imaging (▶ Fig. 6.5a) a cystic lesion with septations and nodular components is noted. No through transmission is identified. On power Doppler imaging (▶ Fig. 6.5b) there is significant blood flow in the solid components of the cystic lesion. This raises the question as to whether this is a complicated cyst or a complex cystic mass. The lesion was classified as BI-RADS category 4A.
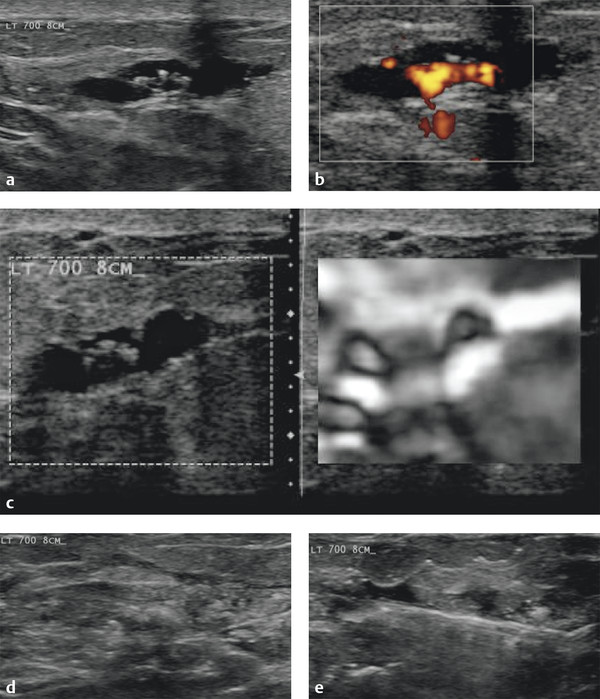
Fig. 6.5 (a) On B-mode imaging the lesion has a complex appearance with both cystic and solid nodular components. There is no through transmission identified. (b) On power Doppler evaluation there is significant blood flow in the solid nodular components of the lesion, suggesting this is a complex cystic lesion and not a complicated cyst. (c) On the elastogram the peripheral cystic areas both have well identified bull’s-eye artifacts (arrows). The central portion of the lesion that has both cystic and solid components is a light gray on the elastogram. This is partially due to overlapping bull’s-eye artifacts in the small cysts in this region. (d) Image from the vacuum-assisted 12-gauge needle biopsy removal of the lesion. (e) B-mode image of the area confirming complete removal of the lesion at biopsy.
On SE (▶ Fig. 6.5c) bull’s-eye artifacts are noted in the two larger septated cystic components in the peripheral portions of the lesion. The central portion of the lesion that contained the more solid components is similar in stiffness to the surrounding breast tissue. The lesion was biopsied with a 12-gauge vacuum-assisted needle under ultrasound guidance (▶ Fig. 6.5d). After the procedure the lesion was completely removed (▶ Fig. 6.5e).
6.5.3 Diagnosis
Apocrine microcysts. The lesion was completely removed with a 12-gauge vacuum-assisted core biopsy needle under ultrasound guidance. The pathology was apocrine microcysts.
6.5.4 Discussion
Clustered microcysts have been defined as lesions consisting of a cluster of tiny anechoic foci that individually are 2 to 3 mm with thin (< 0.5 mm) intervening septations and no discrete solid components. These lesions have been reported to occur in 5.8% of breast ultrasounds and have a very low probability of malignancy.67
The bull’s-eye artifact is discussed in detail in Chapter ▶ 3 and in Case ▶ 6.1 of this chapter. In the case of clustered microcysts each individual small cyst will have a bull’s-eye artifact pattern. Because they are clustered the appearance can be hard to interpret with overlapping bull’s-eye artifacts. In this case the two larger cysts occurring in the periphery of the lesion have well visualized bull’s-eye artifacts, whereas the small cysts located in the central portion of the lesion have a light gray appearance. On SWE (not performed in this case) the small cysts will code as soft lesions (blue). The cystic component on shear wave imaging may not color code if the fluid is simple but will color code blue if there is some debris or increased viscosity in the cystic component.
Based on the proposed elastography classification system (similar to the BI-RADS classification) presented in Chapter ▶ 5 we would consider this lesion to have an approximately 0% chance of malignancy.
6.6 Case 6: Cystic Lesion—Complex Cystic Lesion
6.6.1 Clinical Presentation
An 85-year-old woman presents with a new palpable mass in the left breast. Mammography confirms the presence of a 2 cm relatively well circumscribed lesion. The mammogram was classified as BI-RADS category 0, and an ultrasound was advised for further workup.
6.6.2 Ultrasound Findings
B-mode imaging (▶ Fig. 6.6a,b) demonstrates a 2.1 cm oval mass with some indistinct borders and some septated cystic components. There is refractive shadowing noted as well as through transmission. The “solid” components do not change on repositioning of the patient. There is significant blood flow in the solid components and in the periphery of the lesion on color Doppler imaging (▶ Fig. 6.6c). The lesion was classified as a BI-RADS category 4B lesion.
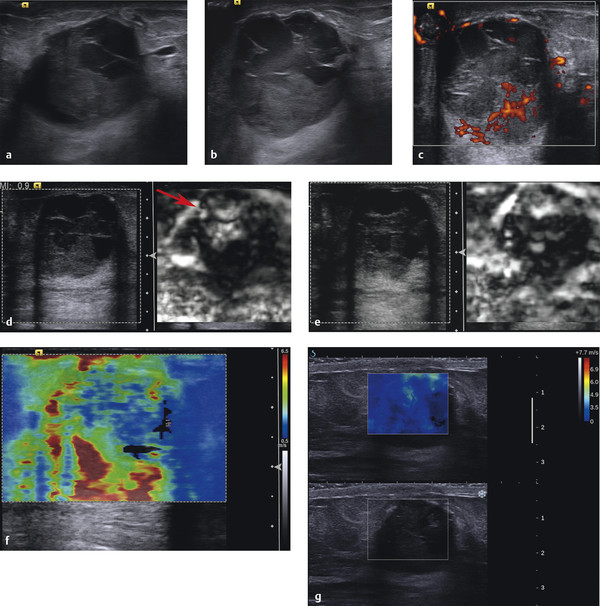
Fig. 6.6 (a) B-mode image of the palpable mass demonstrates a mass with some ill-defined borders, solid and cystic components, refractive shadowing, and through transmission. (b) B-mode at another location demonstrates more cystic components with fine septations. The solid portion of the lesion accounts for greater than 50% of the lesion. (c) Power Doppler imaging confirms the presence of blood flow in a portion of the solid component and within the wall of the lesion. Some of the “solid”-appearing components on the B-mode images are more hypoechoic than the solid component with blood flow (solid arrow) and may represent internal echoes from debris and not a solid component (dotted arrow). (d) Strain elastogram confirms the presence of a bull’s-eye artifact (arrow) in the anechoic portions of the lesion. The remainder of the lesion color codes stiffer than the surrounding tissue. (e) Strain elastogram in a different location has similar findings with multiple bull’s-eye artifacts noted (arrows). The solid avascular areas noted on power Doppler do not have bull’s-eye artifacts, suggesting they are either very viscous or solid. (f) Shear wave imaging of the lesion has high Vs in the solid components of the lesion (solid arrow) and low Vs in the cystic portions of the lesion (dotted arrow). (g) Real-time shear wave imaging demonstrates similar findings with the solid components color coding teal. The cystic components code dark blue, suggesting they are not simple fluid but have some debris within them.
On SE (▶ Fig. 6.6d,e) there is a complex pattern of overlapping bull’s-eye artifacts from the cystic components. The solid components are stiff, confirming they are fixed and not mobile. Because of the irregular shape and intervening cystic components calculation of an E/B ratio or strain ratio is difficult. We calculated an E/B ratio of 1 based on selecting one area of the stiff component. With blood flow noted on power Doppler within the “solid” components we know that the stiff area is a solid lesion and not adherent debris or an area of increased viscosity. This lesion is therefore a complex cystic lesion and not a complicated cyst. On shear wave elastography (▶ Fig. 6.6f) the cystic components have low Vs values (1.3–1.8 m/s; 5–10 kPa), whereas the solid components have high Vs values of up to 6 m/s. On a different shear wave system (▶ Fig. 6.6g) the solid components have elevated Vs of up to 4.5 m/s (60 kPa), and the cystic components have Vs values of 1.2 to 1.8 m/s (4–10 kPa).
6.6.3 Diagnosis
Large duct papilloma. The cystic components were aspirated with a 20-gauge needle under ultrasound guidance. The solid components were then biopsied using 12-gauge vacuum-assisted needle under ultrasound guidance. Pathology was a large duct papilloma without atypia.
6.6.4 Discussion
Complex cystic lesions have mixed cystic and solid components, a thick wall or thick septations, or an intracystic mass. These lesions merit biopsy with a 23% malignant rate in the series of Berg et al.68 Complex cysts are associated with a variety of benign, atypical, and malignant diagnoses. Common benign causes of complex cystic masses include fibrocystic changes, intraductal or intracystic papilloma without atypia, and fibroadenoma. Atypical findings include atypical ductal hyperplasia, lobular neoplasia, and atypical papilloma. Malignant findings include DCIS, infiltrating ductal carcinoma, and infiltrating lobular carcinoma.69 Because of the significant chance of malignancy, image-guided or surgical biopsy is usually indicated.
At ultrasound breast cysts are categorized as simple, complicated, or complex.4,68 By using the criteria adapted from Berg et al,68 complex cystic breast masses can be categorized into four classes on the basis of their ultrasound features: type 1 masses have a thick outer wall, thick internal septa, or both; type 2 masses contain one or more intracystic masses; type 3 masses contain mixed cystic and solid components and are at least 50% cystic; and type 4 masses are predominantly (at least 50%) solid with eccentric cystic foci.69 The method of biopsy for these lesions is described elsewhere.69
It is important to determine if a lesion is a complicated cyst or a complex cystic mass. If the internal echoes are movable on B-mode imaging without stationary components the diagnosis of a complicated cyst can be made. If blood flow is noted on color or power Doppler within the “solid” component of the lesion the diagnosis of a complex cystic lesion can be made. However, there are many lesions that have characteristics between these two presentations. Internal debris can be stationary, such as in an acorn cyst, and solid components in a lesion may not have perceivable blood flow on color or power Doppler.
SE can be extremely helpful in distinguishing these two cases. When a solid component is present it will appear stiffer than the adjacent components in the lesion. If the internal echoes are freely moveable they will not affect the bull’s-eye artifact, and a diagnosis of a complicated cyst can be made. If the viscosity of the cystic component is very high, a bull’s-eye artifact will not occur, but it will code as soft. If there is a solid component, the E/B ratio or strain ratio can be used to determine if the lesion is benign or malignant.
However, with shear wave imaging both complicated cysts and benign complex cystic lesions will color code as soft (blue). If the solid component is a malignancy it will code as stiff enough to suggest a malignancy. Therefore strain imaging is helpful in characterizing a cystic lesion as a complicated cyst or a complex cystic lesion, and, if a complex cystic lesion, whether it is benign or malignant. Shear wave imaging is helpful in determining if the lesion is benign or malignant. ▶ Table 6.1 lists the elastographic appearance of cystic lesions.
In the present case we have a mass with greater than 50% solid components and a cystic area with septations, a type 4 lesion. On power Doppler imaging blood flow is noted confirming this lesion is a complex cystic lesion and not a complicated cyst. Strain imaging demonstrates a bull’s-eye artifact in the cystic component, whereas the solid component is stiff. In this case the E/B ratio is 1 and should therefore be considered as possible for malignancy. The shear wave imaging on both systems has some increased peripheral Vs and should be considered a possible malignancy and requires biopsy.
Based on the proposed elastography classification system (similar to the BI-RADS classification) presented in Chapter ▶ 5 we would consider the elastography findings as having a greater than 95% chance of malignancy (2–95% on SE, and > 95% on SWE).
6.7 Case 7: Cystic Lesion—Complex Cystic Lesion
6.7.1 Clinical Presentation
The patient is a 68-year-old woman who presents with a right breast bloody discharge and palpable mass in the right breast. A diagnostic mammogram demonstrates a 4 cm lobular mass. The mammogram was classified as BI-RADS 0, and an ultrasound was advised for further workup.
6.7.2 Ultrasound Findings
On B-mode imaging (▶ Fig. 6.7a) a complex 4.5 cm complex, well-defined lobular mass is identified. A panoramic view (▶ Fig. 6.7b) of the lesion demonstrates two components—a medial portion with a fluid-fluid level and a lateral portion with a lobular mass within a cystic area. Medial to the lesion extending to the nipple is a tubular structure (▶ Fig. 6.7c). Power Doppler evaluation (▶ Fig. 6.7d) demonstrates peripheral blood flow extending into the solid component of the lesion. The lesion was classified as BI-RADS category 4B.
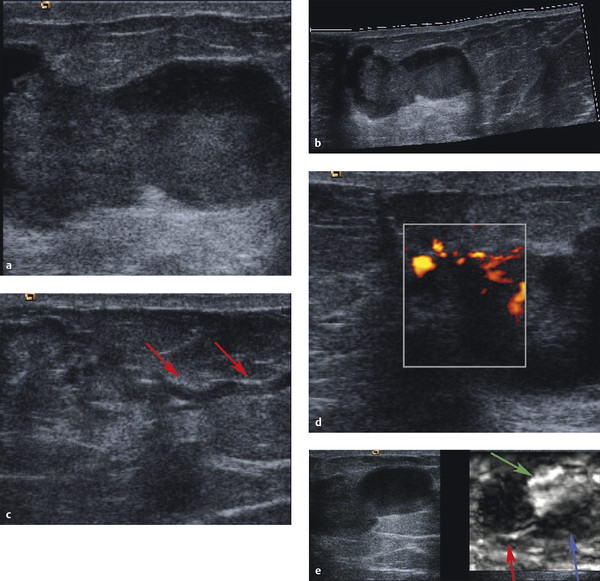
Fig. 6.7 (a) B-mode image of a large complex lesion. The lesion has a dumbbell appearance with cystic and solid-appearing components in each portion. (b) A panoramic B-mode image of the lesion demonstrates the lesion is well circumscribed, has through transmission on both components, and appears to have a fluid-debris level in the medial component (arrow). (c) On B-mode imaging there is a ductal structure extending from the lesion to the nipple (arrow). (d) On power Doppler imaging there is internal blood flow noted in the lateral component but not in the medical component (not shown). (e) On strain elastography the lateral component codes stiffer (black) than surrounding tissue and has an E/B ratio of 0.9 (red arrow). The medical component of the lesion color-codes softer (white) than surrounding tissue (green arrow). A bull’s-eye artifact is not identified. Close inspection demonstrates the debris in the medial component color codes stiffer than the remainder of the component (blue arrow). In this case the medial component was old blood products that have enough viscosity to not allow formation of the bull’s-eye artifact. The lateral component codes stiff with an EI/B ratio of < 1, suggesting it is a benign solid component.
On strain imaging (▶ Fig. 6.7e) the medial portion of the image is very soft, whereas the lateral portion of the mass is stiffer than surrounding breast tissue. The lateral lesion has an E/B ratio of 0.9, suggestive of a benign lesion. On the 5-point color scale the lesion would have a score of 2. Shear wave imaging is not available for this case.
6.7.3 Diagnosis
Large duct papilloma. The medial portion of the lesion was aspirated using a 20-gauge needle under ultrasound guidance and had the appearance of old blood. The lateral portion of the lesion was biopsied with a 12-gauge vacuum-assisted core needle under ultrasound guidance. On pathology the lateral solid lesion was large duct papilloma, whereas the aspirated fluid contained old blood products.
6.7.4 Discussion
A discussion of complex cystic lesion is presented in Case ▶ 6.2.
It is important to determine if a lesion is a complicated cyst or a complex cystic mass. If the internal echoes are movable on B-mode imaging without stationary components the diagnosis of a complicated cyst can be made. If blood flow is noted on color or power Doppler within the “solid” component of the lesion the diagnosis of a complex cystic lesion can be made. However, there are many lesions that have characteristics between these two presentations. Internal debris can be stationary, such as in an acorn cyst, and solid components in a lesion may not have perceivable blood flow on color or power Doppler.
SE can be extremely helpful in distinguishing these two cases. When a solid component is present it will appear stiffer than the adjacent components in the lesion. If the internal echoes are freely moveable they will not affect the bull’s-eye artifact, and a diagnosis of a complicated cyst can be made. If the viscosity of the cystic component is very high, a bull’s-eye artifact will not occur, but it will code as soft. If there is a solid component the E/B ratio or strain ratio can be used to determine if the lesion is benign or malignant.
However, with shear wave imaging both complicated cysts and benign complex cystic lesions will color code as soft (Vs < 4.5 m/s [> 60 kPa]). If the solid component is a malignancy it will code as stiff (Vs > 4.5 m/s [> 60 kPa]). Therefore strain imaging is helpful in characterizing a cystic lesion as a complicated cyst or a complex cystic lesion, and, if a complex cystic lesion, whether it is benign or malignant. Shear wave imaging is helpful in determining if the lesion is benign or malignant.
In the presented case we have a lesion with both freely movable debris in one portion of the lesion and a solid component in the other. The solid component accounts for less than 50% of the lesion so this would be classified as a type 3 complex cystic lesion. On strain imaging the solid component of the lesion codes as stiff with an E/B ratio of 0.9. The other portion codes white (very soft). Because a bull’s-eye artifact is not identified the fluid is viscous enough to not allow the bull’s-eye artifact. Given that the patient presented with a bloody discharge the soft component is suggestive of a hematoma.
Shear wave imaging is not available in this case. We would expect that the solid component would code with a Vs suggestive of a benign lesion given that diagnosis is benign. The cystic component would color code as soft (Vs < 3 [28 kPa]).
Both Cases ▶ 6.6 and ▶ 6.7 in this chapter have the same pathological diagnosis of a large duct papilloma. In Case ▶ 6.6, the elastographic features were suggestive of a malignant lesion, whereas in Case ▶ 6.7, the elastographic features were suggestive of a benign lesion. It is not known if the elastographic features can determine the aggressiveness of the large duct papilloma (i.e., whether elastography can identify which lesions are at higher risk for conversion to a malignancy).
Based on the proposed elastography classification system (similar to the BI-RADS classification) presented in Chapter ▶ 5 we would consider this lesion to have an approximately 0% chance of malignancy.
6.8 Case 8: Fibrocystic Change—Lesion Blends in with Adjacent Tissue on Elastography
6.8.1 Clinical Presentation
A 55-year-old woman presents with a new partially obscured 1.5 cm mass in the left breast on screening mammography. Mammogram was classified as BI-RADS 0, and an ultrasound was recommended for further workup.
6.8.2 Ultrasound Findings
On B-mode ultrasound (▶ Fig. 6.8a,b) a heterogeneous, 1.5 cm well circumscribed hypoechoic, oval mass with internal septations is identified. Through transmission was noted. The lesion has internal blood flow with a blood vessel entering perpendicular to the capsule on color Doppler imaging (▶ Fig. 6.8c). The lesion was classified as BI-RADS 4A.
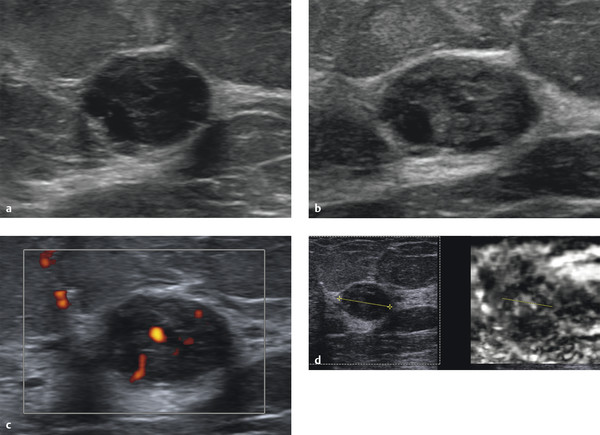
Fig. 6.8 (a) B-mode image of the lesion corresponding to the mammographic abnormality. The mass is a heterogeneous, hypoechoic, well circumscribed lesion with internal septations. There is refractive shadowing and some through transmission. (b) Another B-mode image of the lesion demonstrating the heterogeneity of the mass with a question of small calcifications. (c) Power Doppler evaluation of the mass demonstrates significant blood flow within the mass. (d) On strain elastography the lesion is also heterogeneous, and its borders are difficult to locate. To add in locating the lesion on the elastogram, the copy or shadow function has been used. The lesion in the left B-mode image was measured and the copy function used. The system places a dotted line in the exact on the elastogram as the measurement taken in the B-mode image. It is not uncommon for benign lesions to be poorly visualized on strain elastography because their elastic properties (stiffness) are similar to those of glandular tissue. (continued)
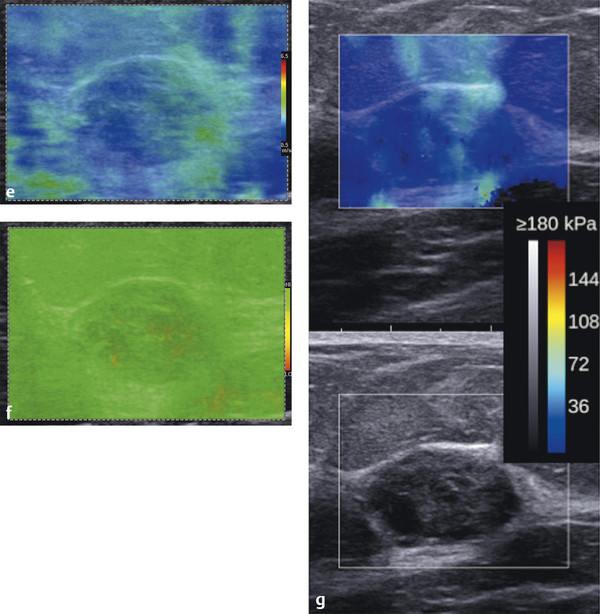
Fig. 6.8 (continued) (e) Shear wave elastogram demonstrating that the stiffness of the lesion is similar to adjacent breast tissue and has a Vs (color-coded blue) predictive of a benign lesion. (f) The corresponding quality map to the shear wave image in (e) confirms that the shear waves are adequate for accurate measurement (green = high quality). (g) Similar findings are obtained on a real-time shear wave system. The lesion color codes with a Vs of < 4.1 m/s (< 50 kPa).
On strain elastography (▶ Fig. 6.8d) the stiffness of the lesion is heterogeneous, containing both softer and stiffer components. The lesion is softer than the adjacent fibroglandular tissue. It is difficult to determine an E/B ratio because the lesion borders are difficult to determine on the elastogram. The use of the copy or shadow function is helpful in these cases. The lesion can be measured on the B-mode image and the measurement copied onto the elastogram. The lesion would have a score of 2 on the 5-point color scale. On shear wave imaging (▶ Fig. 6.8e) it has a Vs of 1.2 to 2.2 m/s (kPa values of 7 to 15). The quality map (▶ Fig. 6.8f) confirms that good quality shear waves were generated. Findings are similar on a second shear wave system (▶ Fig. 6.8g).
6.8.3 Diagnosis
Fibrocystic change and focal fibroadenomoid hyperplasia. The lesion was biopsied using a 12-gauge vacuum-assisted core biopsy needle. The pathology was fibrocystic change and focal fibroadenomoid hyperplasia.
6.8.4 Discussion
Fibrocystic change is a generalized term used to describe a variety of benign changes in the breast that affect both glandular and connective tissue. Symptoms of this condition are breast swelling or pain, as well as nodules, lumpiness, or nipple discharge. At least half of all women will be affected by fibrocystic change at some point in their life. Women of childbearing age are affected most commonly, but women of all ages can develop fibrocystic changes. Most of these symptoms stop after menopause, unless hormone replacement therapy is used.
Many fibrocystic changes are a reflection of the response of breast tissue to monthly hormonal changes. Even though these changes are very common and are not life threatening, some of the symptoms are similar to those of breast cancer, so it is important to evaluate the cause of the symptoms to rule out the possibility of cancer. In addition, some fibrocystic changes may indicate that a woman has an increased risk of later developing breast cancer. A definitive diagnosis will lead to a better understanding of breast cancer risk and the appropriate screening programs for a woman to follow.
Fibrosis refers to the formation of fibrous tissue. Fibrous tissue is the material that composes ligaments and scar tissue. Fibrous breasts have areas that feel firm or hard to the touch. No special treatment is required for this condition. Fibrosis is not associated with an increased breast cancer risk.
Mammography cannot reliably diagnose focal fibrocystic change due to a wide variation of imaging findings. On mammography focal fibrocystic change can mimic breast cancer when it presents as a discrete mass or density.70 In a study by Shetty and Shah71 the sonographic findings of focal fibrocystic change appeared as a solid mass in 47% and as cysts in 13%. In 15%, heterogeneously echogenic tissue was seen, and in the remaining 25% of cases, there was no sonographically visible focal change. In their study, 46.4% of the masses were classified as sonographically indeterminate, 1% as probably malignant, and 23% of masses were sonographically benign. A significant number of cases of focal fibrocystic change appear as solid masses. The sonographic features are not specific enough to differentiate between those that have a dominant component of focal fibrosis, sclerosing adenosis, or apocrine metaplasia from fibrocystic change without a specific histologic subtype. Many of these solid masses may appear indeterminate.71 Imaging findings on MRI are also nonspecific, with a significant number of cases having rapid enhancement and washout kinetics suggestive of a malignancy.70
In this case the patient presented with a mass on mammography that was a well-defined heterogeneous hypoechoic mass on ultrasound. The lesion had significant internal blood flow on power Doppler. On both SE and SWE the lesion is as soft as adjacent benign breast tissue. As is often the case with fibrocystic change the lesion is not well defined on strain elastography because the elastic properties (stiffness) of fibrocystic change are similar to glandular breast tissue. This can lead to difficulty in using the E/B ratio; however, these cases will usually color code with a score of 2 on the 5-point color scale and have a strain ratio of less than 4.5. It can be difficult to identify the lesion on the elastogram; the use of the copy, mirror, or shadow function is helpful to confirm the location of the lesion on the elastogram. On SWE the lesion borders are less critical because a quantitative measurement of the stiffness of the lesion can be obtained.
It is appropriate in BI-RADS category 4A lesions such as these that have concordant benign strain and shear wave findings to recommend a short-term interval follow-up as opposed to image-guided biopsy. Further study is needed to determine if these lesions can be classified as BI-RADS 2 if the SE and SWE findings are concordant and benign.
Based on the proposed elastography classification system (similar to the BI-RADS classification) presented in Chapter ▶ 5 we would consider this lesion to have an approximately 0% chance of malignancy.
6.9 Case 9: Fibrocystic Change—Fibroadenomoid Hyperplasia
6.9.1 Clinical Presentation
The patient is a 35-year-old woman with a strong family history of breast cancer at an early age. The patient has had yearly screening mammograms and ultrasound for 3 years. The patient’s screening mammogram was unchanged from prior studies, with heterogeneous dense breasts. The mammogram was classified as BI-RADS 2. Screening ultrasound was also performed.
6.9.2 Ultrasound Findings
On B-mode imaging (▶ Fig. 6.9a) there is a new 0.7 cm irregular hypoechoic lesion with internal septations in the right breast. On power Doppler imaging (▶ Fig. 6.9b) there is some internal blood flow. The lesion was classified as a BI-RADS category 4A.
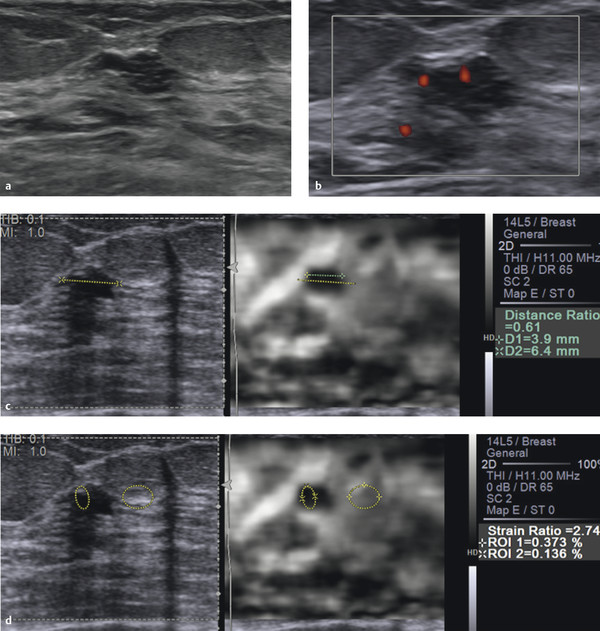
Fig. 6.9 (a) B-mode image of a lesion identified on ultrasound screening. The lesion is a 7 mm irregular well circumscribed lesion with septations. (b) On power Doppler imaging there is internal blood flow noted in the lesion. (c) On strain elastography the lesion is stiffer than surrounding tissue and has an E/B ratio of 0.6, suggestive of a benign lesion. In this case the copy or shadow function was used to copy the measurement of B-mode onto the elastogram. The B–mode copied measurement (yellow dotted line) was changed to correspond to the elastographic measurement (green dotted line), and the system automatically calculated the E/B ratio. This case would have a score of 3 on the 5-point color scale. (d) The lesion to fat ratio was also calculated. A region of interest (ROI) was placed to contain only surrounding fat and the second ROI placed in the lesion. The system calculated a strain ratio of 2.7; that is, the lesion is 2.7 times stiffer than fat. This finding is also suggestive of a benign lesion. (continued)
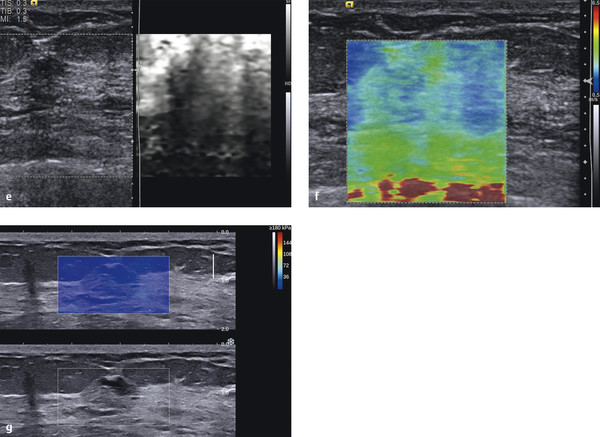
Fig. 6.9 (continued) (e) Using Virtual Touch Imaging (VTI, Siemens) (strain imaging using acoustic radiation force impulse [ARFI]) the lesion (arrows) appears stiffer than surrounding tissue and smaller than on the corresponding B-mode image. (f) On shear wave imaging the lesion codes soft with a Vs of 2.9 m/s (25 kPa), also suggestive of a benign lesion. (g) Similar findings of a benign lesion are found with a second shear wave system.
On SE (▶ Fig. 6.9c) the lesion is stiffer than surrounding breast tissue and has an E/B ratio of 0.61, suggestive of a benign lesion. The strain ratio (lesion to fat ratio) is 2.7, also suggestive of a benign lesion (▶ Fig. 6.9d). On the 5-point color scale this lesion would have a score of 3. On VTI (▶ Fig. 6.9e) the lesion is stiffer than surrounding tissue and smaller on the elastogram than the B-mode image, consistent with the manual displacement strain findings. On shear wave imaging the lesion color codes soft with a Vs of 2.9 m/s (25 kPa) on one system (▶ Fig. 6.9f) and 2.6 m/s (20 kPa) on another (▶ Fig. 6.9g), both suggestive of a benign lesion.
6.9.3 Diagnosis
Fibroadenomoid hyperplasia. The lesion was biopsied using a 12-gauge vacuum-assisted core biopsy needle. The pathology was fibrocystic change and focal fibroadenomoid hyperplasia, negative for atypia.
6.9.4 Discussion
Fibroadenomatoid hyperplasia is a well described but rare benign breast lesion with composite features of fibroadenoma and fibrocystic change. This condition was previously described as sclerosing lobular hyperplasia, fibroadenomatosis, or fibroadenomatoid mastopathy.72–74 It is characterized by a microfocal proliferation of fibrous stroma containing hyperplastic epithelial elements similar to those seen in fibroadenoma. No well circumscribed mass lesion and no apparent capsule are seen. It may be a localized or diffuse process. The mean age of presentation is in the third decade, occurring in approximately 5 to 7% of benign surgical biopsies.73
The findings in this case are different than those in Case ▶ 6.8. The lesion in this case is stiffer than surrounding glandular tissue and is therefore easily identified on the strain elastogram. The E/B ratio and strain ratio (lesion to fat ratio) are easily calculated. All of the strain findings are suggestive of a benign lesion. In our lab we use an EI/B ratio of < 1 as suggestive of a benign lesion and an EI/B ratio of ≥ 1 as suggestive of a malignant lesion. We use a strain ratio of < 4.5 as suggestive of a benign lesion and > 4.5 as suggestive of a malignant lesion. The shear wave finds in both systems are also suggestive of a benign lesion with Vs of < 4.5 (< 60 kPa). These cutoff values were determined from the results of several hundred biopsy-proven cases with a wide range of pathology.
When both the strain and the shear wave finds are concordant there is increased confidence in the characterization of the mass. In this case the BI-RADS category 4A finds could have been downgraded to a BI-RADS category 3 lesion. With future study it may be possible to downgrade the lesion to BI-RADS category 2 when both strain and shear wave findings are concordant.
Based on the proposed elastography classification system (similar to the BI-RADS classification) presented in Chapter ▶ 5 we would consider this lesion as having an approximately 0% chance of malignancy.
6.10 Case 10: Fibrocystic Change—Lesion Blends in with Adjacent Tissue on Elastography
6.10.1 Clinical Presentation
A 53-year-old woman presented with a new palpable mass in her right breast. A diagnostic mammogram was negative (BI-RADS category 1). The patient was referred for a diagnostic ultrasound.
6.10.2 Ultrasound Findings
A 1.9 × 0.4 cm hypoechoic lobular lesion with some posterior shadowing adjacent to dense glandular tissue is identified on B-mode imaging (▶ Fig. 6.10a). There is a small amount of blood flow adjacent to the lesion on color Doppler imaging (▶ Fig. 6.10b). The lesion was classified as BI-RADS category 4A.
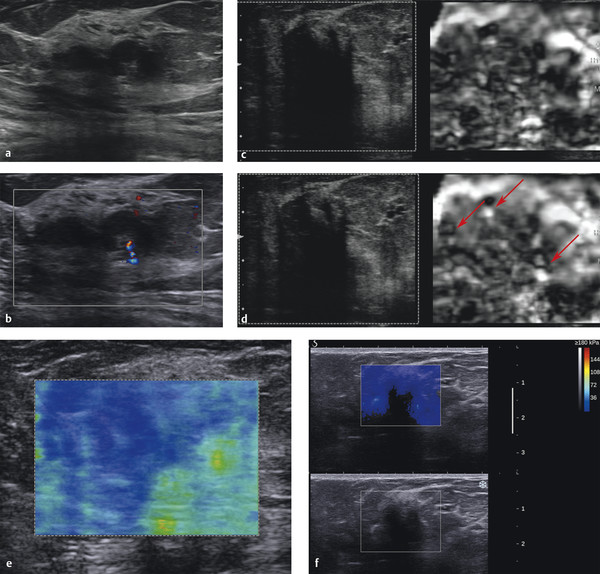
Fig. 6.10 (a) The palpable mass corresponded to a lobular hypoechoic lesion with some posterior shadowing on B-mode imaging. Note that the lesion is surrounded by glandular tissue. (b) On color Doppler evaluation the lesion has some blood flow adjacent to the lesion but no internal blood flow. (c) On strain elastography the lesion is not identified and blends in with the adjacent glandular tissue. This lesion has a score of 2 on the 5-point color scale. The E/B ratio cannot be accurately calculated. By using the copy function to locate the lesion a strain ratio (lesion to fat ratio) can be calculated (not performed in this case). (d) The strain elastogram in a different location demonstrates several bull’s-eye artifacts (arrows), suggesting there are several small cystic areas within or adjacent to the lesion. (e) On shear wave imaging the lesion has a low Vs of 2.2 m/s (15 kPa), suggestive of a benign lesion. (f) On a different shear wave system the lesion does not color code. This can be due to one of several factors: (1) the shadowing in the lesion prevented the tracking B-mode pulses from getting an accurate returned signal to calculate the Vs, (2) patient or sonologist movement may have led to poor shear waves and the system rejected the data and therefore did not color code the lesion. There is a surrounding ring of high Vs noted.
The lesion is minimally stiffer than the adjacent fatty tissue but of similar stiffness to adjacent glandular tissue on strain elastography (▶ Fig. 6.10c). Because the lesion is of similar stiffness to the adjacent glandular tissue, the borders of the lesion are not identified, and an E/B ratio cannot be accurately calculated. But because we know the lesion’s stiffness is similar to the glandular tissue we can assume the lesion has a high probability of being benign. Note that on the elastogram there are several bull’s-eye artifacts, suggesting several cystic components in the lesion (▶ Fig. 6.10d). On the 5-point color scale this lesion would have a score of 2. A strain ratio (lesion to fat ratio) was not performed. In cases such as these where there are both cystic and solid components care must be taken in calculating the strain ratio because the value will be inaccurate if both cystic and solid components are included in the region of interest (ROI). On shear wave imaging (▶ Fig. 6.10e,f) the lesion has a low Vs of 1.2 m/s (7 kPa).
6.10.3 Diagnosis
Fibrocystic change. The lesion was biopsied using a 12-gauge vacuum-assisted core biopsy needle. The pathology was fibrocystic change.
6.10.4 Discussion
Many breast lumps turn out to be caused by fibrosis or cysts, benign changes in breast tissue that happen in many women at some time in their lives. Fibrosis is the formation of scarlike (fibrous) tissue, and cysts are fluid-filled sacs. These changes are called fibrocystic changes, and were previously called fibrocystic disease. They are most often diagnosed based on symptoms, such as breast lumps, swelling, and tenderness or pain. These symptoms tend to be worse just before a woman’s menstrual period is about to begin. The patient’s breasts may feel lumpy and, sometimes, a clear or slightly cloudy nipple discharge will be noticed.
These changes are most common in women of childbearing age, but they can affect women of any age. They are the most common benign condition of the breast. They may be found in different parts of the breast and in both breasts at the same time.
Many different histologic changes can be found in fibrocystic breast tissue. Most of these changes reflect the way the woman’s breast tissue has responded to monthly hormone changes and have little other importance.
This case is similar to Case ▶ 6.8, where the elastographic features of the lesion are similar to those of the surrounding glandular tissue and the lesion is therefore poorly visualized on the strain elastogram. It is difficult to measure the E/B ratio in these cases. By using the copy or shadow function the lesion location can be identified on the elastogram and the strain ratio (lesion to fat ratio) calculated. A 5-point color score can also be given and is usually a score of 2 as in this case. Knowing that the stiffness of the lesion is similar to glandular tissue is suggestive of a benign lesion. The added confidence of low Vs on shear wave imaging as in this case increases confidence the lesion is benign. Elastography could have been used to downgrade this lesion from a BI-RADS category 4A to a BI-RADS category 3. Further studies are need to determine if the lesion could be downgraded to a BI-RADS category 2 lesion based on concordant strain and shear wave benign findings.
Based on the proposed elastography classification system (similar to the BI-RADS classification) presented in Chapter ▶ 5 we would consider this lesion to have an approximately 0% chance of malignancy.
6.11 Case 11: Fibrocystic Change—Stromal Fibrosis
6.11.1 Clinical Presentation
A 41-year-old woman was noted to have a new asymmetric density in her right breast on screening mammography. Spot compression views confirmed the presence of the asymmetry. The lesion was classified as BI-RADS category 0, and ultrasound was advised for further workup.
6.11.2 Ultrasound Findings
On B-mode imaging (▶ Fig. 6.11a) a 1.6 cm irregular, spiculated, hypoechoic mass is identified. A single vessel entering the lesion perpendicular to the lesion is identified on power Doppler imaging (▶ Fig. 6.11b). The lesion was classified as BI-RADS category 4C.
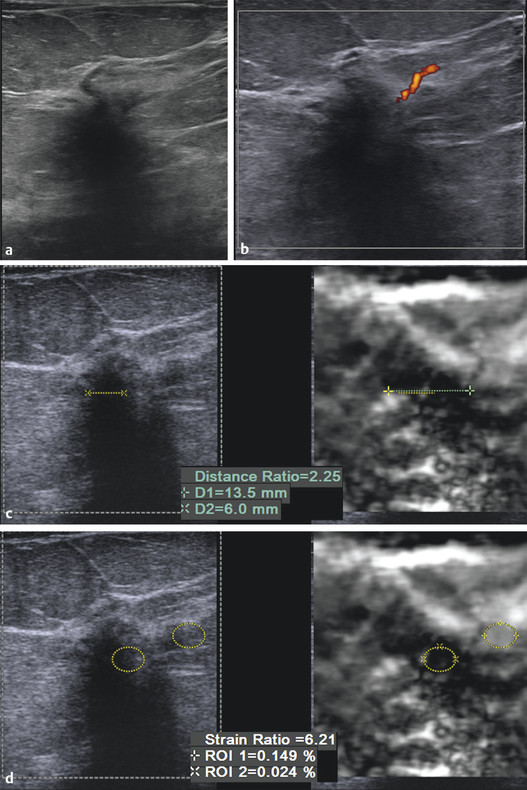
Fig. 6.11 (a) B-mode imaging of the lesion noted on screening mammography demonstrates the lesion is irregular, hypoechoic with shadowing. (b) On power Doppler imaging there is a single vessel entering perpendicular to the lesion. (c) The lesion is stiffer than surrounding tissue and increased in size compared with the corresponding B-mode image, with an E/B ratio of 2.3. The findings are suspicious for a malignancy. (d) The strain ratio (lesion to fat ratio) of the lesion is 6.2 suggestive of a malignant lesion. (continued)
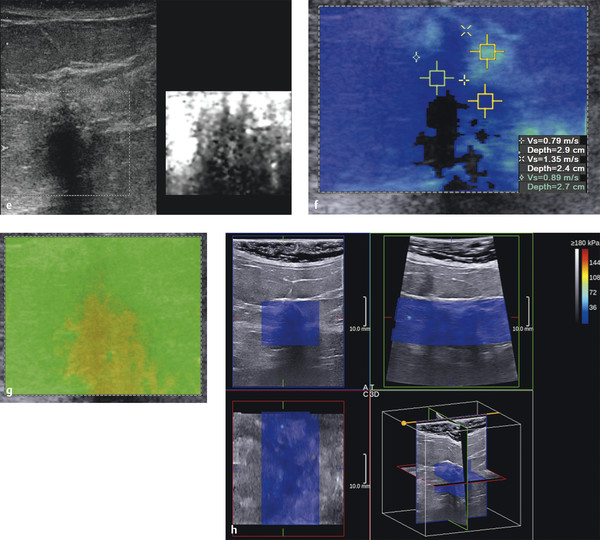
Fig. 6.11 (continued) (e) Using Virtual Touch Imaging (VTI, Siemens) (strain imaging using acoustic radiation force impulse [ARFI]) has similar findings to strain imaging using manual displacement (c). (f) On shear wave imaging a portion of the lesion does not color code, implying adequate shear waves were not generated. Other portions of the lesion have low Vs of 0.9 m/s (5 kPa). (g) The associated quality map codes yellow (poor quality) in the portions of the lesion that code blue in the velocity map (f). Thus the findings of low Vs should not be used in evaluation of the lesion. The quality map has greater sensitivity in evaluating the shear wave quality than the older algorithm that does not color code areas of poor shear waves. In this case, the area not color coded in the velocity map was rejected by the initial algorithm, but some areas with poor shear wave generation were color coded. The addition of the second algorithm (the quality map) rejects additional poor shear waves. (h) Three-dimensional shear wave elastography of the lesion. With this system the entire lesion has a low Vs of 2.6 m/s (20 kPa).
On SE (▶ Fig. 6.11c) the lesion is stiffer than adjacent normal breast tissue with an E/B mode ratio of 2.3. The lesion to fat ratio was 6.2 (▶ Fig. 6.11d). This lesion has a score of 5 on the 5-point color scale. On VTI (strain imaging using ARFI) similar findings are obtained (▶ Fig. 6.11e), a stiff lesion that is larger on the elastogram. On shear wave imaging (▶ Fig. 6.11f) the lesion does not color code, with a Vs of 1.4 m/s (9 kPa) adjacent to the lesion. The quality map (▶ Fig. 6.11g) confirms that shear waves were of poor quality and should not be used in characterizing the mass. On a 3D shear wave elastogram (▶ Fig. 6.11h) no elevated Vs is noted.
6.11.3 Diagnosis
Focal columnar cell change and stromal fibrosis. There was no evidence of epithelial atypia or neoplasm.
6.11.4 Discussion
Epithelial hyperplasia is a condition in which there is an increase in the number of normal cells that line either the ducts (ductal hyperplasia) or the lobules (lobular hyperplasia) of the breast. This condition is also referred to as proliferative breast disease. Epithelial hyperplasia can be diagnosed by core needle biopsy or surgical biopsy.
When examined under a microscope, hyperplasia may be classified as follows:
Usual type, meaning there is an increase in the number of cells, but the cells look normal
Atypical, meaning there is an increase in the number of cells and the cells are not quite normal appearing
On average, about 70% of biopsy specimens do not contain any hyperplasia. About 26% have usual hyperplasia and only 4% have atypical hyperplasia.
In this case all of the SE techniques suggest this lesion is malignant. The shear wave imaging from one system does not color code a portion of the lesion. The other areas code soft (blue); however, the quality map is yellow (poor-quality shear waves) throughout the lesion. In general when the lesion is solid and the quality map is poor quality (yellow or red) the lesion, if not a simple cyst, has a high probability of being malignant.
In general benign solid lesions propagate shear waves well and usually have a high (green) quality map. Some cancers, for reasons not yet fully understood, do not generate shear waves that can be accurately measured. In some of these cases the lesion will not color code, whereas others may color code as soft inaccurately. The quality map can help determine which of these cancers codes incorrectly.
In this case, the area not color coded in the velocity map was rejected by the initial algorithm, but some areas with poor shear wave generation were color coded. The addition of the second algorithm (the quality map) rejects additional poor shear waves. Improved algorithms will allow for improved color coding so these lesions are not color coded as opposed to coding soft.65 Some benign lesions, particularly sclerotic lesions, also have elastographic findings suggestive of a malignant lesion. Other lesions that may have false-positive elastography findings are fat necrosis and mastitis. These are discussed in Cases 23, 24, 25, 26, 29, and 30 in detail.
Presently there are no studies evaluating the elastographic findings in the spectrum of usual hyperplasia, atypical ductal hyperplasia, and DCIS. In our experience, both usual hyperplasia and atypical ductal hyperplasia have elastographic findings of benign lesions. DCIS is discussed in Case ▶ 7.1 and ▶ 7.2.
Based on the proposed elastography classification system (similar to the BI-RADS classification) presented in Chapter ▶ 5 we would consider this lesion to have a > 95% chance of malignancy (> 95% on SE; indeterminate on SWE due to poor-quality shear waves).
6.12 Case 12: Sclerosing Lesion—Sclerosis Lobulitis
6.12.1 Clinical Presentation
The patient is a 36-year-old woman who had an abnormal area of enhancement on an MRI scan for further workup of a palpable mass in the right breast. The patient’s recent mammogram was classified as BI-RAD 1 but was heterogeneously dense.
6.12.2 Ultrasound Findings
On B-mode imaging (▶ Fig. 6.12a) an isoechoic lesion with ill-defined borders is identified within glandular tissue. On color Doppler (▶ Fig. 6.12b) there is no flow within the lesion. The lesion was classified as a BI-RADS category 3 lesion.
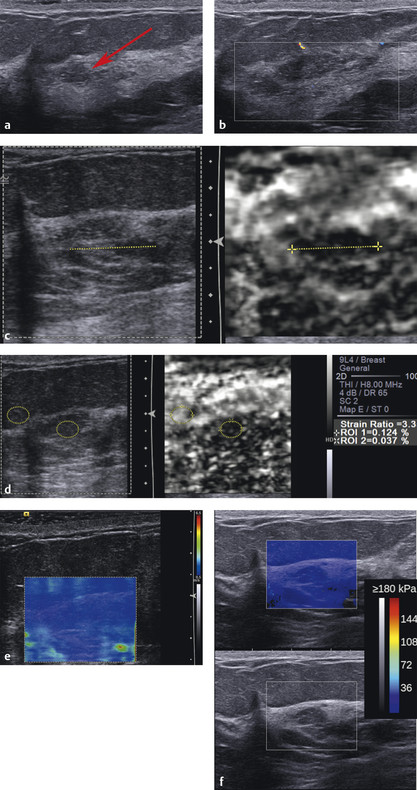
Fig. 6.12 (a) On B-mode imaging there is a hypoechoic lesion (arrow) corresponding to the area of abnormality on the mammogram. The lesion is within an area of dense glandular tissue. (b) On color Doppler imaging there is minimal flow adjacent to the area of concern. (c) Strain imaging identifies a stiff area compared to adjacent fatty tissue. In this case the lesion is best identified on the elastogram. The lesion was measured on the elastogram (yellow dotted line) and the copy function used to locate the lesion on the B-mode image. Measuring the lesion on B-mode is problematic; therefore the E/B ratio cannot be accurately calculated. (d) The strain ratio (lesion to fat ratio) can be calculated measuring 3.3 suggestive of a benign lesion. (e) On shear wave imaging the lesion and surrounding area has a low Vs (blue) suggestive of a benign lesion. (f) Shear wave imaging on a different system also has similar benign findings.
On strain imaging (▶ Fig. 6.12c) the lesion is stiffer than the adjacent glandular tissue. A fat lobule can be excluded based on this elastogram because the lesion is stiffer than other fat in the image as well as adjacent glandular tissue. If the lesion were a fat lobule it would have coded as soft as adjacent fat (white). The E/B ratio is difficult to calculate because the lesion’s stiffness appears similar to that of the adjacent glandular tissue and cannot be accurately measured (▶ Fig. 6.12d). The strain ratio (lesion to fat ratio) is 3.35 (▶ Fig. 6.12e). On the 5-point color scale this lesion would be classified with a score of 3. On shear wave imaging (▶ Fig. 6.12f) the lesion has a Vs of 2.4 m/s (18 kPa).
6.12.3 Diagnosis
Sclerosing lobulitis. The lesion was biopsied with a 12-gauge vacuum-assisted needle. The pathology was sclerosing lobulitis.
6.12.4 Discussion
Adenosis is an enlargement or excessive growth of lobular tissues (the outer end of the ducts). Sclerosing adenosis is a form of adenosis caused by distortion of the enlarged lobule by fibrous tissue. If a number of enlarged lobules are found near one another, the collection of lobules may be detected by palpation; otherwise, the condition is detected by mammography. Whether detected by palpation or by mammography, these lesions can be mistaken for cancer, so core needle biopsy is needed to determine whether cancer cells are present. In some instances, a surgical biopsy is required for a definitive diagnosis. Women with adenosis have about 1.5 to 2 times the risk of the general population for developing breast cancer.
In this case the lesion is stiffer than the adjacent breast tissue, but a closer look confirms that the stiff area on the strain elastogram also includes the adjacent glandular tissue. Therefore the lesion’s stiffness is similar to that of glandular tissue, and an accurate E/B ratio cannot be caluclated, but it is probably benign. We can use the strain ratio (lesion to fat ratio) or the 5-point color scale, which in this case are both suggestive of a benign lesion. On both shear wave systems there is a low Vs suggestive of a benign lesion.
Based on the proposed elastography classification system (similar to the BI-RADS classification) presented in Chapter ▶ 5 we would consider this lesion to have an approximately 0% chance of malignancy.
6.13 Case 13: Fibroadenoma—Soft Fibroadenoma
6.13.1 Clinical Presentation
A 39-year-old woman presented with a palpable mass in the left breast. Mammography was not performed. Ultrasound was requested as the initial exam for workup.
6.13.2 Ultrasound Findings
B-mode imaging (▶ Fig. 6.13a) demonstrates a well-circumscribed 1.5 cm oval hypoechoic mass. There is moderate blood flow within the lesion on color Doppler imaging (▶ Fig. 6.13b). The lesion was classified as BI-RADS category 3.
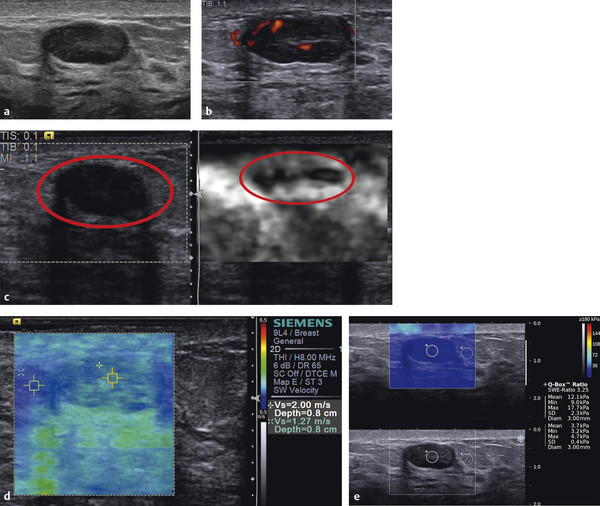
Fig. 6.13 (a) The palpable mass is a 1.5 cm well circumscribed hypoechoic mass with refractive shadowing and through transmission. (b) On power Doppler imaging the lesion has moderate internal blood flow. (c) On strain elastography the lesion (circle) is mostly soft with stiffness similar to adjacent breast tissue. The lesion has a score of 2 on the 5-point color scale. The E/B ratio is less than 1, suggestive of a benign lesion. (d) On shear wave imaging the lesion has a Vs of 2 m/s (13 kPa) concordant with strain imaging of a benign lesion. (e) Shear wave imaging on a different system has similar benign findings with a Vs of 2 m/s (12.1 kPa).
On SE (▶ Fig. 6.13c) the lesion is stiffer than surrounding breast tissue and significantly smaller on the elastogram. On the 5-point color scale this lesion has a score of 3. On shear wave imaging (▶ Fig. 6.13d,e) the lesion has a Vs of 1.9 m/s (12 kPa) with the adjacent fat having a Vs of 0.7 m/s (3.7 kPa). Both the strain and shear wave findings are suggestive of a benign lesion.
6.13.3 Diagnosis
Fibroadenoma. The patient elected biopsy over a short-term follow-up. The lesion was biopsied using a 12-gauge vacuum-assisted core needle. The pathology was a fibroadenoma.
6.13.4 Discussion
Fibroadenomas are benign tumors made up of both glandular breast tissue and stromal (connective) tissue. They are most common in young women in their 20s and 30s, but they may be found in women of any age. The use of birth control pills before 20 is linked to an increased risk of fibroadenomas. Some fibroadenomas are too small to be palpated, but others can be several centimeters in length. They tend to be oval or round and have well defined distinct borders. They often feel like a marble within the breast. They can move under the skin and they are usually firm and not tender. Fibroadenomas can be solitary or multiple.
Fibroadenomas can be diagnosed by fine-needle aspiration (FNA) or core needle biopsy. Fibroadenomas may be simple, being composed of homogeneous tissue. But some fibroadenomas can contain other components (macrocysts, sclerosing adenosis, calcifications, or apocrine changes). These are called complex fibroadenomas. Women with fibroadenomas have been reported to have a slightly increased risk of breast cancer (about 1½ to 2 times the risk of women with no breast changes).
This case has the classical appearance of a fibroadenoma on ultrasound. The lesion is well circumscribed, is hypoechoic, and has refractive shadowing and through transmission. Lesions with this appearance are classified as BI-RADS category 3 lesions requiring short-term interval follow-up. Many women request biopsy to confirm the lesion is benign. If there are multiple bilateral well circumscribed cystic and solid lesions the lesions can be classified as BI-RADS 2, not requiring short-term interval follow-up. If there is a dominant lesion or a palpable lesion classification as BI-RADS category 2 should not be used. Elastography can be helpful to either upgrade or downgrade BI-RADS category 3 lesions. If the lesion has a benign appearance on SE and/or SWE the possibility of downgrading to BI-RADS category 2 has been suggested, but it is not yet suggested in the BI-RADS lexicon. Informing a patient that elastography is suggestive of a benign lesion may decrease the requests for biopsy and decrease the patient’s concerns in waiting for a short-term interval follow-up.
Related posts:

Stay updated, free articles. Join our Telegram channel

Full access? Get Clinical Tree


